
Key takeaways
- Bitcoins price hit new all-time highs several times in late 2020. The first cryptocurrency surged by more than 300%, eclipsing traditional assets.
- Ethereum rose 456%, but did not surpass January 2018s price peak.
- The “Greed and Fear Index” remained at extreme values throughout December.
- Trading volumes across spot, futures and options markets reached record highs.
- Total value locked in the DeFi sector rose twentyfold over the year, surpassing $15 billion.
- DEX turnover in 2020 surpassed $120 billion.
- Stablecoin market capitalization grew more than fivefold, approaching $30 billion.
- Bitcoin hash rate and miners revenues rose substantially, despite the halving.
- Institutional investors bought more than 1 million BTC worth over $35 billion.
- The year was memorable for regulatory shifts and central-bank CBDC initiatives.
Performance of leading assets


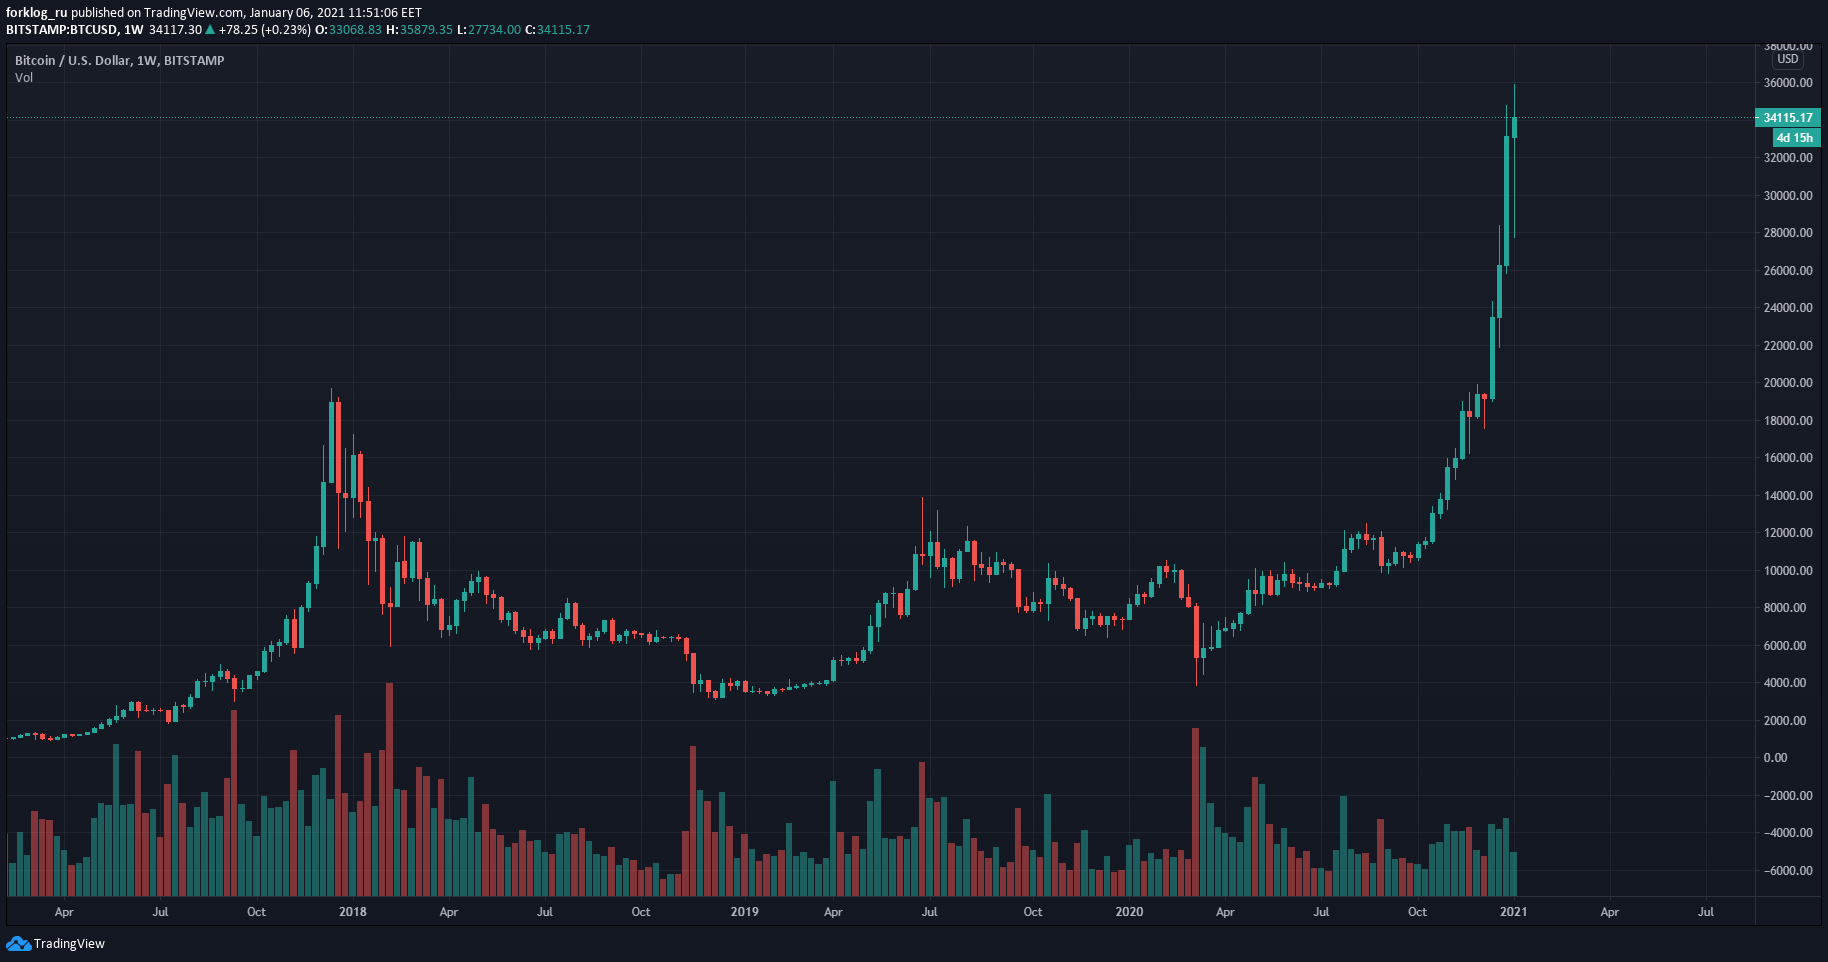
Weekly BTC/USD chart on Bitstamp. Data: TradingView (as of 6 Jan 2021).
2020 proved to be one of the most eventful years in the industry. Despite a 50% drawdown in March, Bitcoin finished the year up 304%, having hit new all-time highs several times. By early January 2021, Bitcoin traded above $35,000, and the crypto market cap hit new highs well above $900 billion.


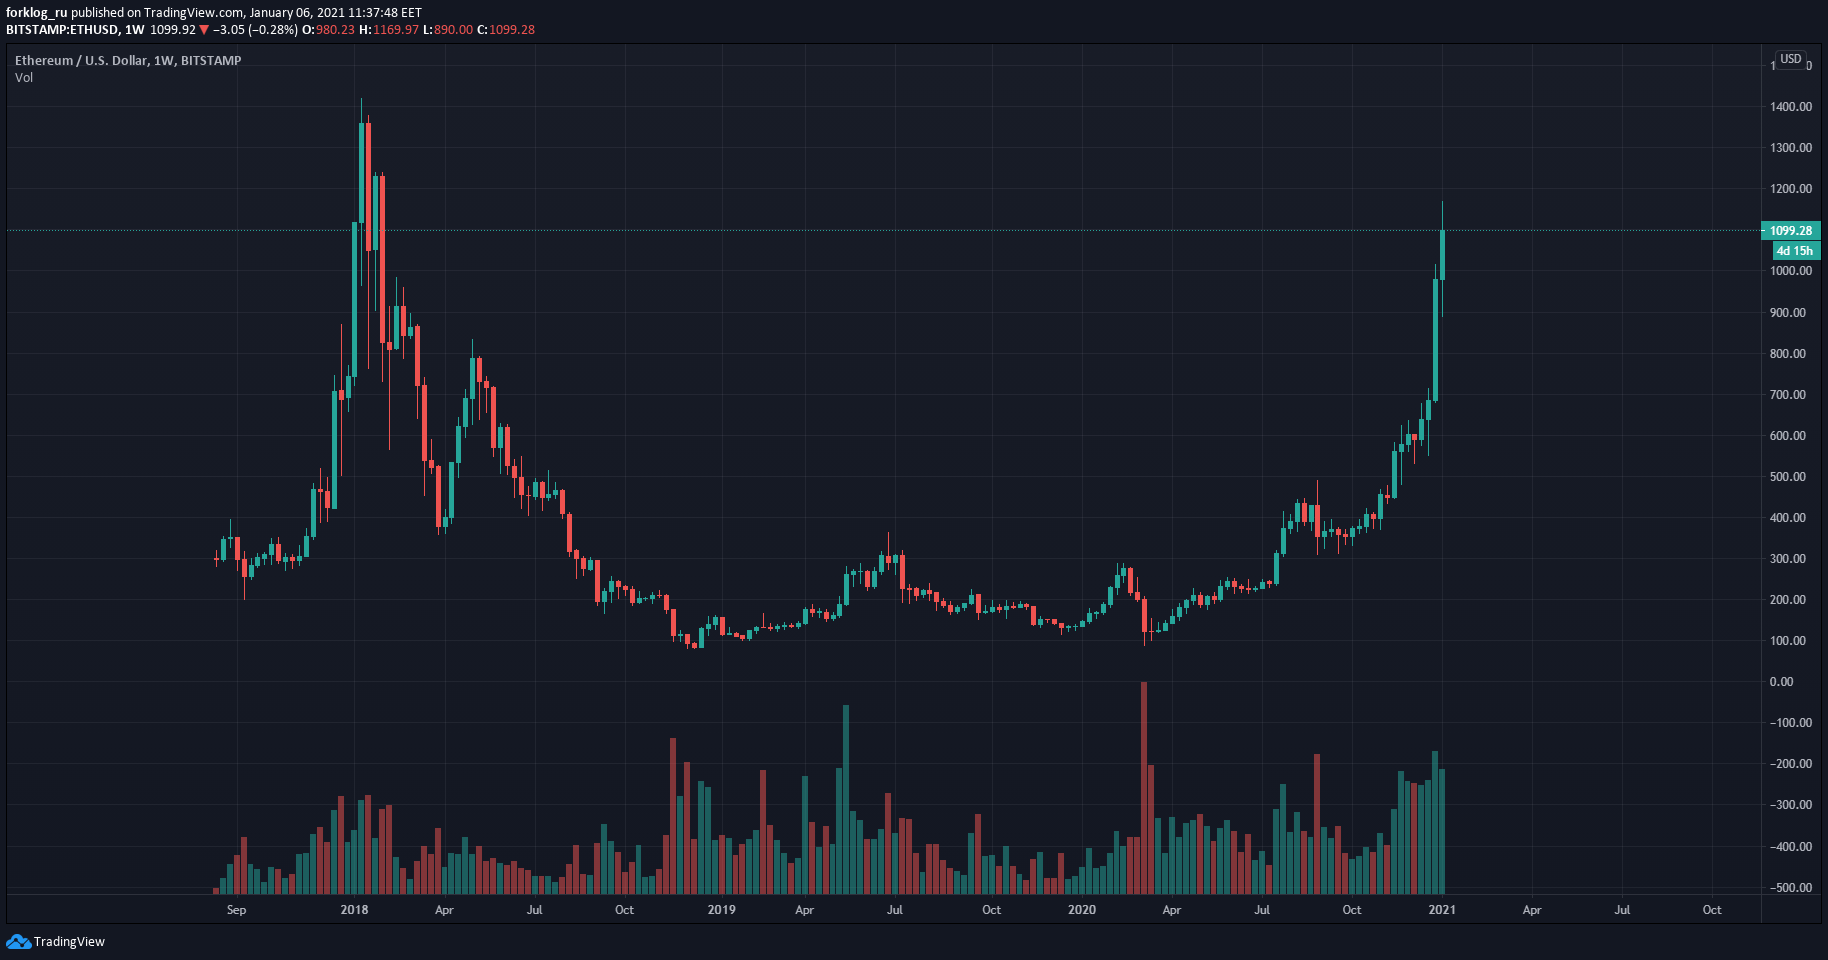
Weekly ETH/USD chart on Bitstamp. Data: TradingView (as of 6 Jan 2021).
Ethereum, the second-largest cryptocurrency, delivered an impressive 456% gain in 2020, though it did not beat the 2018 high. The rise was largely driven by the successful launch of Ethereum 2.0s phase zero, which envisages a shift from PoW mining to Proof-of-Stake.
In early January 2021, Ethereum traded above $1,150, yet remained below its all-time high.


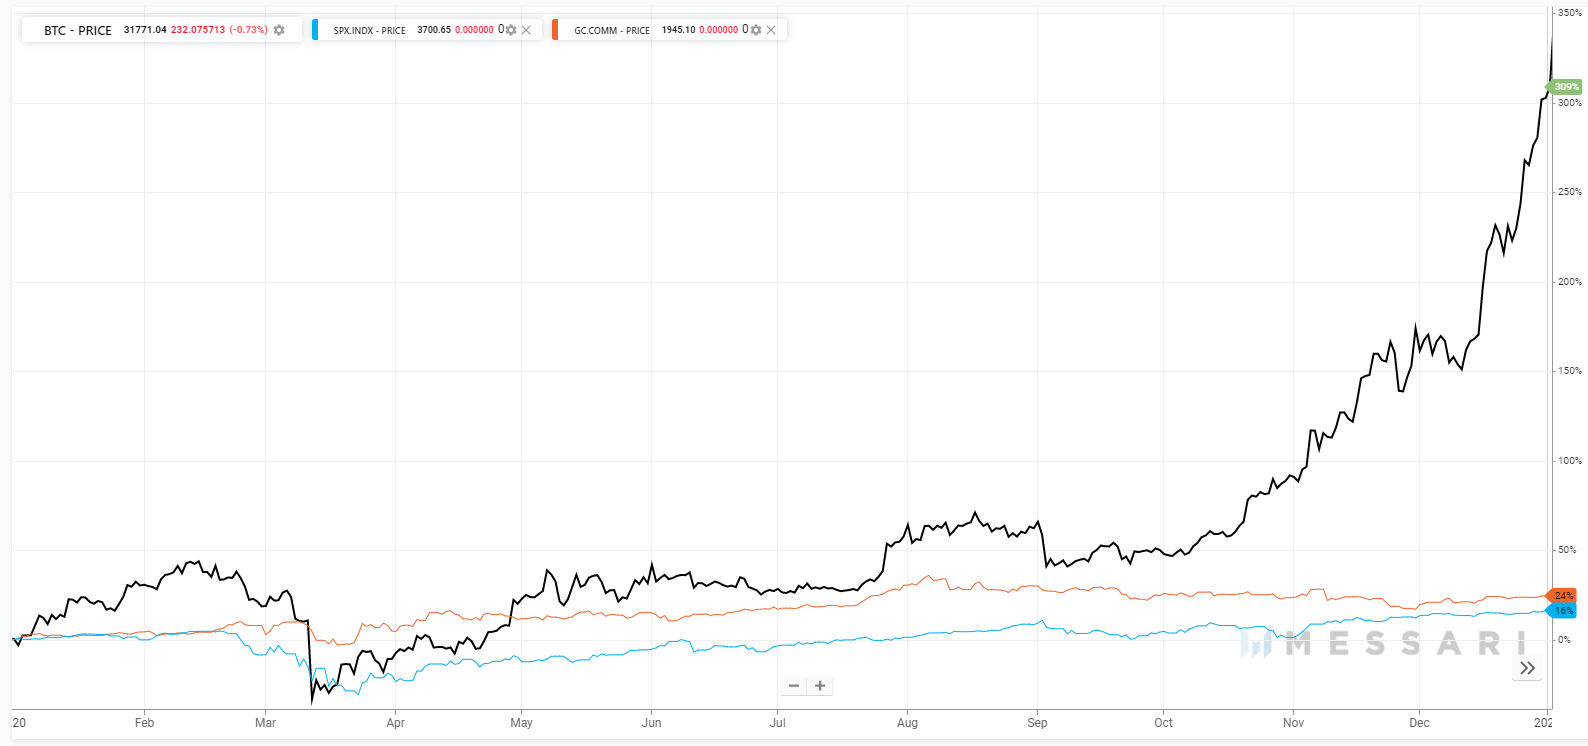
Bitcoin price, S&P 500 index and gold in 2020. Data: Messari.
Against Bitcoin, gold and the S&P 500 performed modestly, rising 24% and 16% respectively over the year.
Market mood and correlations


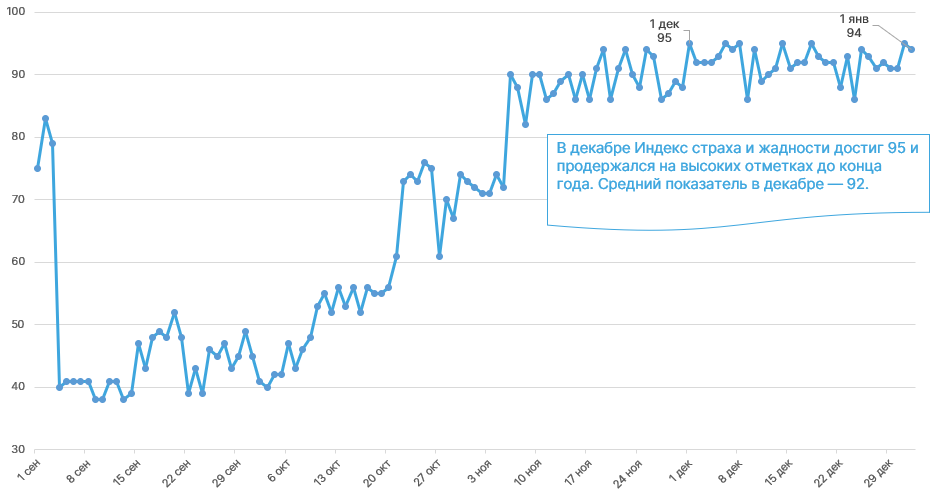
Dynamic of the Fear & Greed Index. Data: alternative.me.


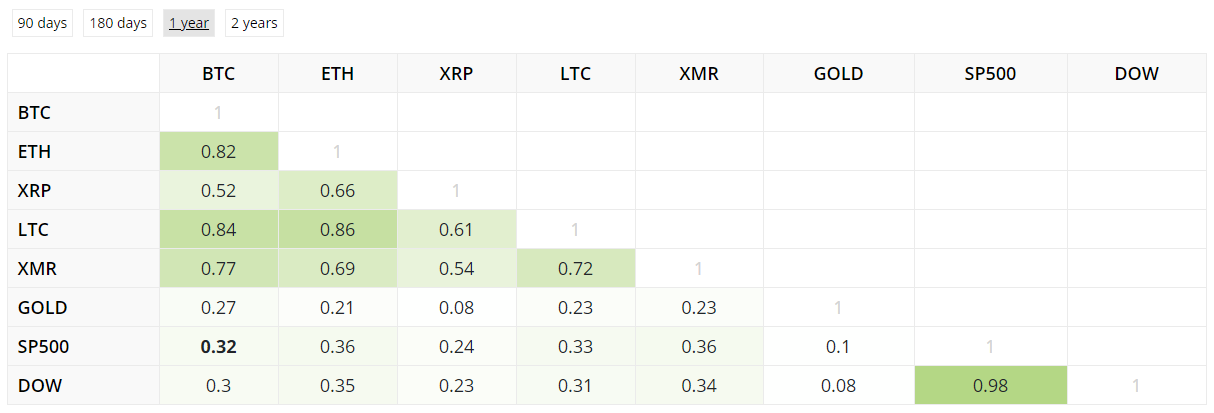
Asset correlations over the last year. Data: BlockchainCenter.
Trading volumes


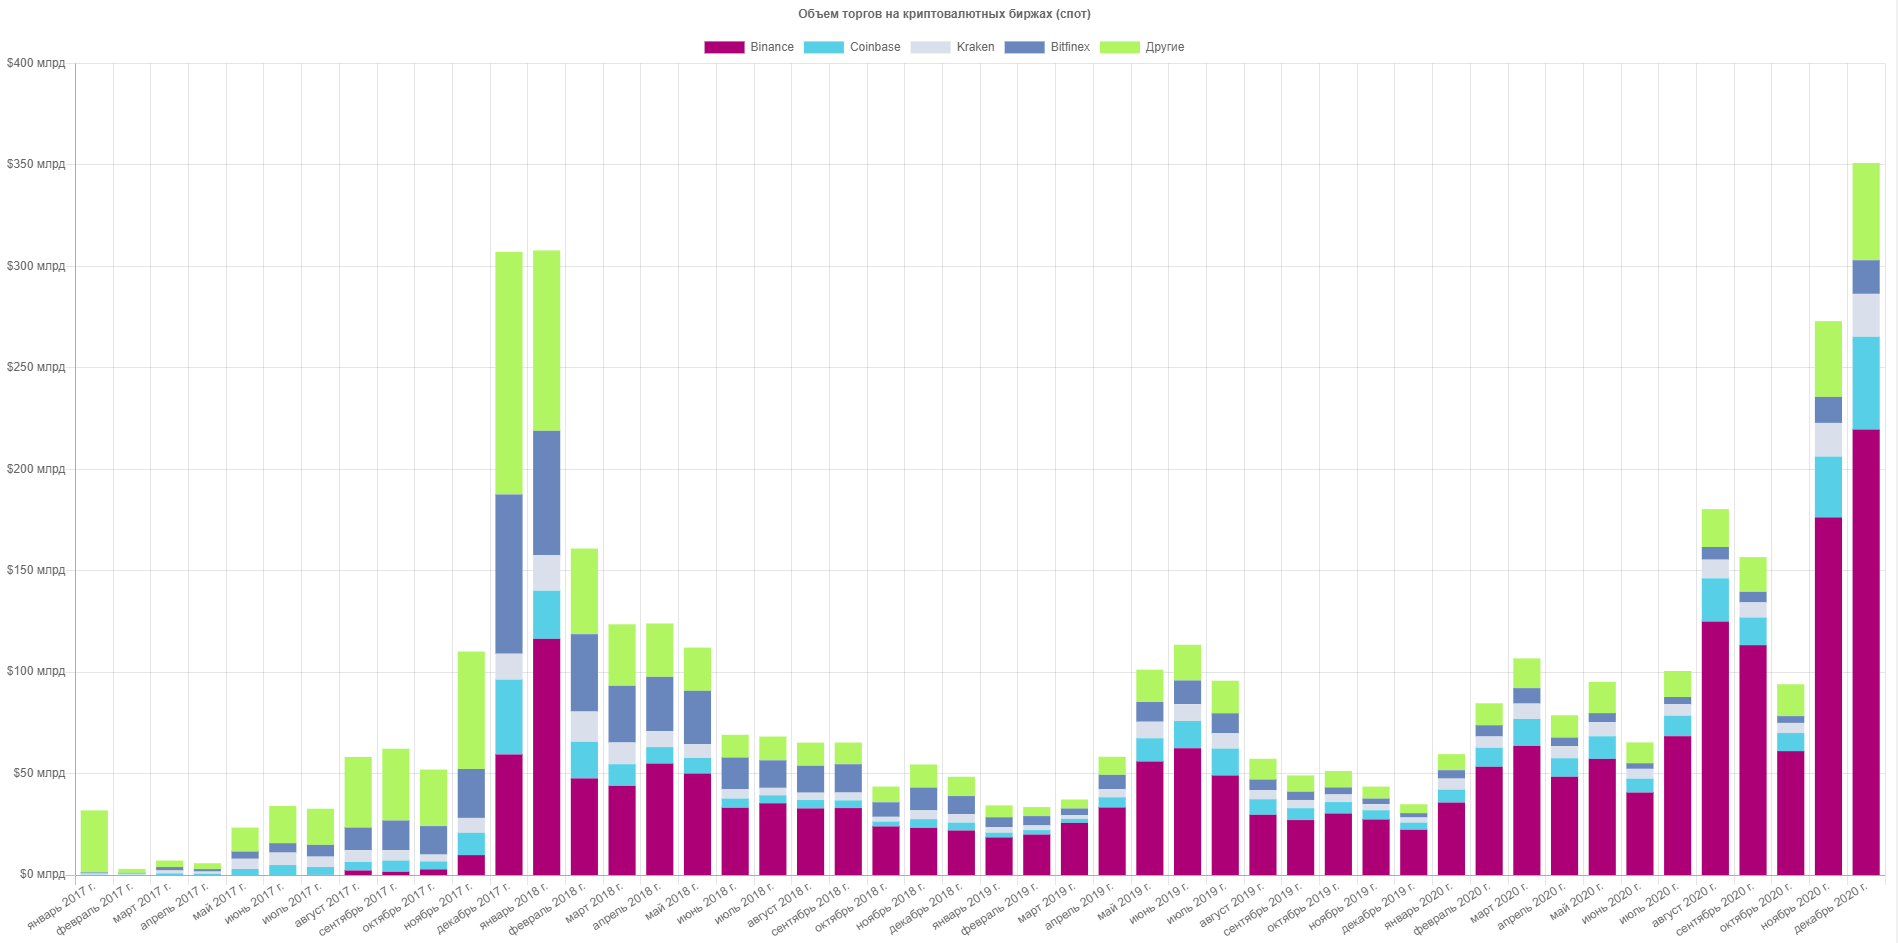
Spot trading volumes, $ bln. Data: CryptoCompare.
- December 2020 saw spot-market turnover at a record high, reaching $350 billion on key exchanges (the prior records were $307 billion in December 2017 and January 2018).
- By exchange, the absolute leader remained Binance, which accounted for $219 billion. The daily spot-volume peak on Binance reached $15 billion, and the average annual turnover stood at $3.88 billion (+36% vs. 2019). The total trading volume on the Binance ecosystem in 2020 exceeded $3 trillion.
- According to CryptoCompare, Coinbase ($45 billion) and Kraken ($21 billion) also ranked in the top-3 by monthly turnover in December.
Futures and options


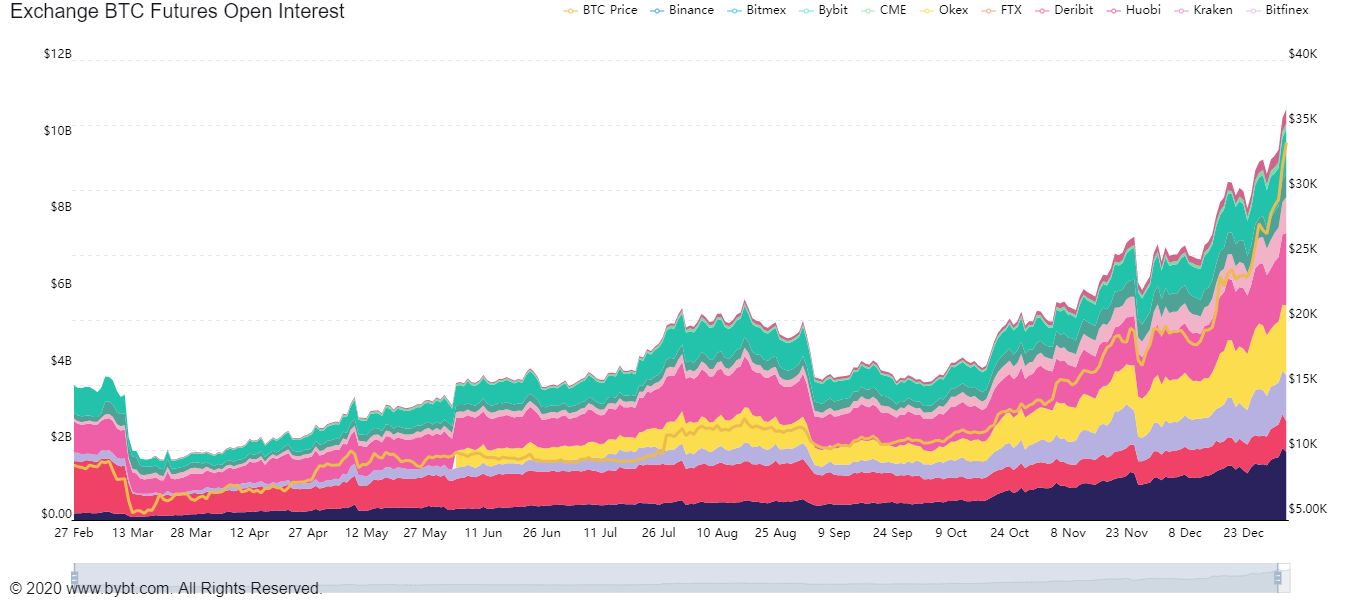
Open interest dynamics in Bitcoin futures. Data: bybt.com.


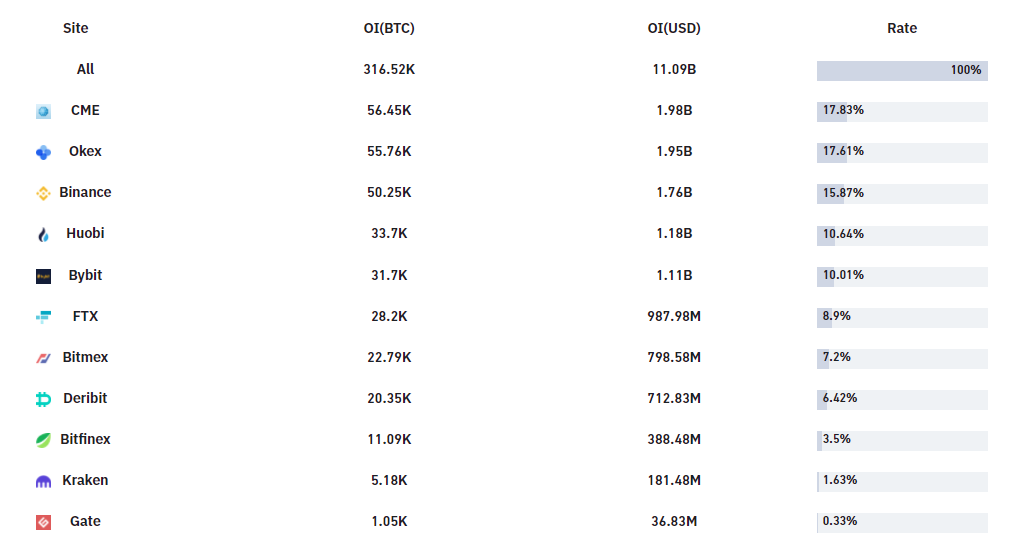
CMEs share of open interest in Bitcoin futures. Data: bybt (as of 06.01.2021).


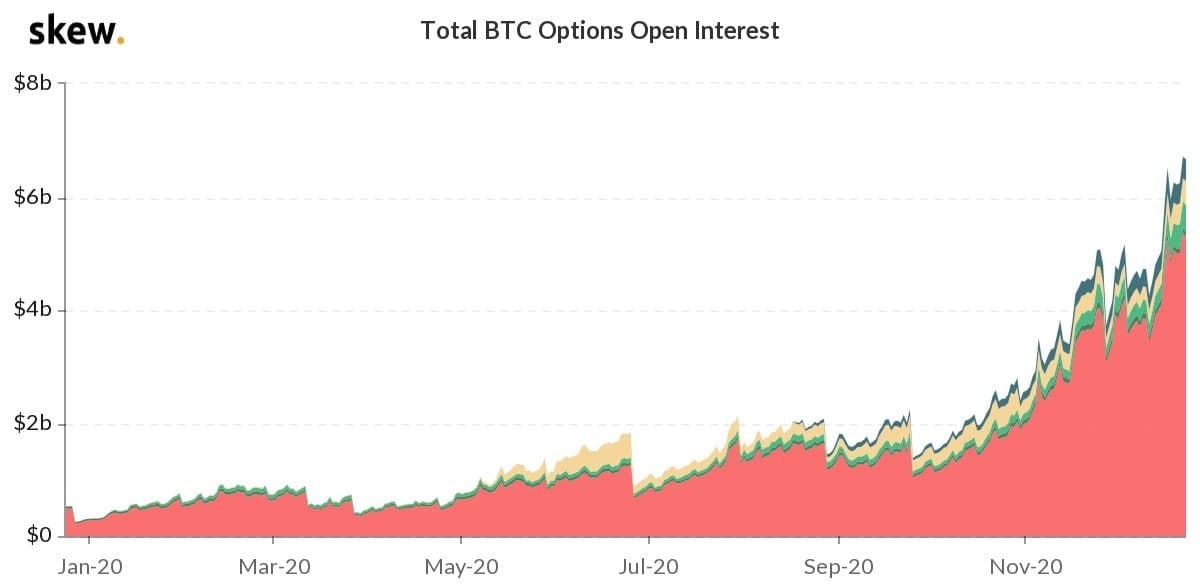
Data: skew (as of 29.12.2020).
- Open interest in Bitcoin futures after several corrections reached a record $10 billion by year-end. This signals strong demand for derivatives based on the first cryptocurrency.
- Rising share of the regulated Chicago Mercantile Exchange (CME) in futures open interest points to stronger demand for derivatives among institutions and other large players; in under a year the platform overtook BitMEX, Binance and OKEx.
- In 2020, aggregate open interest in Bitcoin options grew to $7 billion. Deribit remained the largest player in this segment.
DeFi


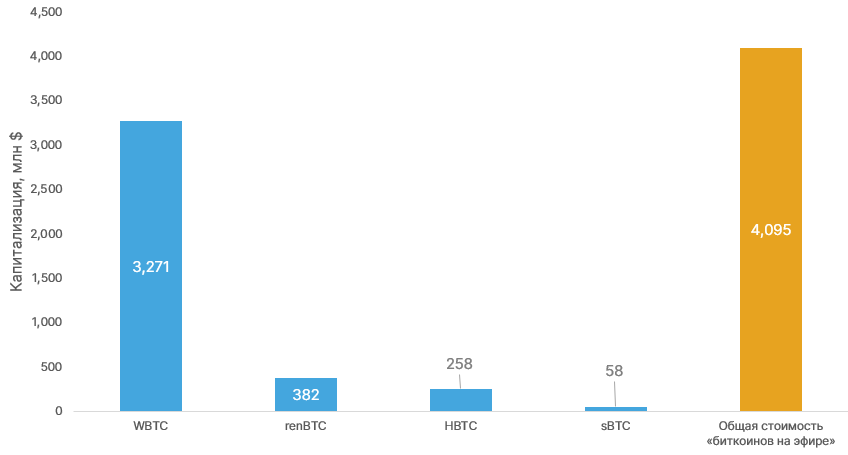
Market capitalization of BTCs tokenized on Ethereum. Data: DeFi Pulse (as of 1.01.2020).


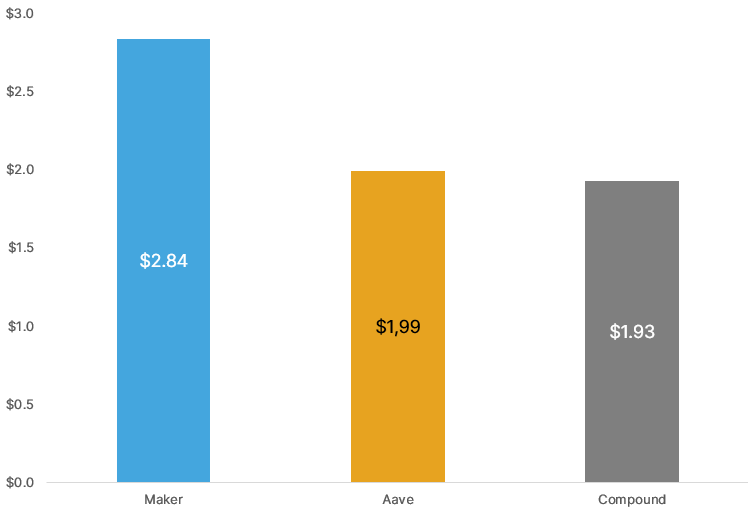
Top-3 DeFi projects by blocked value, $bln. Data: DeFi Pulse (as of 1.01.2020).
- In 2020 the DeFi sector experienced a genuine boom. On 1 January, total value locked (TVL) on smart contracts stood around $600 million, and by year-end it surpassed $15 billion, according to DeBank data. The figure rose twentyfold in less than a year.
- The so-called “Bitcoin on Ethereum” tokens surged in popularity. Protocols like WBTC, renBTC and HBTC provide Holders of digital gold access to a thriving DeFi ecosystem. Demand for Bitcoin-backed Ether tokens constrained the supply of the first cryptocurrency and supported its rise.
- The total value of tokenized Bitcoin topped $4 billion by year-end. WBTCs share in its segment stood at over 80%.
- As of 1.01.2020, the DeFi Pulse top-3 by TVL were Maker, Aave and Compound, with TVLs of $2.84B, $1.99B and $1.93B respectively.
Key milestones for DeFi in 2020
1 January 1 TVL around $600 million; early February it topped $1 billion. The most popular DeFi project is MakerDAO.
2 May 13 MakerDAO stopped supporting the single-collateral SAI stablecoin, accelerating the transition to the multi-collateral DAI.
3 May 18 Decentralized exchange Uniswap launched its second version of the protocol.
4 June 16 the lending project Compound issued the COMP governance token. The project attracted a flood of funds and briefly topped the DeFi Pulse ranking. The event marked the start of the “yield farming” craze and a race for high yields on vaulted assets.
5 July 2 USDC stablecoin market capitalization exceeded $1 billion.
6 August 30 Uniswap daily trading volume first exceeded Coinbases.
7 August 26 the veiled SushiSwap “vampire” launch propelled Uniswap to the top among DeFi projects for a while, but it later lost about 70% of its liquidity.
8 September 17 Uniswap issued the UNI governance token. In the most substantial DeFi airdrop in history, 113 million UNI were distributed among 184,000 users of the DEX, including liquidity providers and holders of SOCKS tokens.
9 November 29 total DeFi users surpassed 1 million.
10 December 25 leading DEX aggregator 1inch released the native token, distributing a portion of the coins to users.
DEX


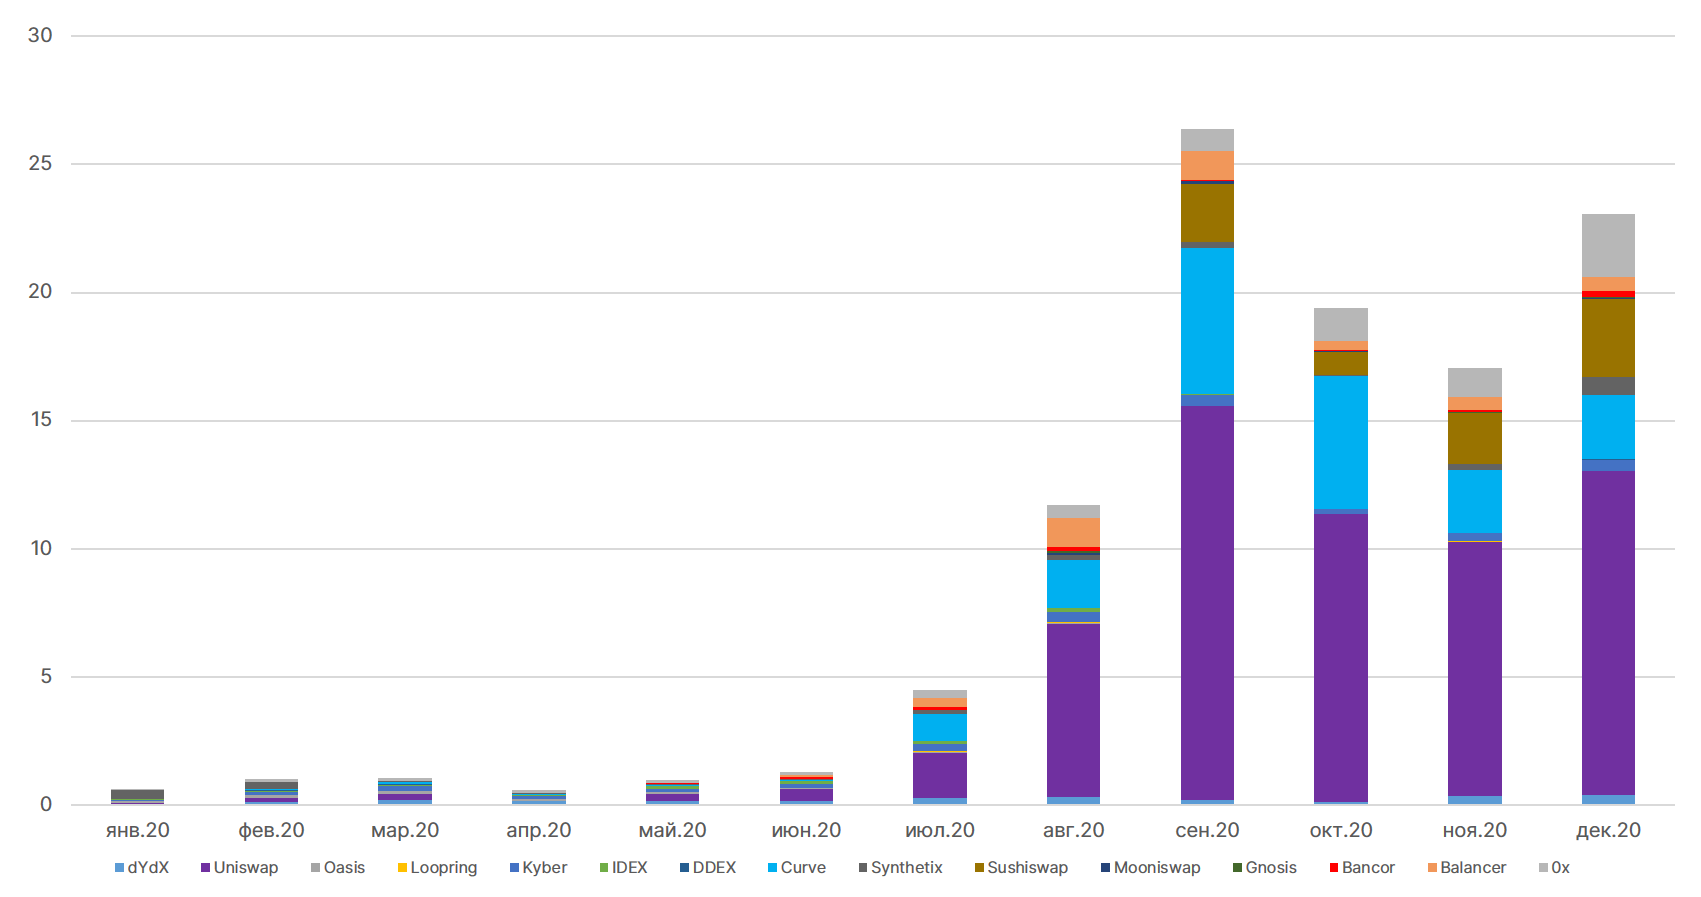
Trading volumes on decentralized exchanges, $bln. Data: Dune Analytics.


Market share of the largest DEXs. Data: DeBank (as of 1.01.2021).
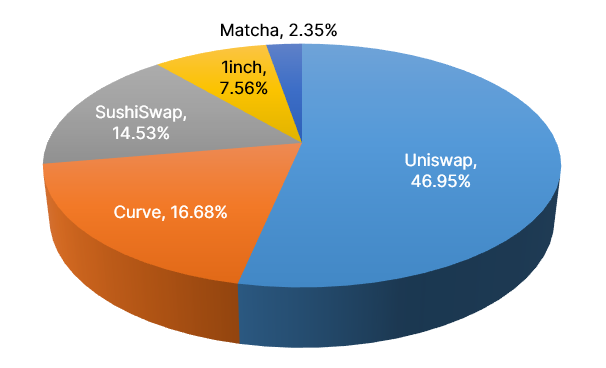
The year also saw rapid growth in the decentralized exchanges (DEX), a key component of the DeFi ecosystem. According to Dune Analytics, DEX turnover in 2020 exceeded $120 billion, and more than a million distinct users participated in non-custodial trading.
Uniswap led the segment, though its share gradually declined. Curve and the so-called “vampire” SushiSwap are also popular. Among liquidity-aggregators, 1inch leads, with Matcha by the 0x team gaining pace.
Stablecoins


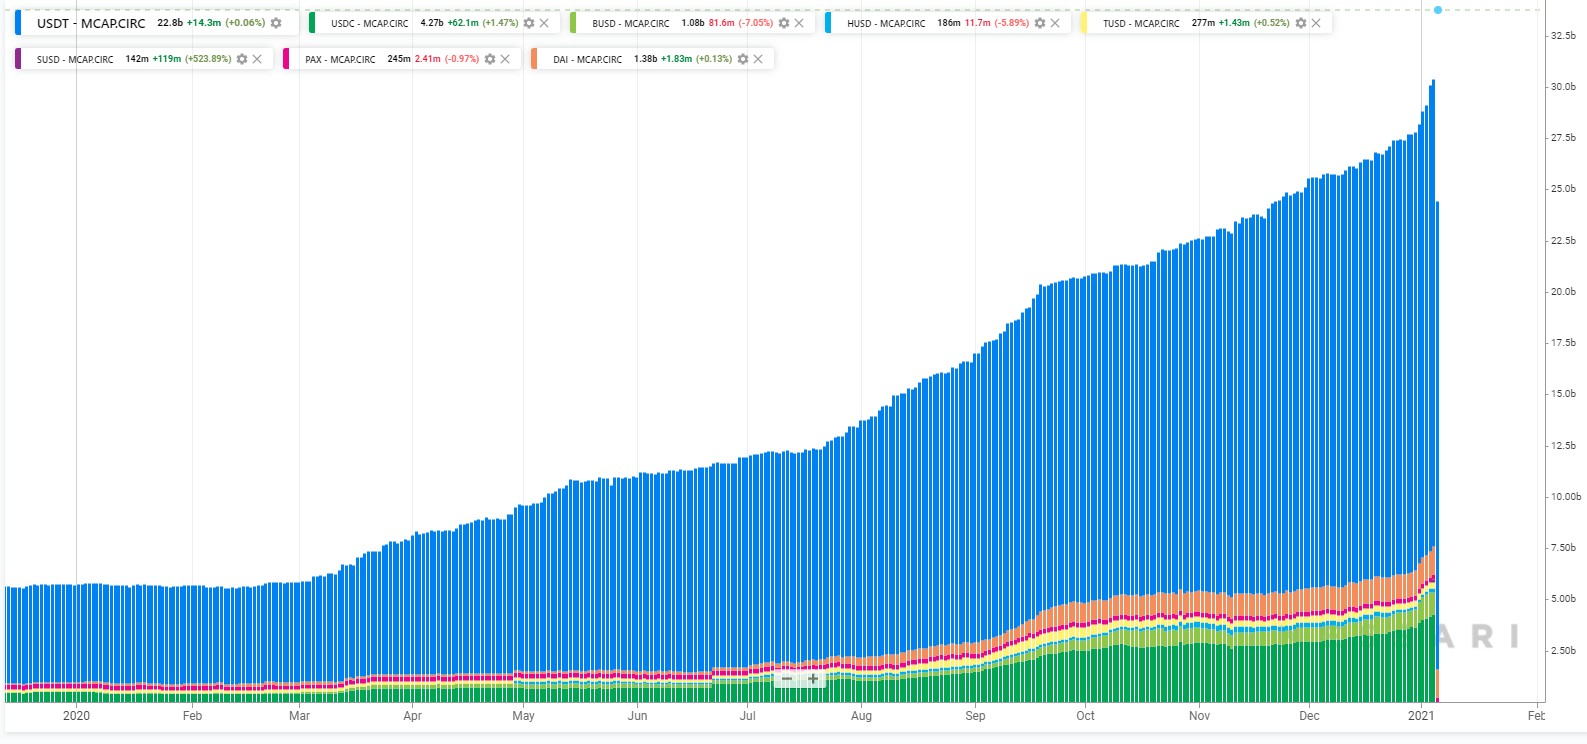
Dynamics of the total stablecoin market cap in 2020. Data: Messari.


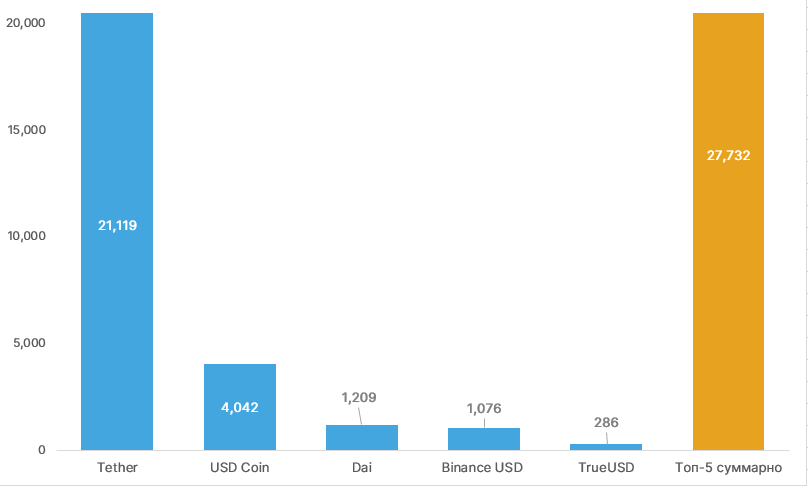
Top-5 leading stablecoins by market cap. Data: Messari (as of 1.01.2020).
Over 2020 the total market cap of stablecoins rose more than fivefold—from around $5 billion at the start of January to nearly $30 billion by year end. Tether (USDT) accounted for about 75% of the segment with a market cap of $21.1 billion (as of 1.01.2020). USD Coin (USDC) and the algorithmic stablecoin DAI gained traction. DAIs market cap grew more than twentyfold in 2020, reaching $1.2 billion.
P2P trading


LocalBitcoins p2p trading volumes in 2020, $mln. Data: coin.dance.


Paxful and LocalBitcoins p2p trading volumes, $mln. Data: coin.dance.
- From the start of 2020, LocalBitcoins and Paxful p2p platforms saw trading volumes surge, peaking mid-year as Bitcoin approached the key $10,000 level.
- Despite the subsequent rally in Bitcoin, LocalBitcoins volumes stagnated, and Paxful volumes declined by about 20% on average by year-end.
Mining, hash rate, fees


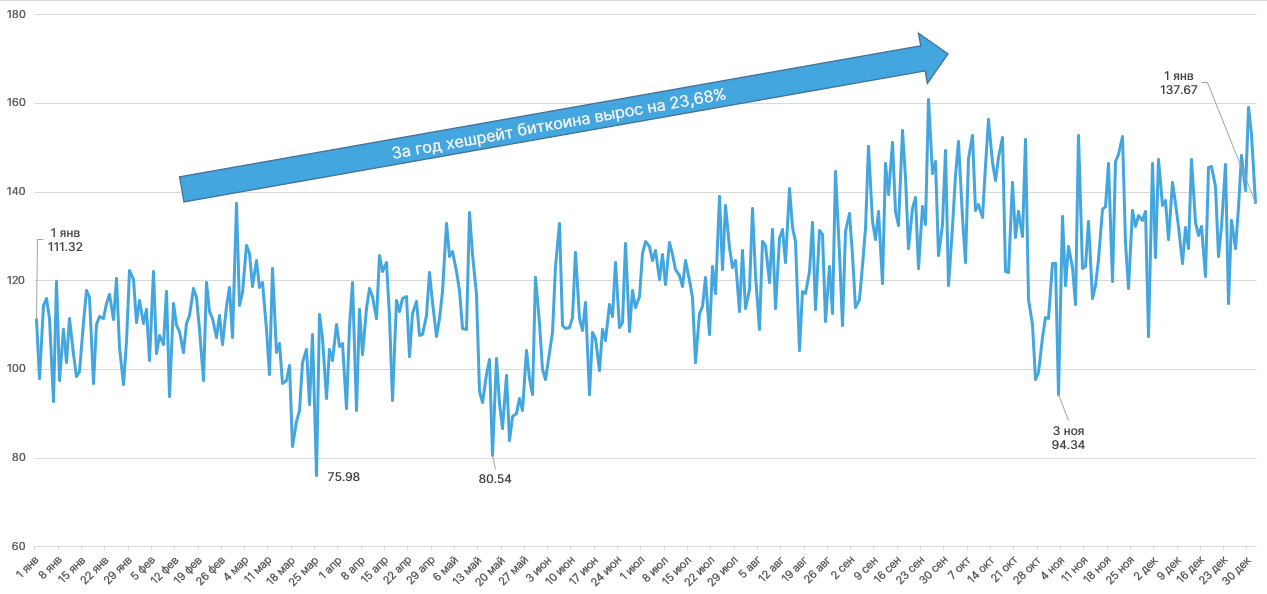
Bitcoin hash rate dynamics in 2020. Data: blockchain.com.


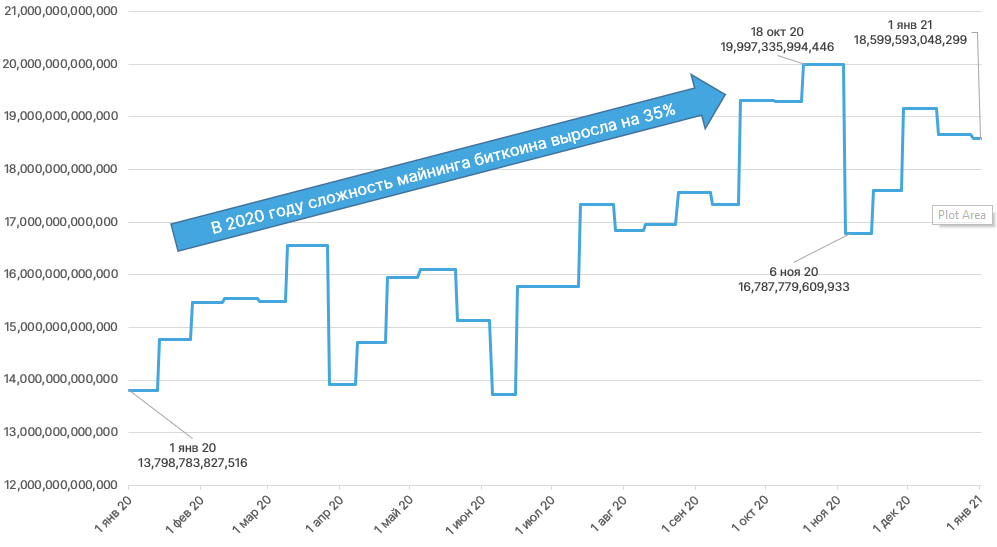
Mining difficulty chart. Data: blockchain.com.
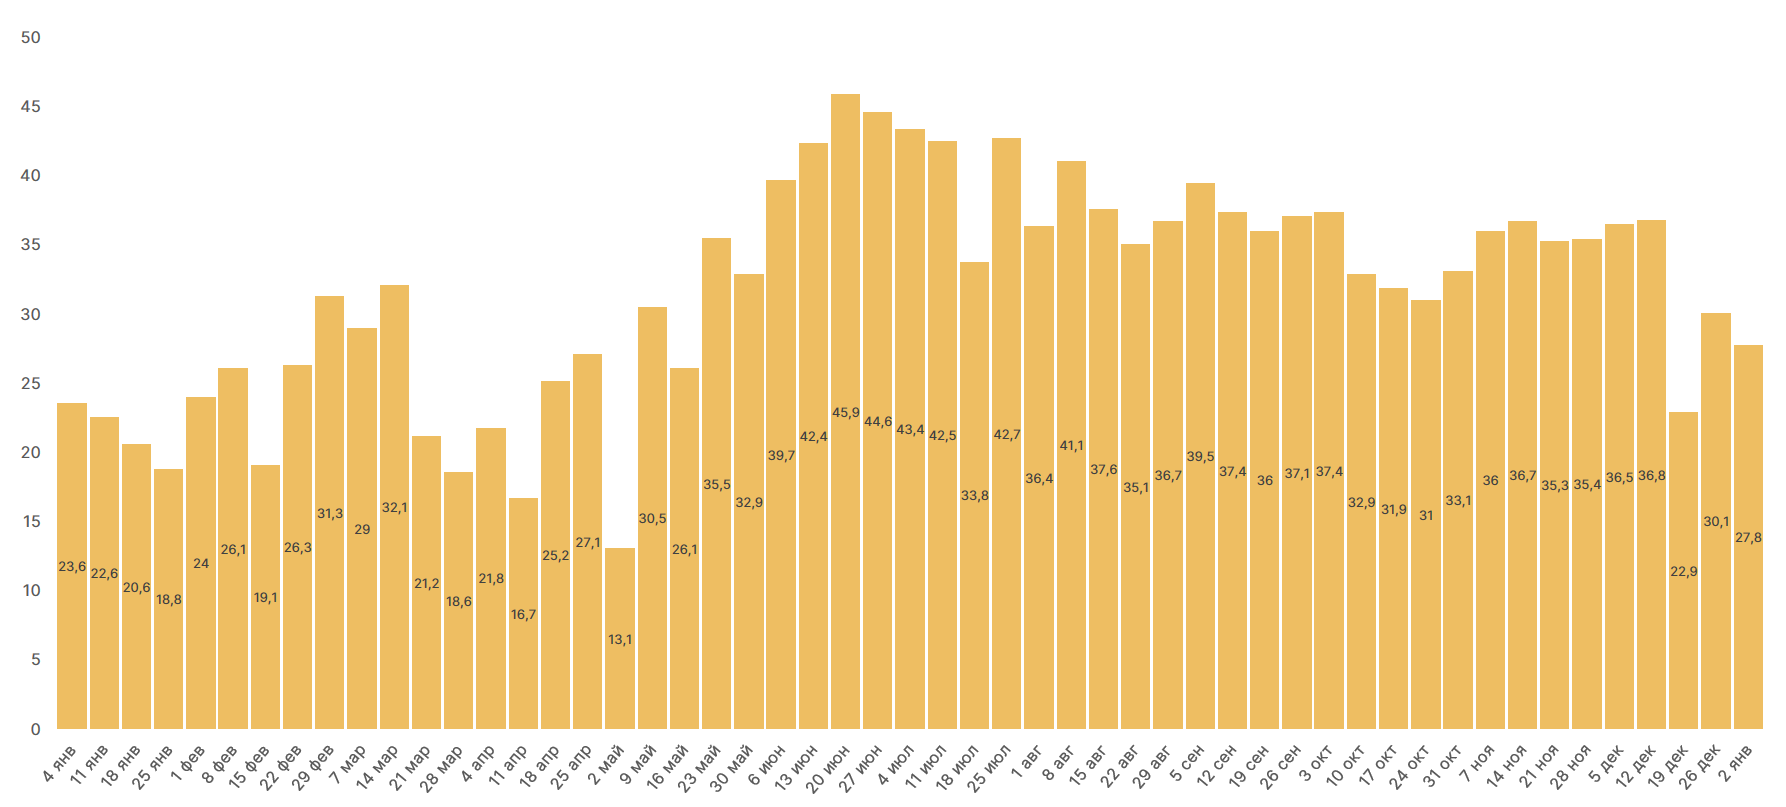
- Hash rate of Bitcoin rose by about a quarter over the year, with mining difficulty up 35%. The May halving temporarily reduced miner incomes, yet the price surge later offset the losses from the slower emission. The strongest miners income growth occurred in November and December (+50% and +31% respectively).
- Another consequence of the halving was the increased share of transaction fees in miners revenue.


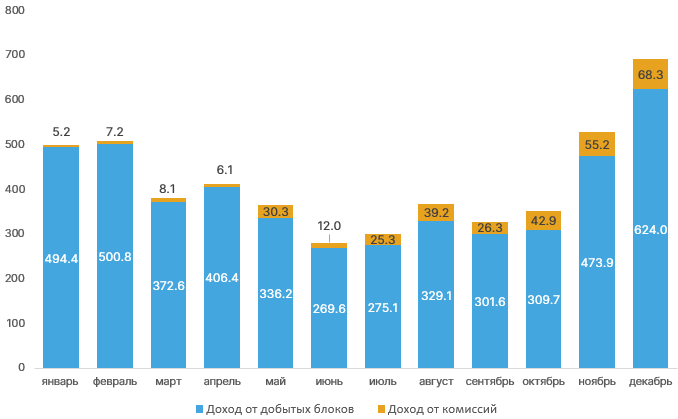
Bitcoin miner revenues by month, $mln. Data: Coin Metrics.


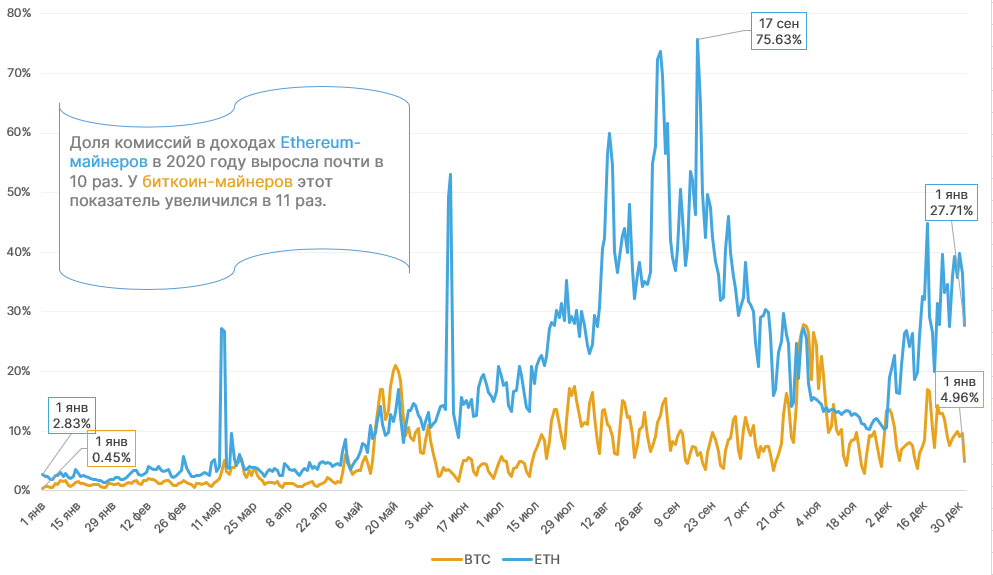
Share of mining fees in Bitcoin and Ethereum miner revenue. Data: Coin Metrics.
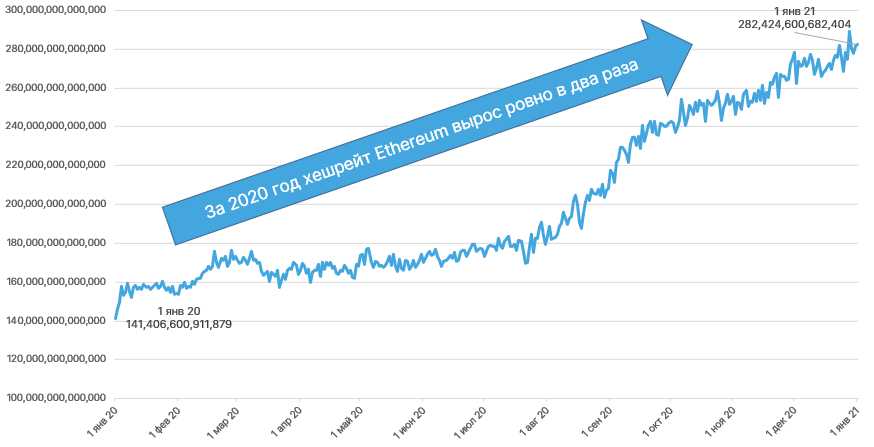
- Ethereum hash rate doubled in 2020, likely aided by rising Ether price and improved mining profitability, encouraging more mining capacity.
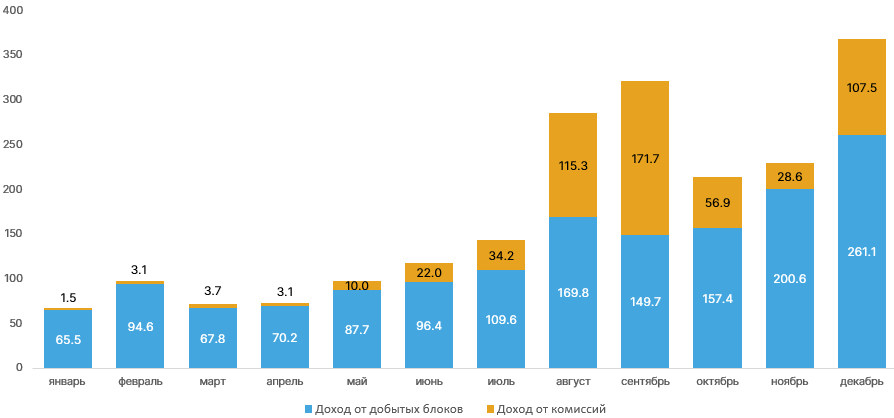
- The DeFi hype drove heavy network usage on Ethereum and a surge in gas prices. This led to higher miner revenues, with transaction fees forming a sizable portion of Ethereum miners income; in December, total Ethereum miner revenue reached $368 million, up 61% from November.


Ethereum hash rate dynamics in 2020. Data: Etherscan.


Ethereum miner revenues by month, $mln. Data: Coin Metrics.
Average Ethereum transaction fee rose from a few cents to several dollars, and in early September the metric reached $15. A similar trend, though not as pronounced, was seen for Bitcoin.


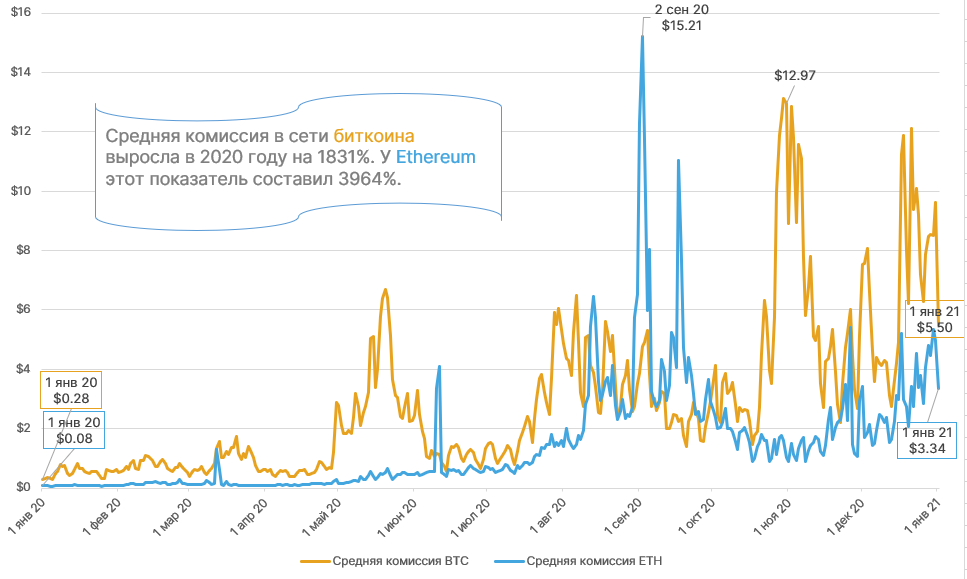
Average BTC- and ETH-transaction fees dynamics. Data: Blockchair.


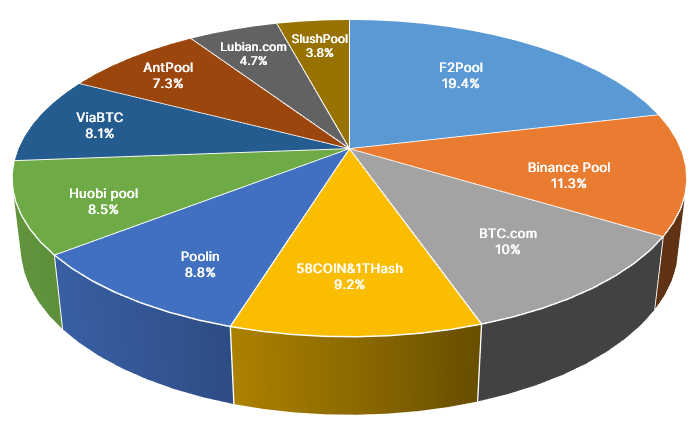
Largest mining pools by Bitcoin mining hashpower. Data: BTC.com (as of 01.01.2021).
In 2020 the mining landscape shifted significantly as Binance Pool rose to second place in Bitcoin hash rate share. The crown remained with F2Pool, controlling roughly a fifth of the hash rate.
On-chain data


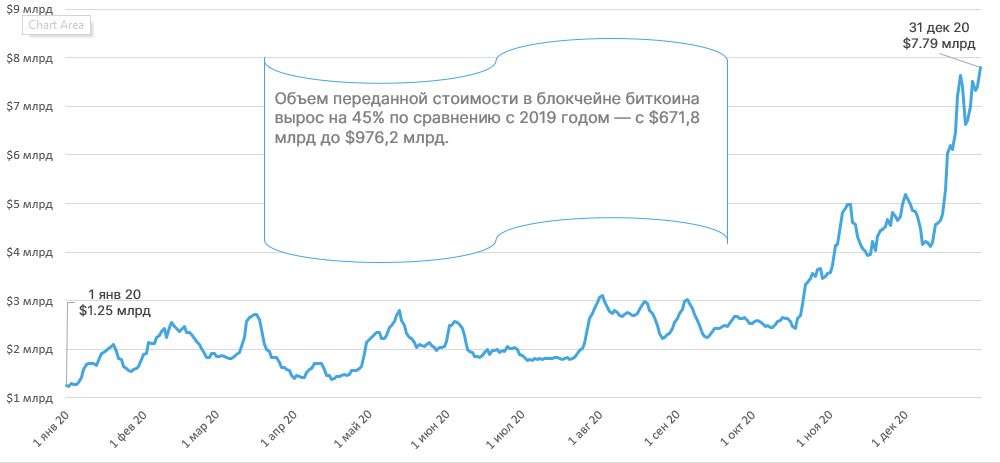
Dynamics of the value transferred on the Bitcoin blockchain. Data: Coin Metrics.


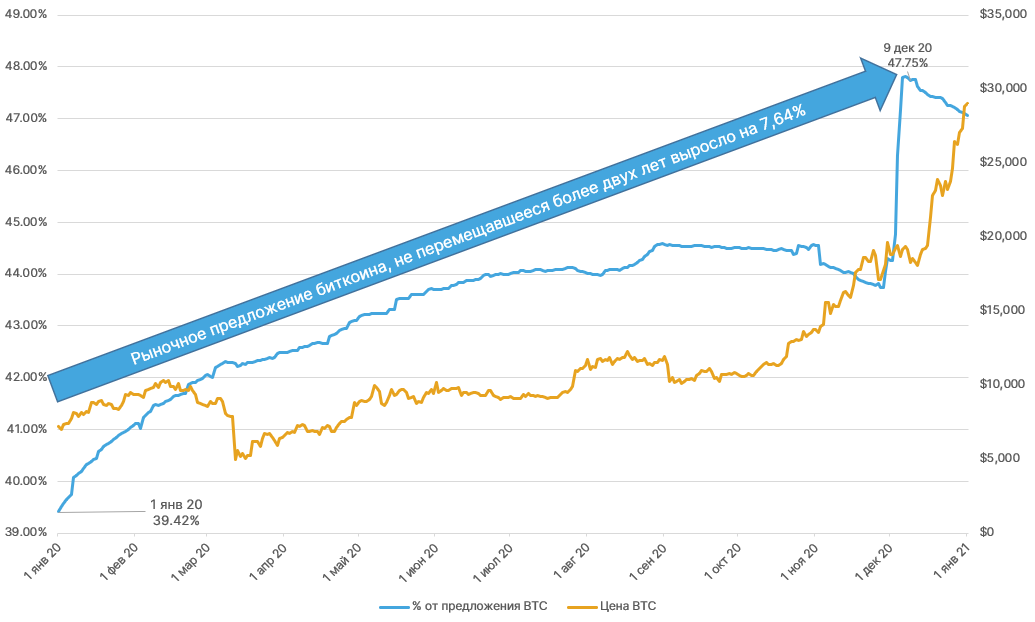
Share of Bitcoin available supply never moved for more than two years. Data: Glassnode, Yahoo Finance.
2020 was marked not only by rising crypto prices, but also by high on-chain activity. The value transmitted on the Bitcoin blockchain rose 45% year-on-year, from $671.8 billion to $976.2 billion. The share of Bitcoin that had not moved for over two years also increased, signalling a rise in longer-term holding relative to short-term consumption among market participants.


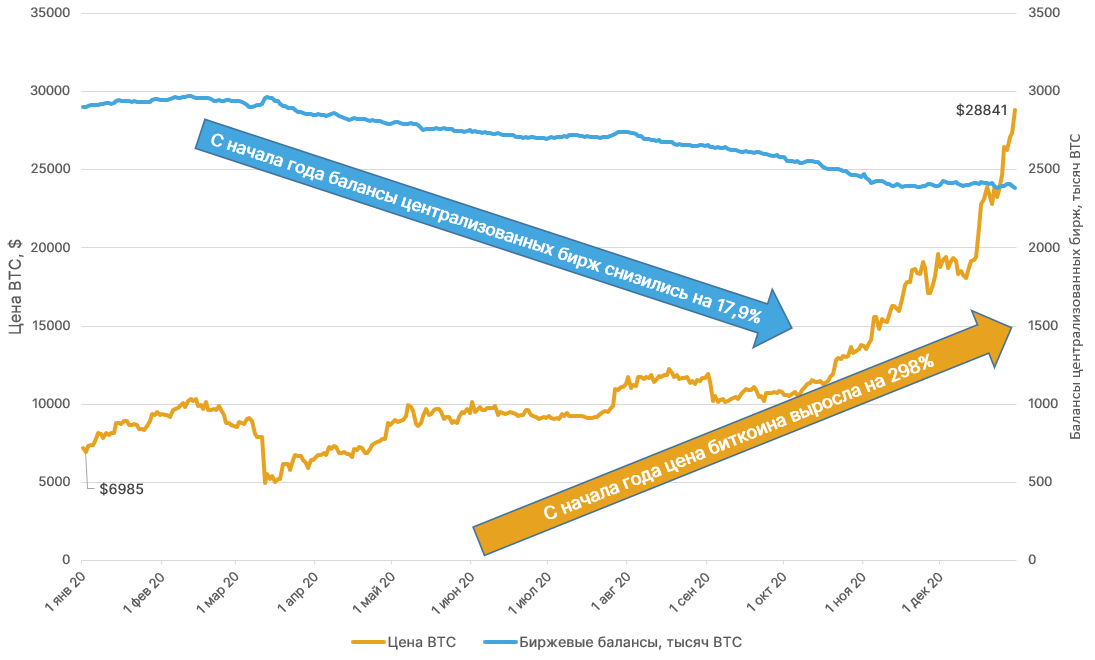
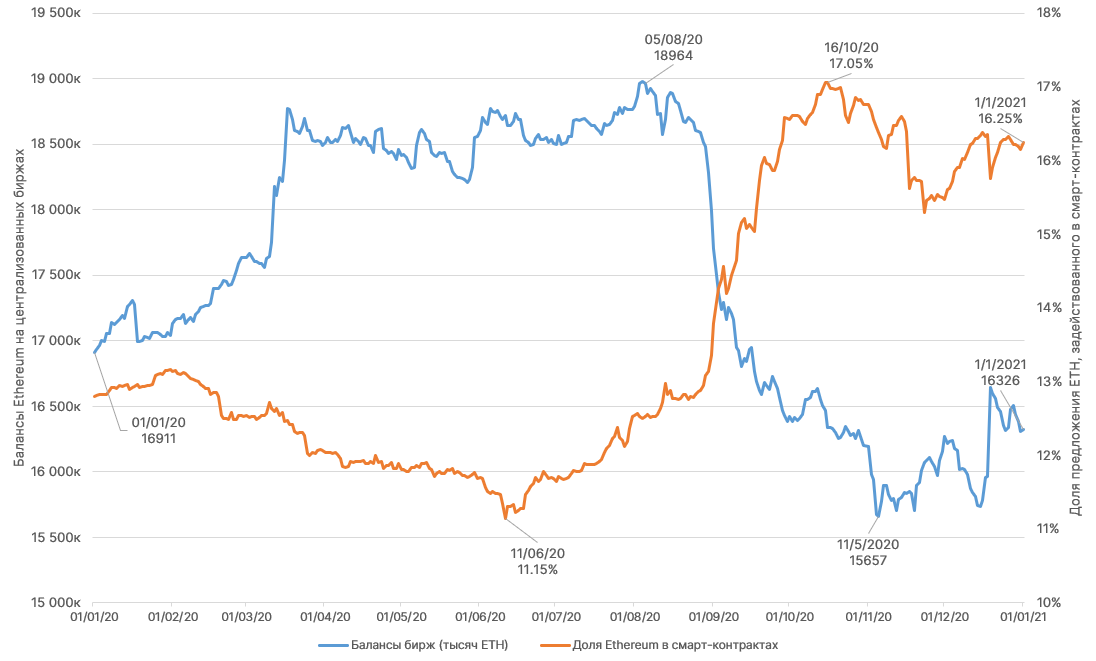
Bitcoin price and centralized exchange balances, thousand BTC. Data: Glassnode, Yahoo Finance.


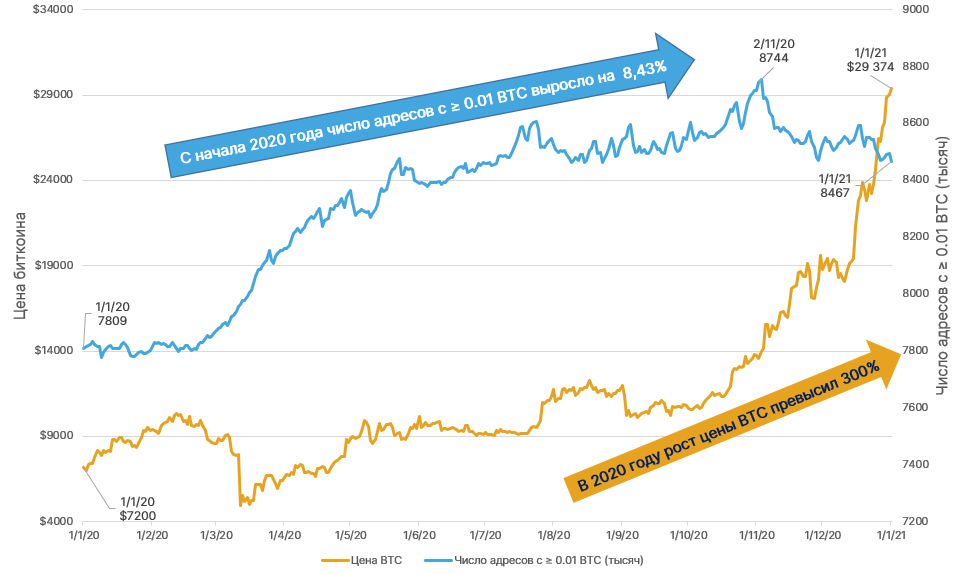
Bitcoin price and number of addresses with ≥ 1,000 BTC. Data: Glassnode, Yahoo Finance.
Against the rise in Bitcoin price, the balances on centralized exchanges gradually declined. This may reflect growing popularity of DeFi projects, including Wrapped Bitcoin, and investorsesire to hold funds themselves.
In 2020 the number of addresses across investor categories grew as well:
- with 0.01 BTC — +8.43%;
- 0.1 BTC and above — +10.67%;
- 1 BTC and above — +5.86%;
- 10 BTC and above — +0.53%;
- 100 BTC and above — -0.04%;
- 1,000 BTC and above — +7.37%;
- 10,000 BTC and above — -11%.


Dynamics of the number of Ethereum transactions. Data: Etherscan.


Market balances and ETH supply in DeFi active across smart contracts. Data: Glassnode.
- From the start of the year, transaction count on the Ethereum network doubled, surpassing January 2018 levels when ICO hype peaked.
- As with Bitcoin, Ethereum balances on centralized exchanges declined, while the share of Ether tokens deployed in smart contracts rose.


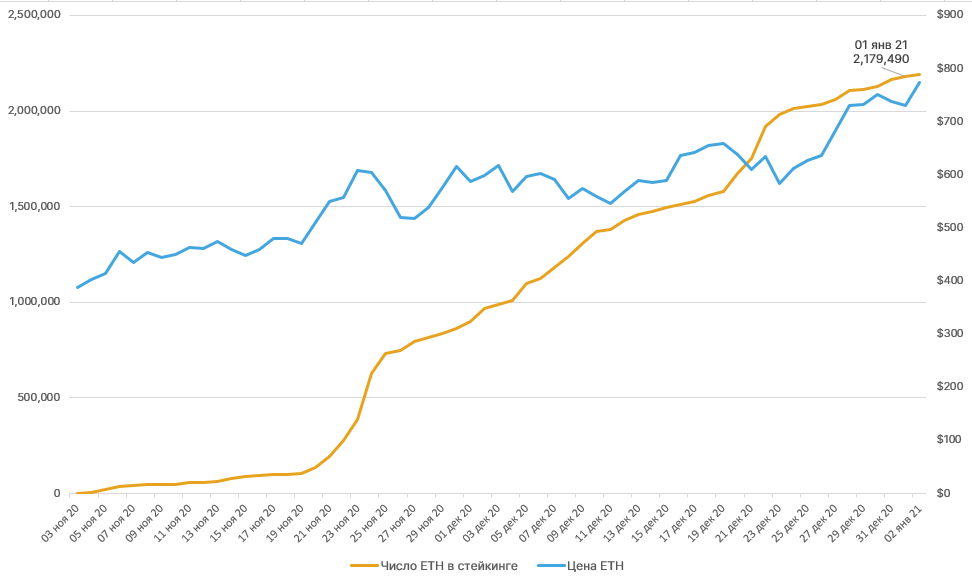
Dynamics of ETH staked in Ethereum 2.0. Data: Glassnode.
The launch of Ethereum 2.0 was a watershed event. By year-end more than 2 million ETH were staked on the deposit contract of the new system. The reduction in active supply by almost 2% could support longer-term upside for the second-largest cryptocurrency.
Institutional activity


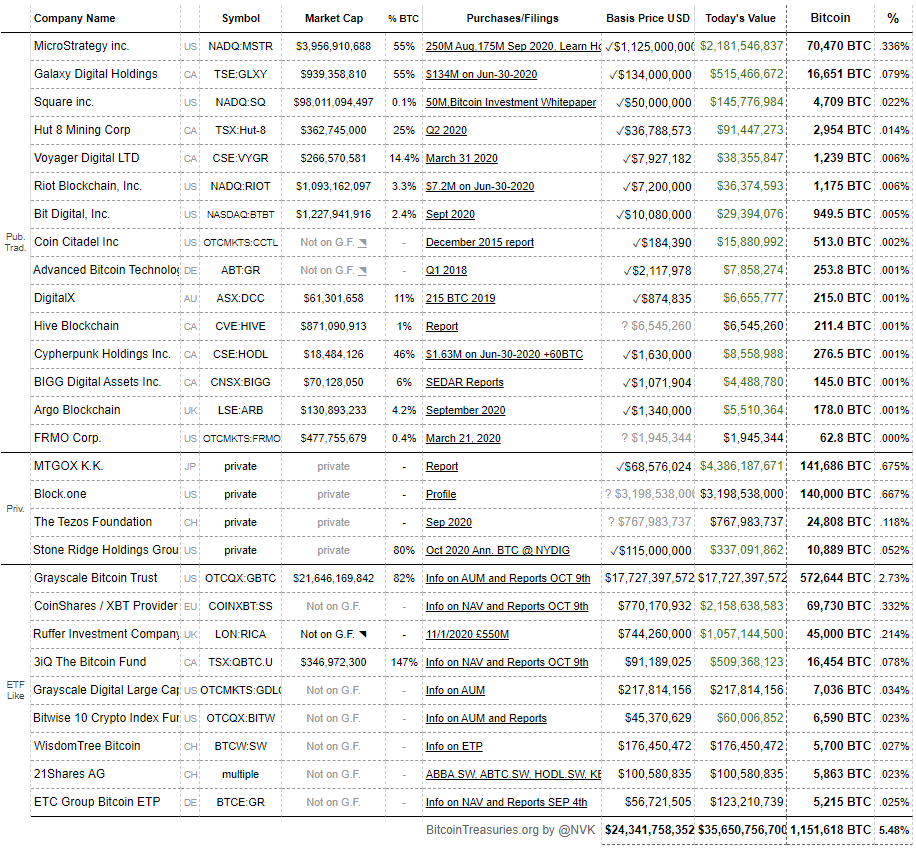
Volume of public-company Bitcoin investments as of Jan 4, 2021. Data: Bitcoin Treasuries.
According to Bitcoin Treasuries, public companies have acquired over 1 million BTC (about 5.5% of the current supply) worth over $35 billion.
- The shift to using Bitcoin as a hedge against fiat devaluation was pioneered by MicroStrategy, which in August acquired 21,454 BTC for more than $250 million. A month later the Nasdaq-listed company invested an additional $175 million, and in December another $650 million. In total, MicroStrategy had投入 into Bitcoin $1.12 billion, owning 70,470 BTC, valued at more than $2 billion at the time of writing.
- In October, Jack Dorseys Square announced it had acquired 4,709 BTC for $50 million.
- In mid-December, public company Ruffer Investments disclosed purchases of 45,000 BTC for $744 million.
- Towards the end of the year, SkyBridge Capital, led by Anthony Scaramucci, launched a Bitcoin-based fund with $310 million in assets.


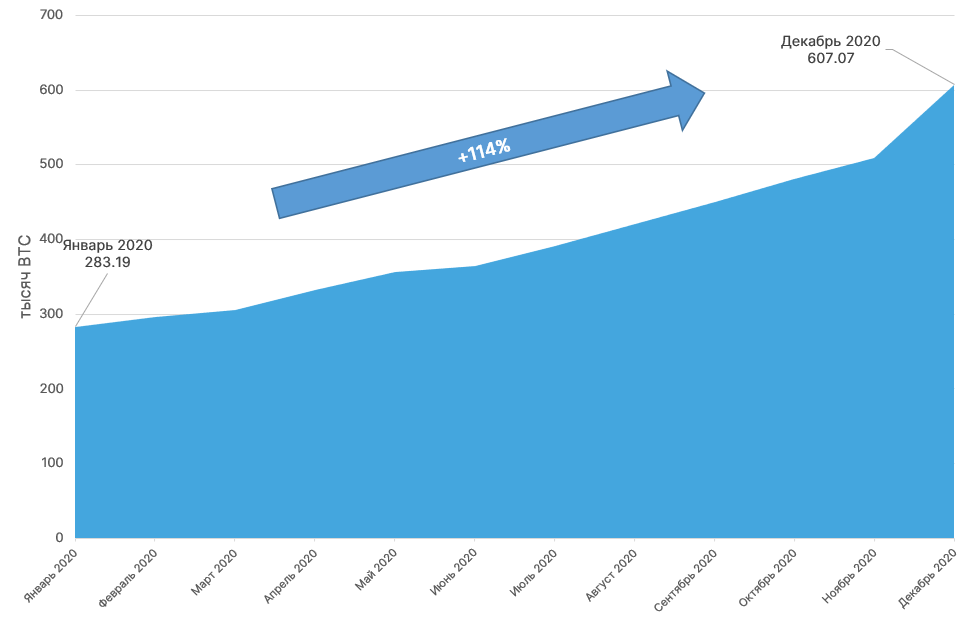
Grayscale Bitcoin Trust assets (thousand BTC). Data: grayscale.co.


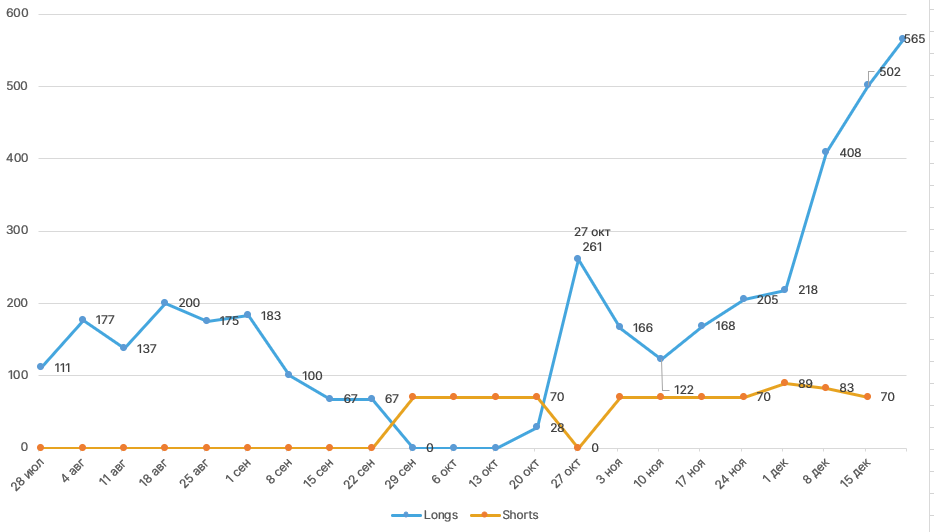
Dynamic of Commercial positions on CME. Data: CFTC.
- One of the most active institutional players was Grayscale Investments, which by early 2021 managed about 607,000 BTC with crypto assets under management valued at around $22.8 billion (as of 4.01.2021).
- The demand for Bitcoin from whales is also reflected in the CME Bitcoin futures positions for Commercials; the share of these participants in open interest has grown since October, with long positions predominating.
CBDC in 2020
2020 was marked by central-bank statements on CBDCs. The pandemic accelerated this process:
- The most attention focused on Chinas digital yuan, with pilot trials in Shenzhen, Suzhou and later Shanghai begun in 2020;
- The EU contemplated a digital euro; the European Central Bank signaled it could be launched and presented in 2021;
- Russia discussed a digital ruble; in October the Bank of Russia published a report on a digital ruble, though a final decision on its development had not been made.
- On October 20, 2020, the Bahamas launched the Sand Dollar, the worlds first CBDC issued by a government.
Regulation in 2020


Regulation in 2020
Top themes of 2020
In the night of Friday, 13 March, Bitcoin briefly tumbled to $3,800, losing more than 50% in a day. Ethereum fell below $100. A comparable depth of sell-off occurred in traditional markets.
On 11 May, block #630000 in the Bitcoin network marked the third halving in history. The block reward dropped from 12.5 BTC to 6.25 BTC. The next halving is expected in 2024, with the last one around 2140.
One of the year’s major events was the court case between the U.S. Securities and Exchange Commission and the Telegram Open Network by Pavel Durov.
On 1 October 2020 the U.S. CFTC filed a case against BitMEX and its founders. The exchange later faced more suits, and its CEO stepped down.
The SEC targeted Ripple, the company behind the XRP token, accusing it of selling unregistered securities to retail investors.
In October, PayPal announced a forthcoming integration allowing users to buy and sell Bitcoin, Bitcoin Cash, Ethereum and Litecoin in the U.S. This news buoyed Bitcoin and helped propel it toward new annual and all-time highs.
Quotes of the year