OneLiners
Sui Network Experiences Second Outage in Two Days
On May 29, the L1 blockchain Sui once again halted block production. At the time of writing, the pause has lasted approximately 1 hour and 30 minutes. The development team has reported that they are actively investigating the incident.Quantinuum Sets IPO Price Range, Valuation Up to $12.7 Billion
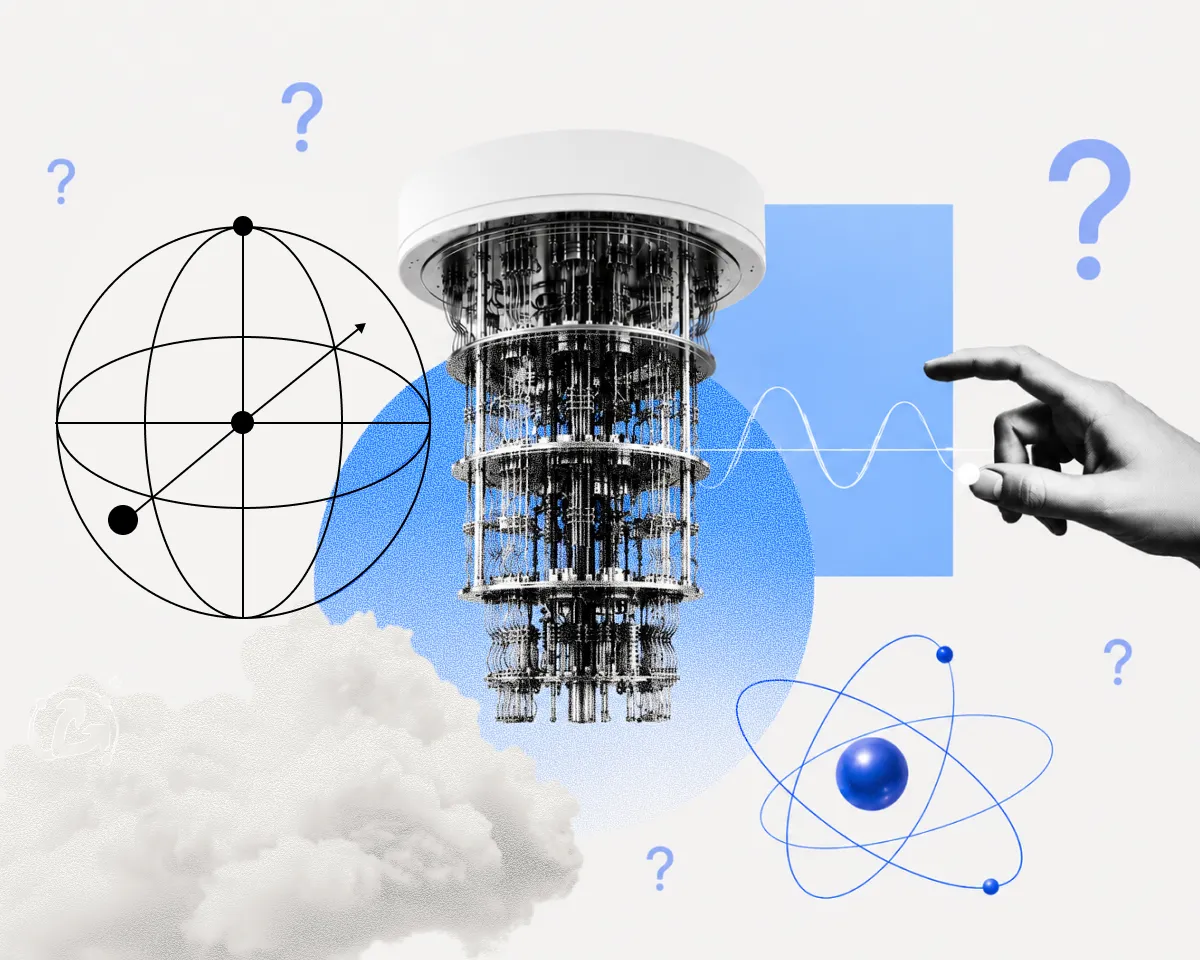
Quantinuum has updated its IPO filing, revealing a price range of $45–$50 per share. The company plans to list 21,052,632 Class A shares on Nasdaq. With these parameters, the post-IPO valuation is expected to be between $11.43 billion and $12.7 billion. Quantinuum enters the market as one of the largest players in quantum computing with a billion-dollar valuation.Anthropic Valuation Nears $1 Trillion
Startup Anthropic has raised $65 billion in a Series H round, reaching a post-investment valuation of $965 billion—compared to OpenAI's last disclosed figure of $852 billion. The company also reported that its annual revenue exceeded $47 billion. The funds will be used for AI safety research and expanding computational power for Claude models.Base Network Implements Major Azul Upgrade
Developers of the L2 solution Base have activated the Azul upgrade in the mainnet — the largest since its launch. It introduced a system of aggregated proofs, a new set of client programs focused on speed, and compatibility with the current Ethereum execution layer specifications.We use cookies to improve the quality of our service.
By using this website, you agree to the Privacy policy.