


Crypto price analysis: Bitcoin correction may continue
The leading RoboForex analyst Dmitry Gurkovsky explains the potential scenarios for Bitcoin’s price movement and for several popular altcoins.
The cryptocurrency market is continuing its correction. On Bitcoin’s chart there are already signs of a continuation of the decline, but until the $10,500 support is breached, talk of a sharp drop is premature.
Cryptocurrencies such as Litecoin are showing signals in favor of a rise. It is possible that the initial signal of Bitcoin’s correction will not materialize, and the market may try to resume the upward move.
Bitcoin
On the daily chart, Bitcoin prices continue to fall. The key support zones remain at $11,240 and $11,535. RSI readings have breached the support line, signaling potential for further price decline toward the $11,240 level. A break below it with prices staying under the lower boundary of the rising channel would trigger a drop to $8,830. The primary scenario is to consider a rebound from the lower boundary of the ascending channel and a continuation of the ascent.
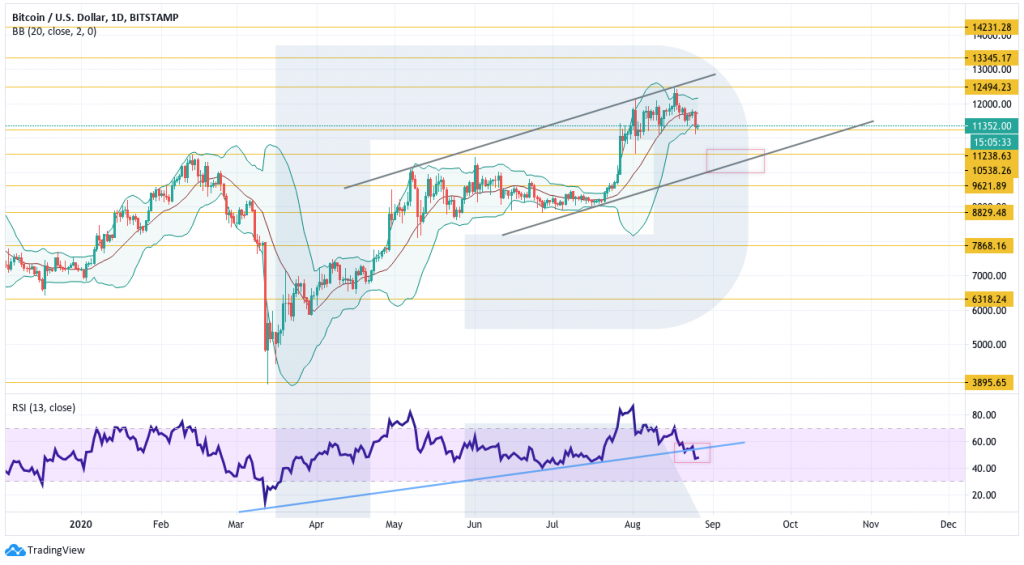
BTC/USD, daily chart from TradingView
On the 4-hour chart, the price breached the lower boundary of the rising channel. A breach of the support area with prices staying below $11,110 would signal further decline. Its targets within the measured width of the broken channel could be around $10,540 and lower. Growth to resume would be expected only after breaking above $11,970, after which the price should return inside the channel and clear the nearest major resistance.
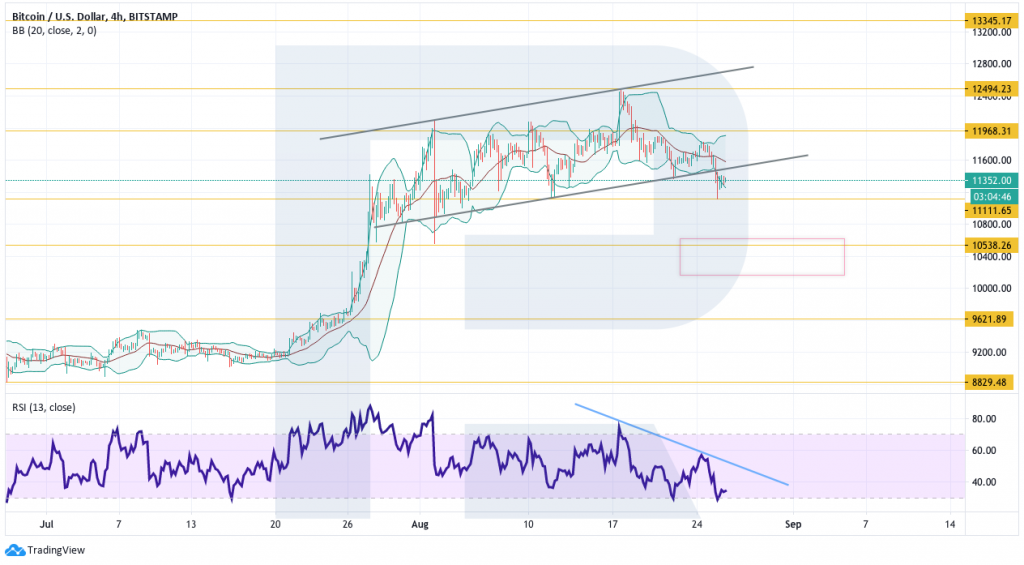
BTC/USD, 4-hour chart from TradingView
Ethereum
ETH/USD on the daily chart has not yet managed to rise above $450, but has not fallen below the support level either. They have merely tested the lower boundary of the Bollinger Bands, which confirms the buyers’ dominance in the market.
At the same time, RSI support line has breached. If in the near term the indicator values again hold above the support, one could speak of a continuation of the rise. So far no clear breakout. A strong signal for this scenario would be a rebound from the upper boundary of the ascending channel. If the support area is breached with price below $360, consider a drop to $295.
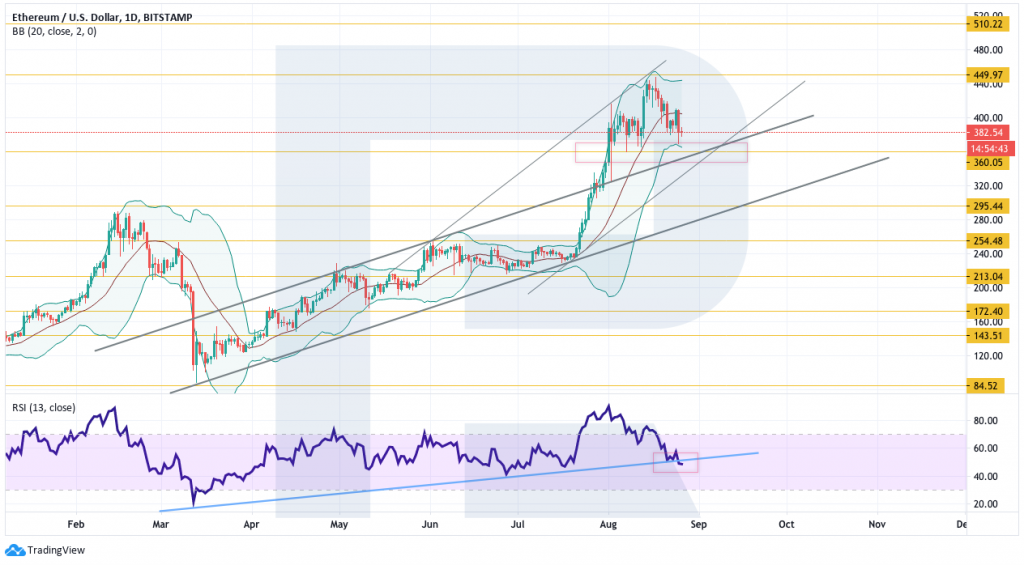
ETH/USD, daily chart from TradingView
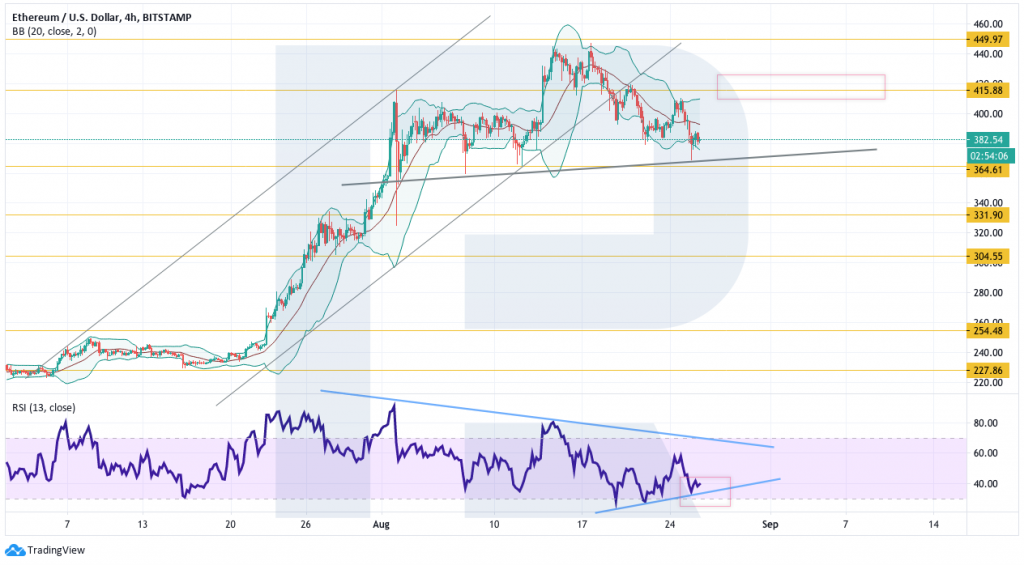
ETH/USD, 4-hour chart from TradingView
Litecoin
Litecoin quotes on the daily chart failed to hold above the upper boundary of the ascending channel, which would indicate a strong upward move. At the same time, RSI values test the support line, signaling a potential rebound toward $68.
On other crypto assets, a breakout of similar lines has already occurred, so buyers should hold above $60. A breakout of this region could see prices fall to the lower boundary of the ascending channel at $51.
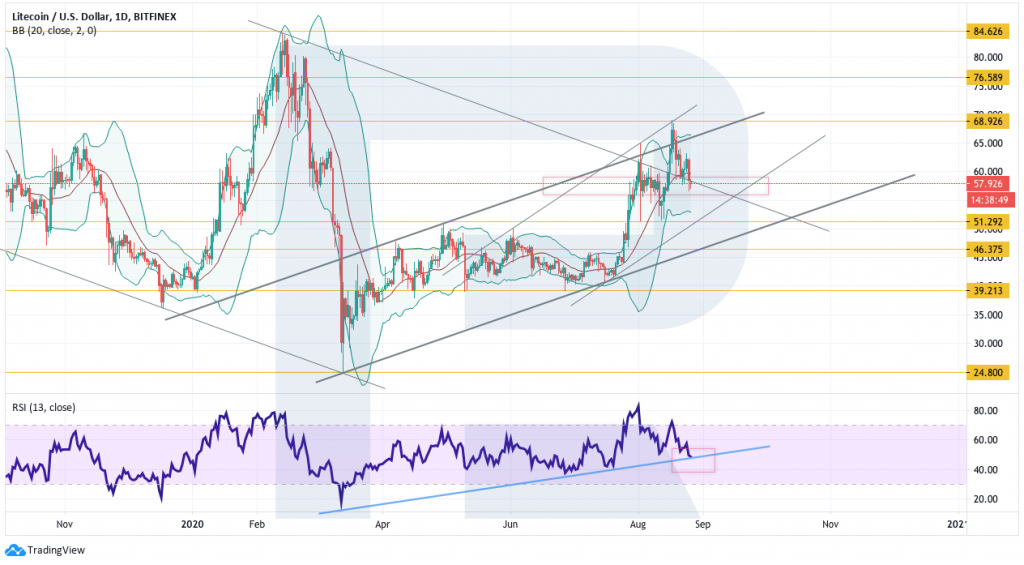
LTC/USD, daily chart from TradingView
On the 4-hour chart, prices moved to test the lower boundary of the ascending channel. There is potential for an upward rebound toward $64, a break of which would indicate a continued rise toward $68. A strong signal in favor of this scenario would be a rebound from the RSI trend line.
If the lower boundary of the channel is breached and price closes below $55, a further drop toward $51 should be considered, and with that level breached, toward $46.
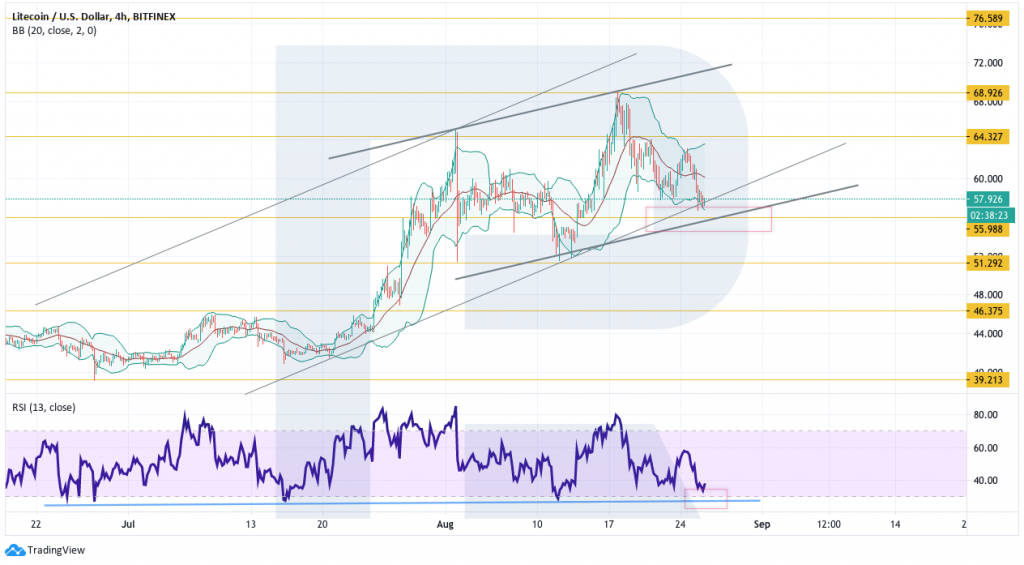
LTC/USD, 4-hour chart from TradingView
Bitcoin Cash
On the daily chart Bitcoin Cash continues to rebound from the upper boundary of the sideways range, and RSI values have nearly tested the support line. These factors may indicate potential for a price rebound upward and further upside. Confirmation would be a breakout of the resistance area with price above $340. The counter case would be a break below the lower boundary of the ascending channel with price below $255, in which case a move toward $140 could be considered.
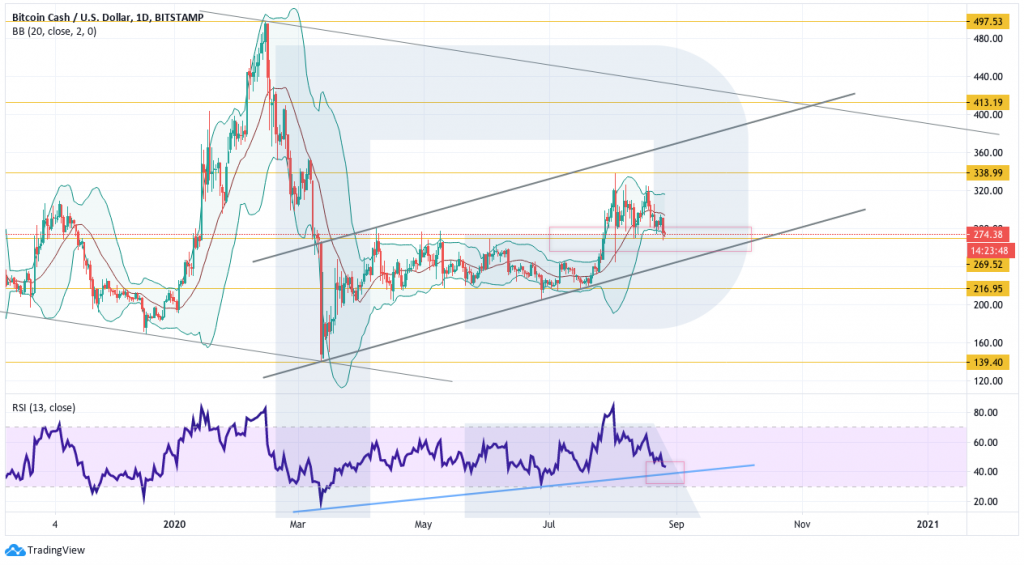
BCH/USD, daily chart from TradingView
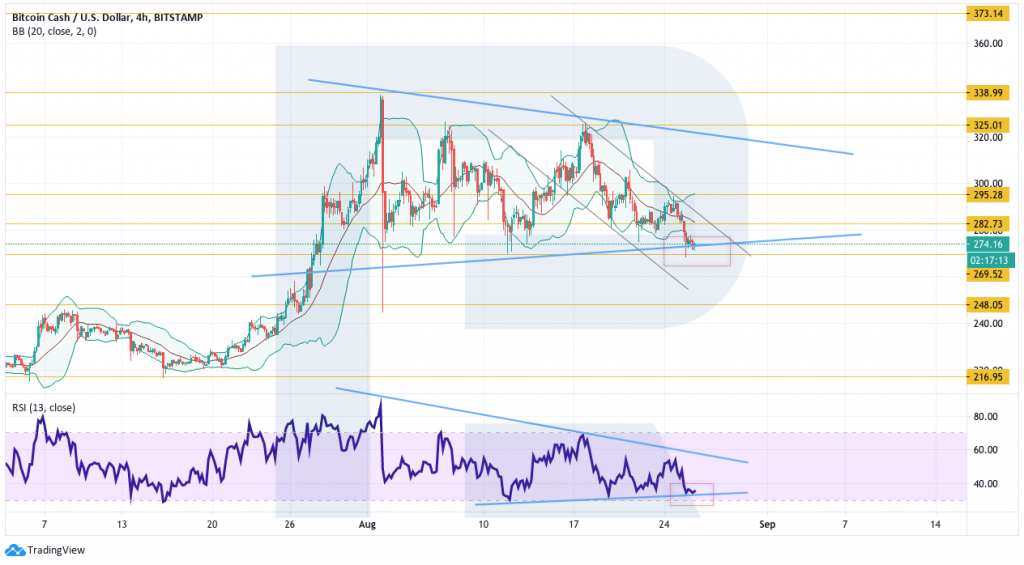
BCH/USD, 4-hour chart from TradingView
Subscribe to ForkLog news on Telegram: ForkLog Feed — full news feed, ForkLog — the most important news and polls.
Рассылки ForkLog: держите руку на пульсе биткоин-индустрии!