

Trader explains what is needed for Bitcoin to hit the $12,000 mark
A practicing trader and founder of the Crypto Mentors project, Crypto Mentors, Nikita Semov, explains the current market situation.
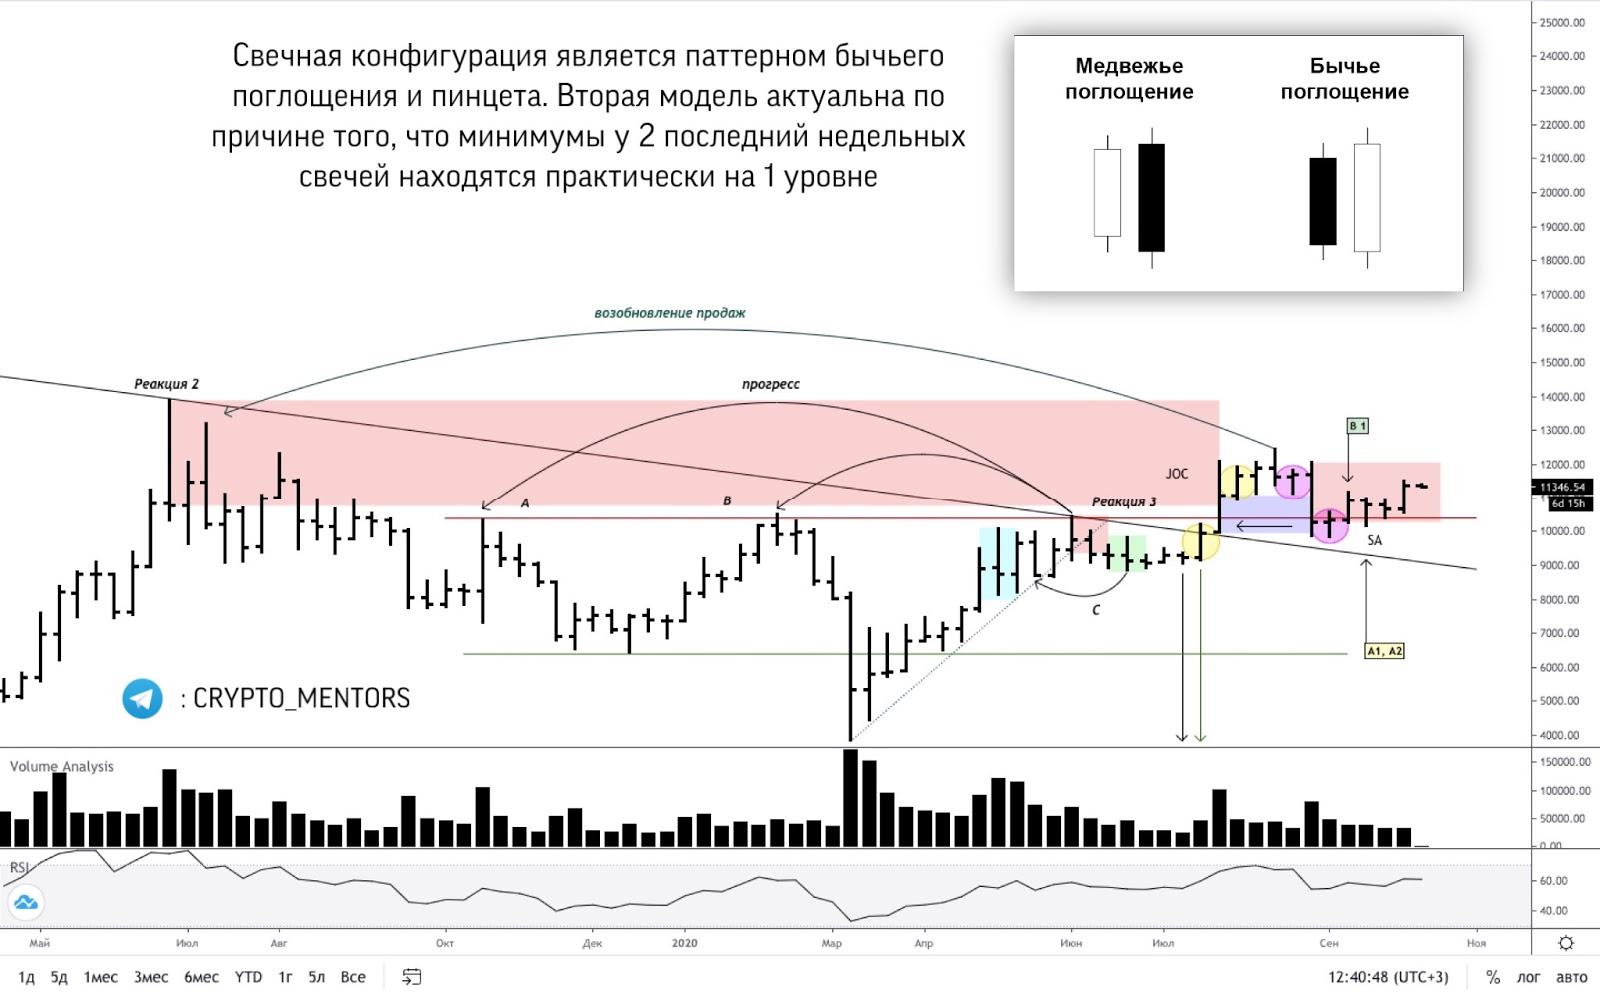
Bar-by-bar analysis
On the weekly bar, we have an ideal setup for a confident bullish effort. In addition to aligning with our price-movement expectations, the bar is notable for the bulls’ effort structure—a combination of spread and result.
According to the spread matrix, in the current wave it is large, but in combination with the previous wave it is medium. The sellers’ bias from the left side showed itself in bars A1, A2, demonstrating the absence of selling pressure. Now, with decreasing volume, the price manages to produce a result and progress from the creek level is better than in B1. I expect a bar higher.
According to the Japanese candlestick analysis, the pattern “Tweezer Bottom,” which can also be viewed as a bullish engulfing.
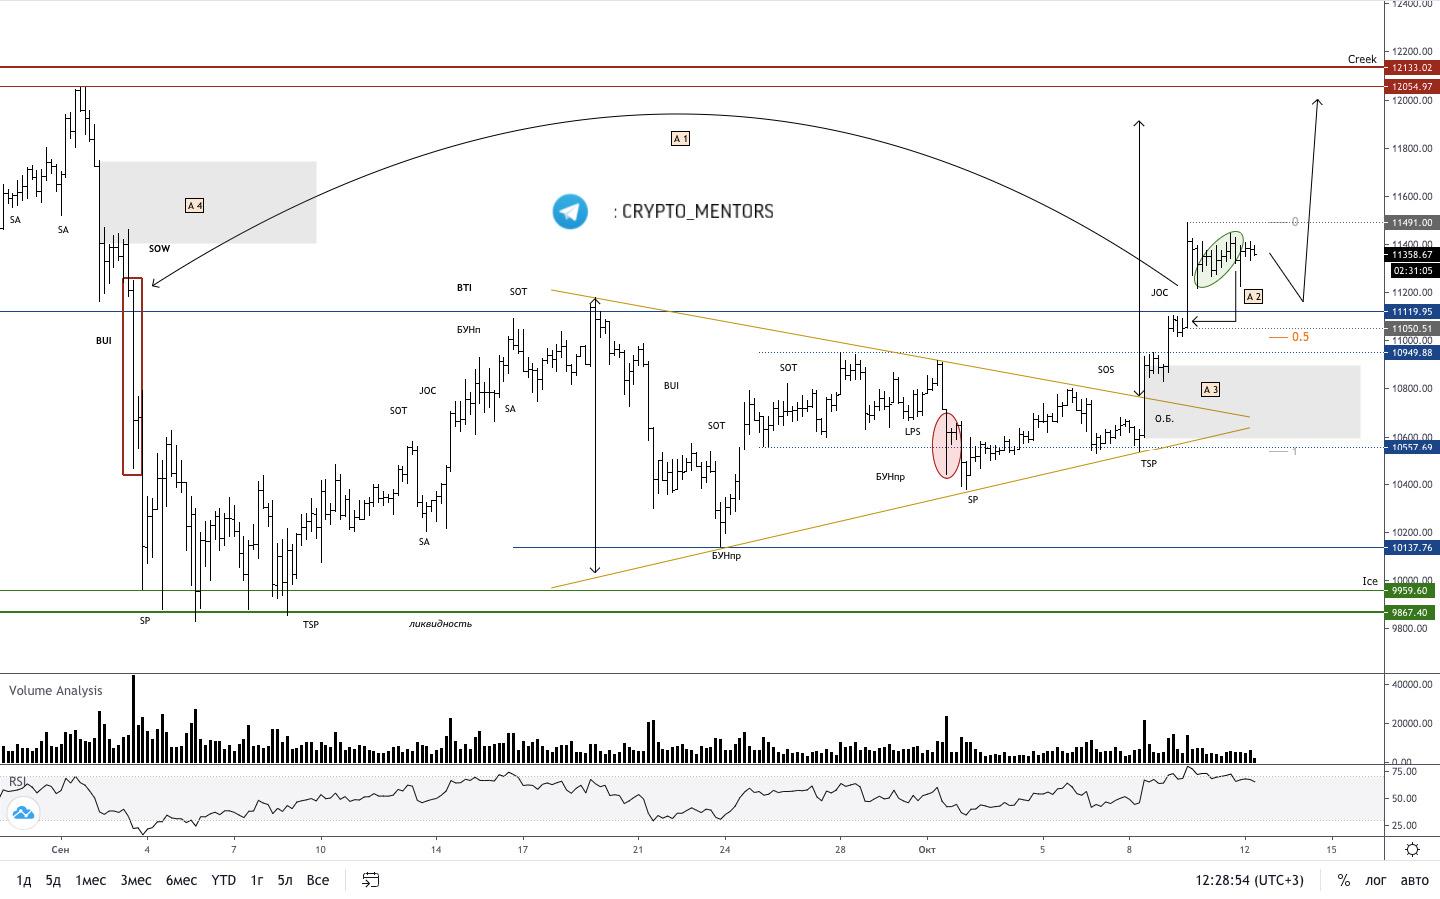
Weekly outlook
Our view remains quite bullish, as a significant horizontal resistance has been breached and buying is coming in at an aggressive pace. What signs indicate bullishness?
- A1 — a bar break with substantial volume, a complete absorption of selling, with a triangle breakout upward;
- A2 — local revival from the support-bar zone is very weak, hence there could be a retest of $11 200 before the move to $12 000 (the resumption of selling would start from A4 — the bear’s zone of heightened interest, most likely with a weak angle);
- A3 — the primary momentum driver (volume coming from below, from which the rally began).
Thus, for the coming week we expect a modest pullback before a push toward $12 000.
Analysis of horizontal volumes and deltas
The upward move continued, but now we approach important resistance levels. First, the upper boundary of the channel; second, the large volume cluster from the previous balance, which was unwound into selling.
The most interesting is the spike in anomalous volumes on which the price has stood. These volumes are not yet well-positioned. Such formations are largely reversal signals.
Moreover, we see a loss of buying initiative: the push is weakening, which is not good for continuation.
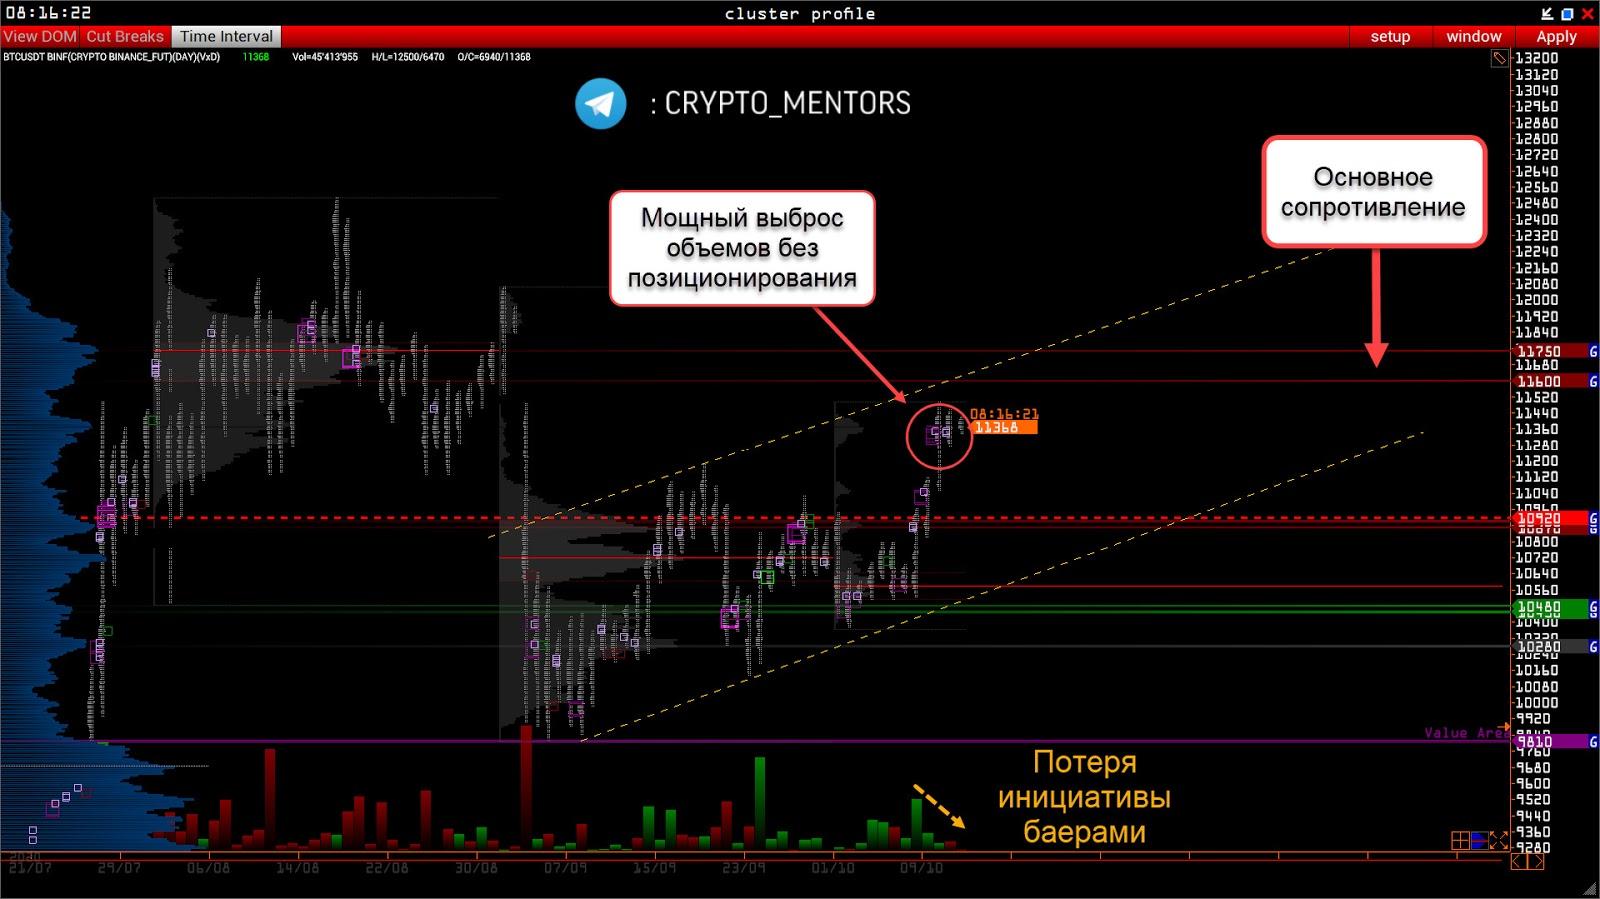
On higher timeframes we see a wedge-like tightening/accumulation. When using a custom profile, it indicates selling dominance across a broad range of price levels, which is also not favorable for the surge. However, one can say with near certainty that the breakout from this formation will be impulsive.
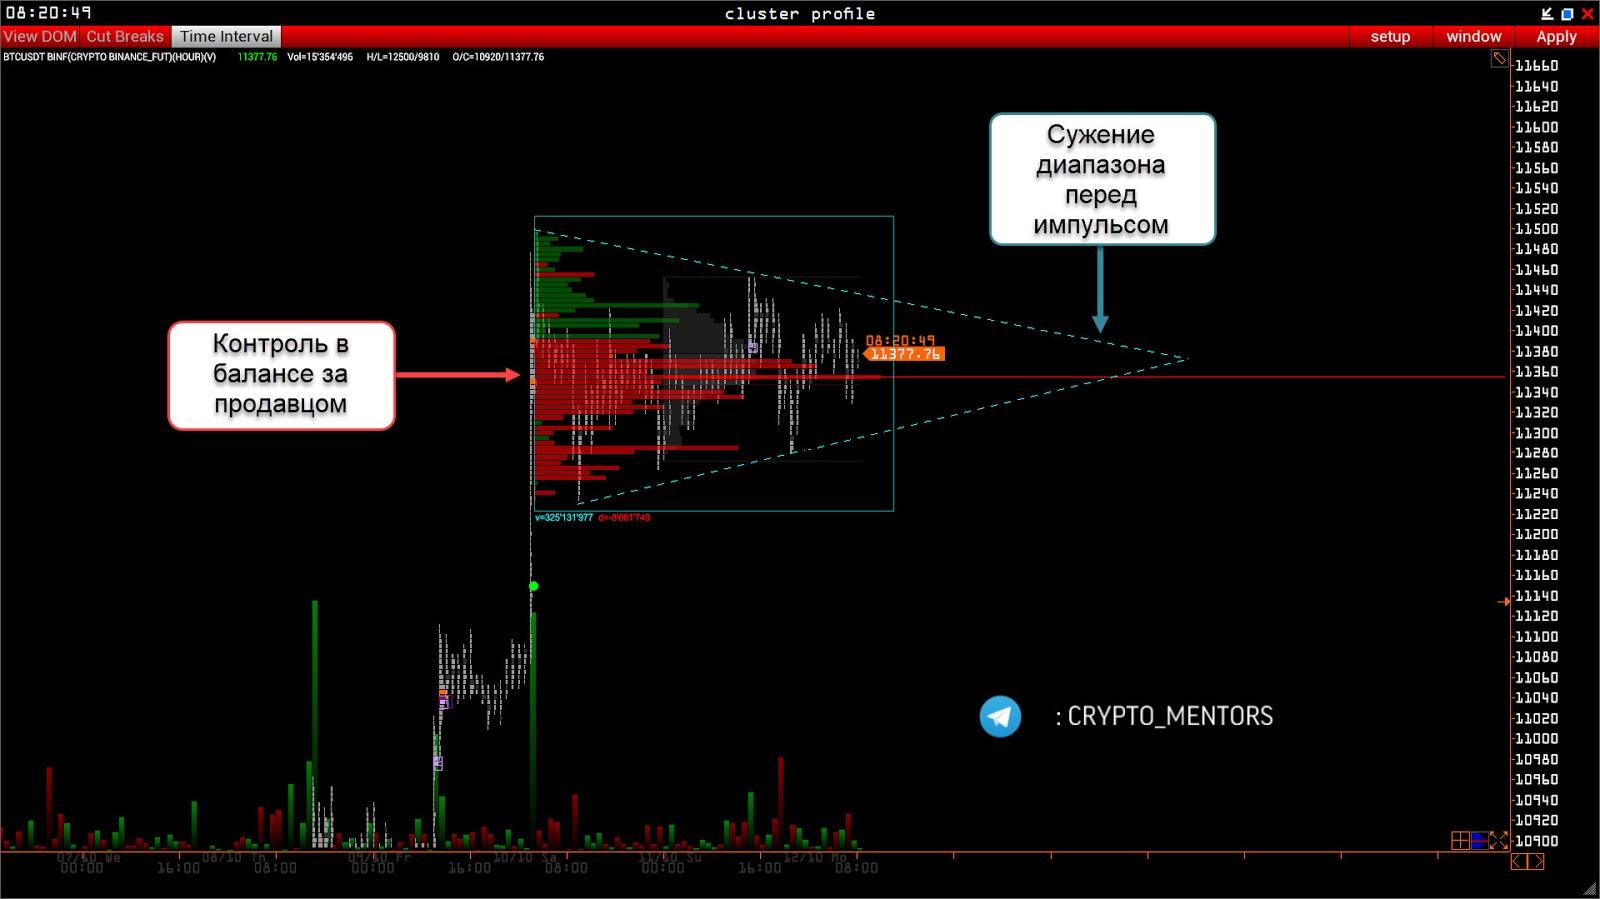
Hope for a revival in buying rests with the local situation.
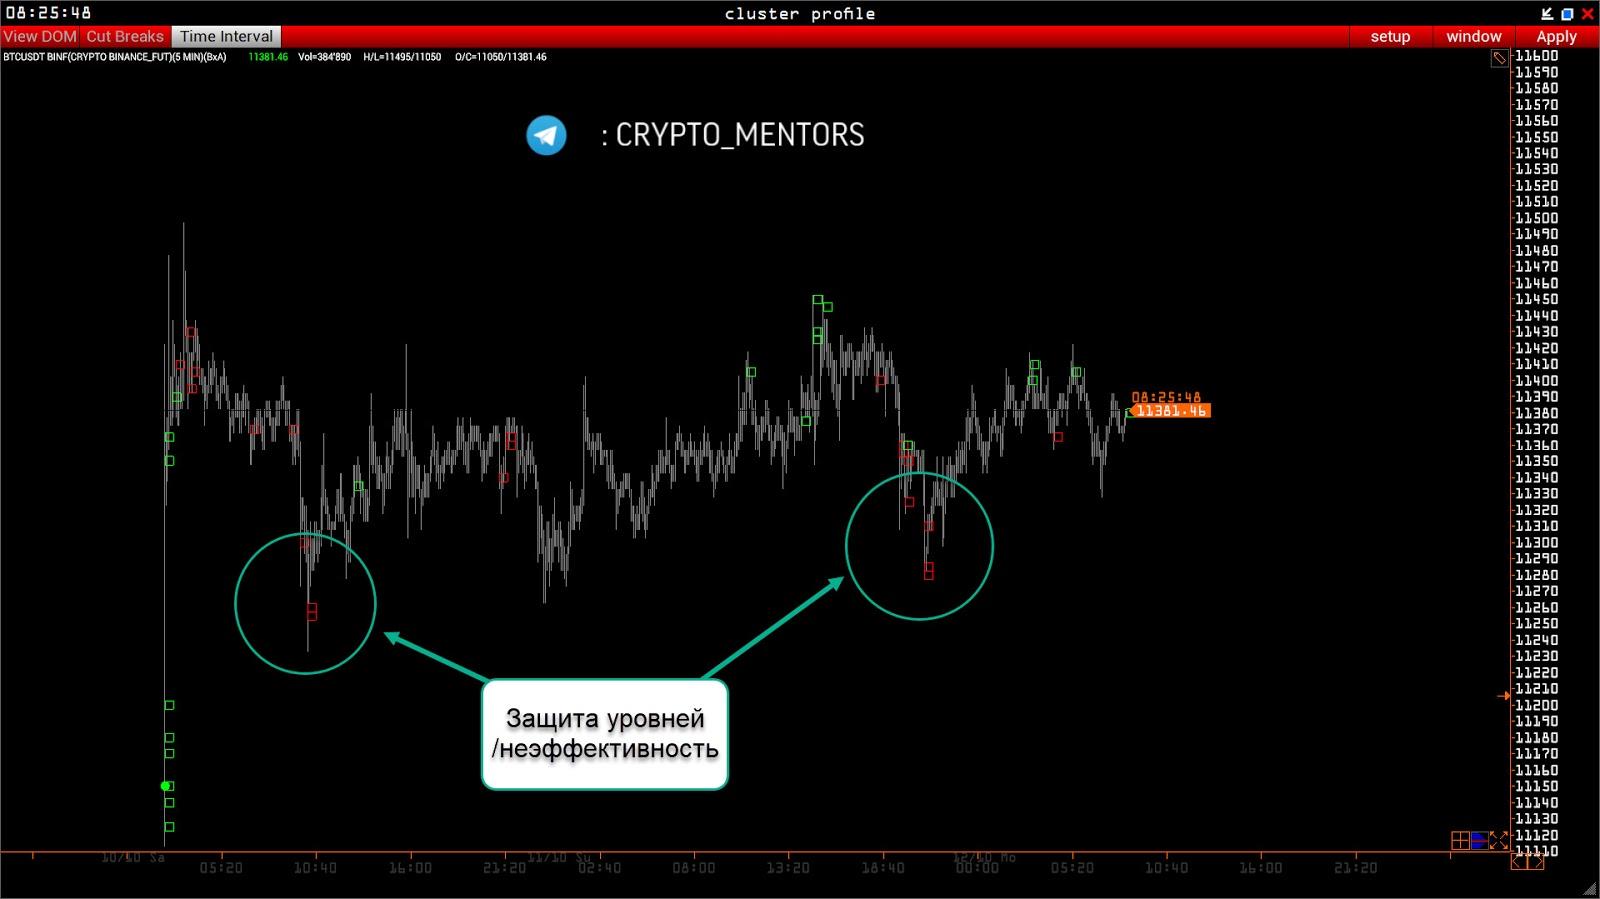
In this context, we see clear selling inefficiencies at the extremes, suggesting these levels are defended.
Subscribe to ForkLog’s channel on YouTube!
Рассылки ForkLog: держите руку на пульсе биткоин-индустрии!