

Crypto price analysis: prospects for further gains
The leading RoboForex analyst Dmitry Gurkovsky explains the possible scenarios for Bitcoin’s price movement and several popular altcoins.
Bitcoin buyers managed to push the price out of the sideways range, and now there is every chance for continued growth. The next target is the $12,495 level, the price staying above which would indicate a confident rise of the asset to new highs. Its breakout is very important for the bulls, as there are risks of forming a reversal pattern — if it fails, bears will easily push the price down. Similar patterns are observed on the charts of Litecoin and Bitcoin Cash, so bulls must push beyond the nearest local highs to have a reason to talk about a full market rally.
Bitcoin
On the daily chart, the quotes breached the upper boundary of the corridor, in which the asset had been confined for a long time, and settled above the $11,200 level. Here, too, the breakout of the upper boundary of the descending channel occurred, indicating the market’s desire to move higher further, toward the $12,495 level. An additional signal in favor of price growth is that RSI values are also bouncing off the rising trend line. However, buyers need to hold above the $12,495 level, otherwise with a breakout of $10,105 there could be a complete completion of the ‘Head and Shoulders’ reversal pattern, where the pattern’s final target would be the $7,000 level.
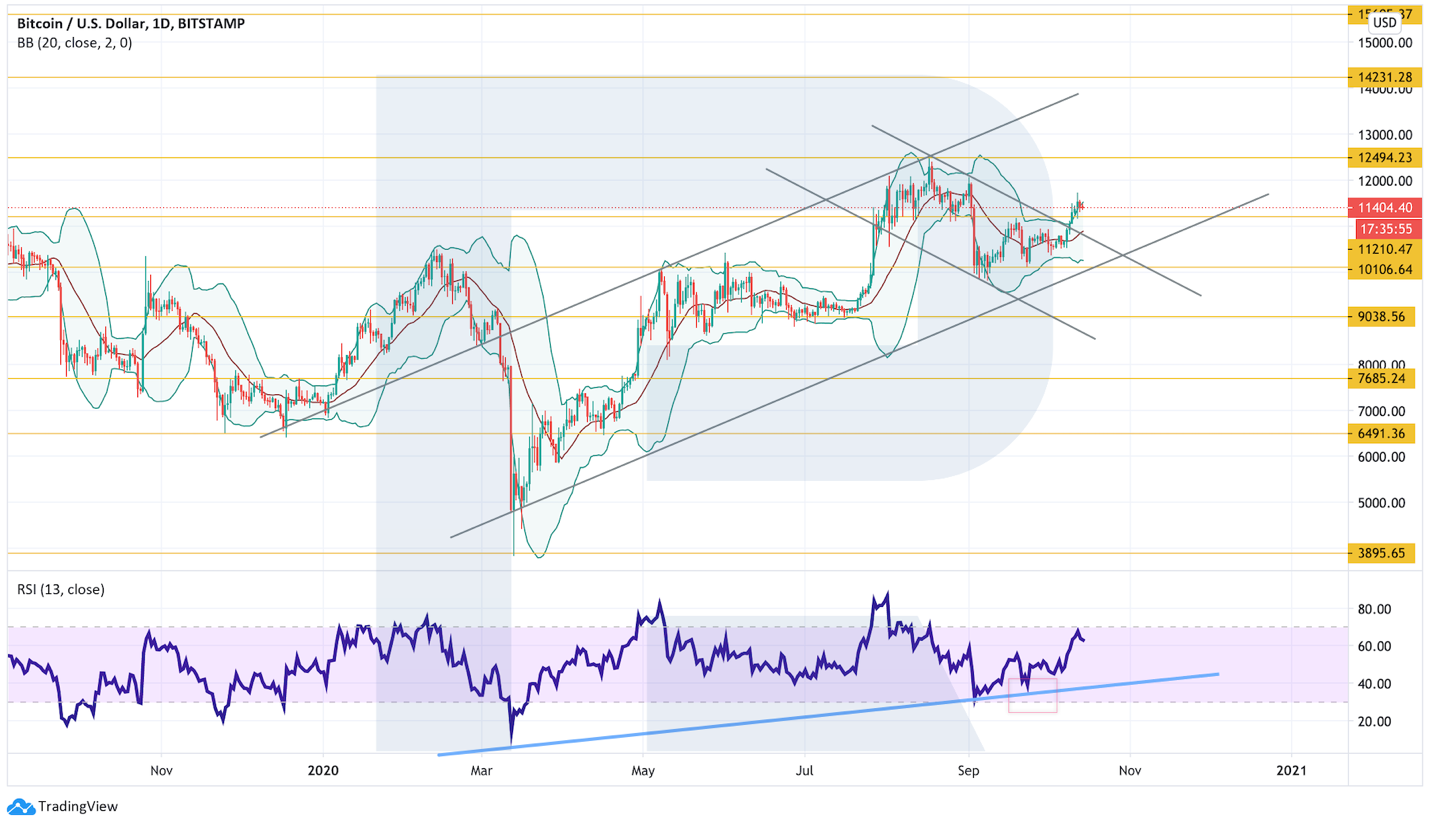
Daily BTC/USD chart from TradingView.
On the 4-hour chart, the quotes managed to break out of the ‘Triangle’ pattern. There are good chances to see a continuation of price growth as the pattern plays out. An additional signal in favor of this variant would be rebounds from the lower boundary of the ascending channel and support on the RSI. As can be seen, the previous test of the trend line on the RSI chart triggered a solid rebound in price. The scenario could be negated by a break below the lower boundary of the ascending channel with the price staying under the $10,960 level, which would indicate further decline toward $10,350.
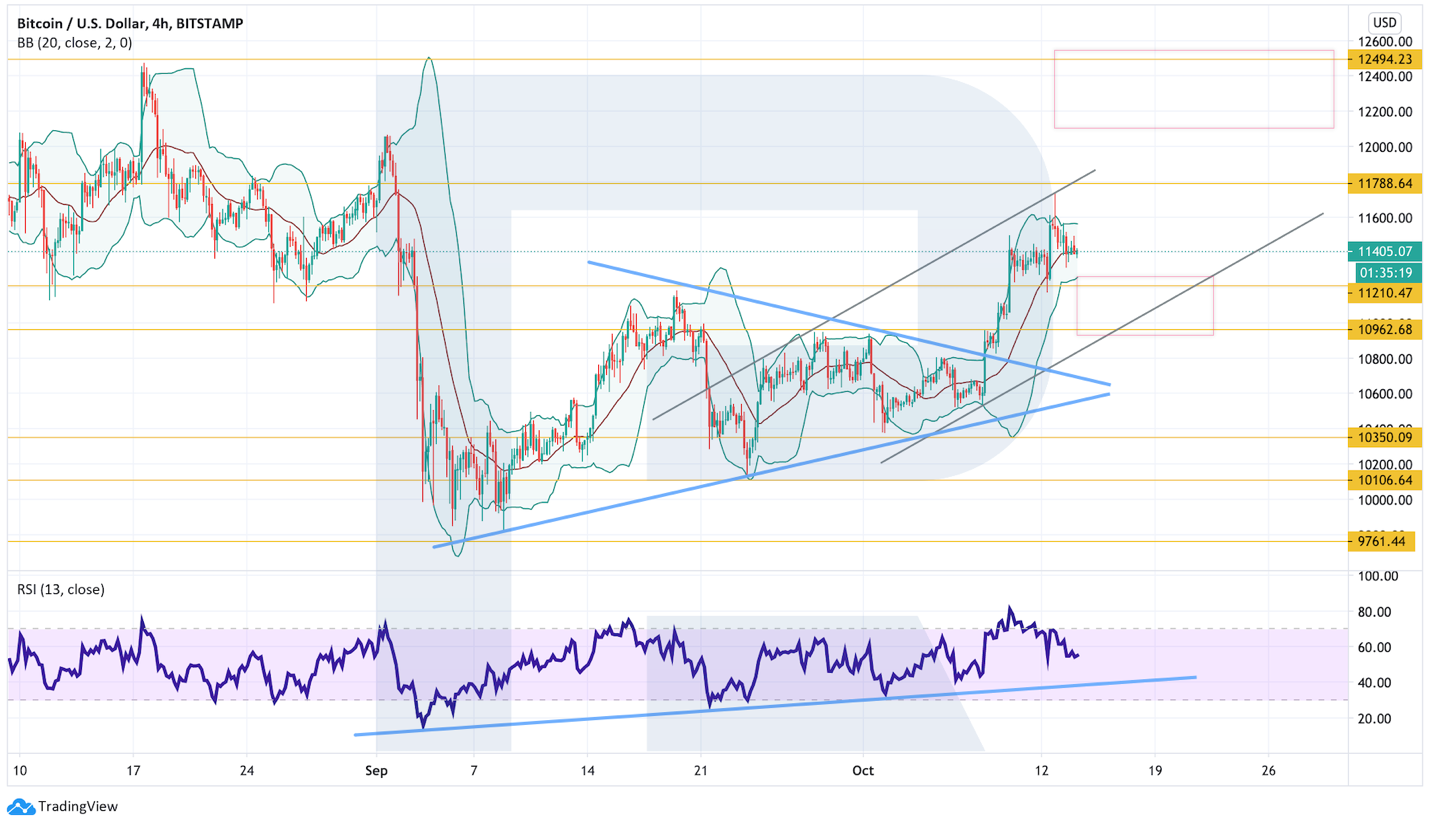
4-hour BTC/USD chart from TradingView.
Ethereum
ETH/USD quotes on the daily chart managed to rebound from the support level. With a breakout of the upper boundary of the downtrend channel and a price above $397, one can expect a bullish move and continuation of the pattern ‘5-0’. A strong signal in favor of growth is also the breakout of the downward trend line on the RSI indicator. The indicator values have now begun to return toward the broken line, after which one can consider subsequent price growth. The growth scenario would be negated by a break of the lower boundary of the ascending channel with the price staying below $306, which would indicate a continuation of its decline to $208.
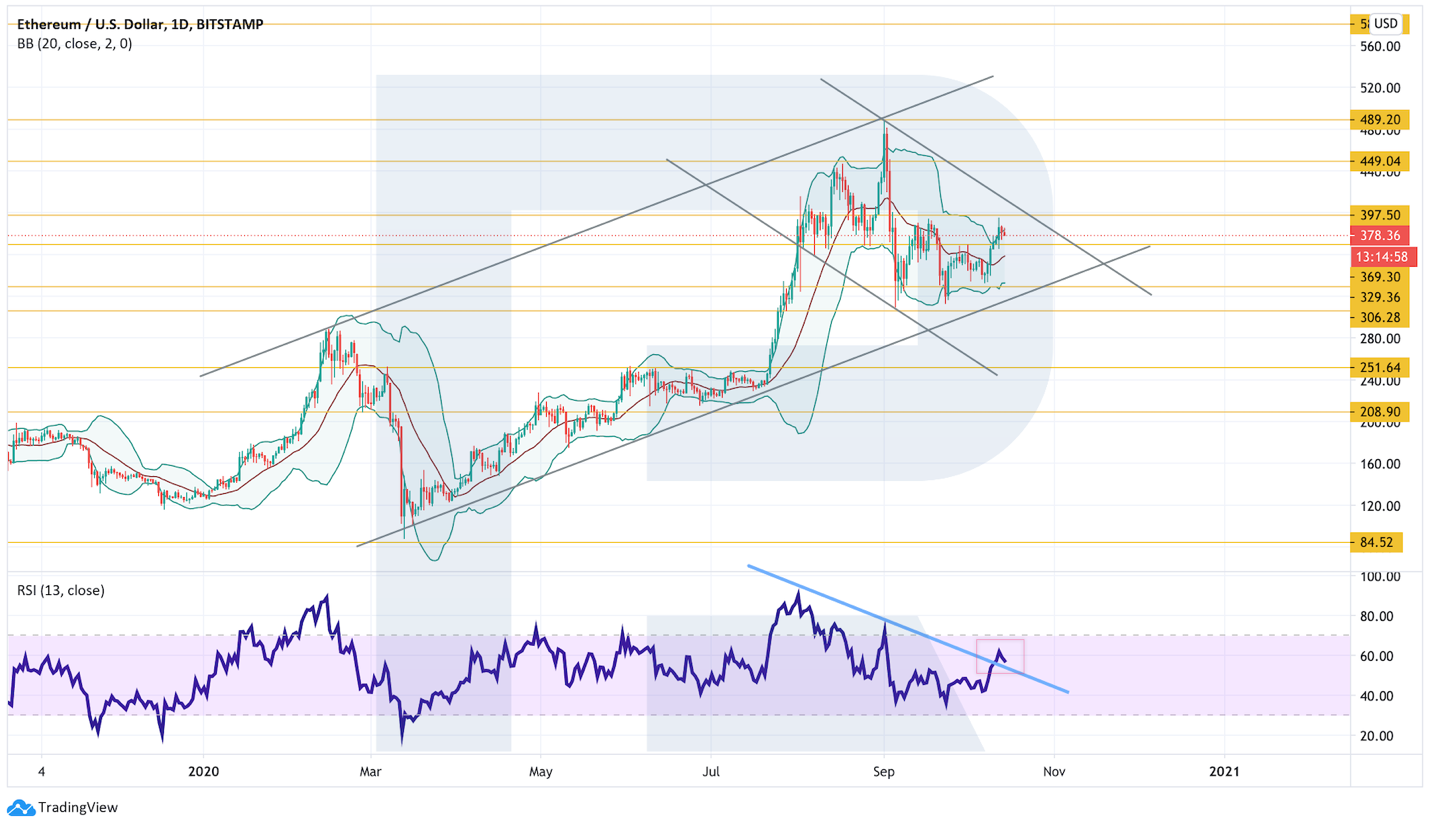
Daily ETH/USD chart from TradingView.
On smaller timeframes, the quotes have broken above the upper boundary of the ‘Triangle’ pattern, which gives reason to expect further growth toward $450 as the pattern plays out. However, a correction with a test of the upper boundary of the pattern and a continuation of growth should not be ruled out. A bounce from the RSI support line would further support this scenario, where the previous test triggered a breakout of the triangle’s upper boundary. The upside scenario could be negated by a break below the lower boundary of the ascending channel with the price staying under $330, in which case one should consider a stronger downside impulse.
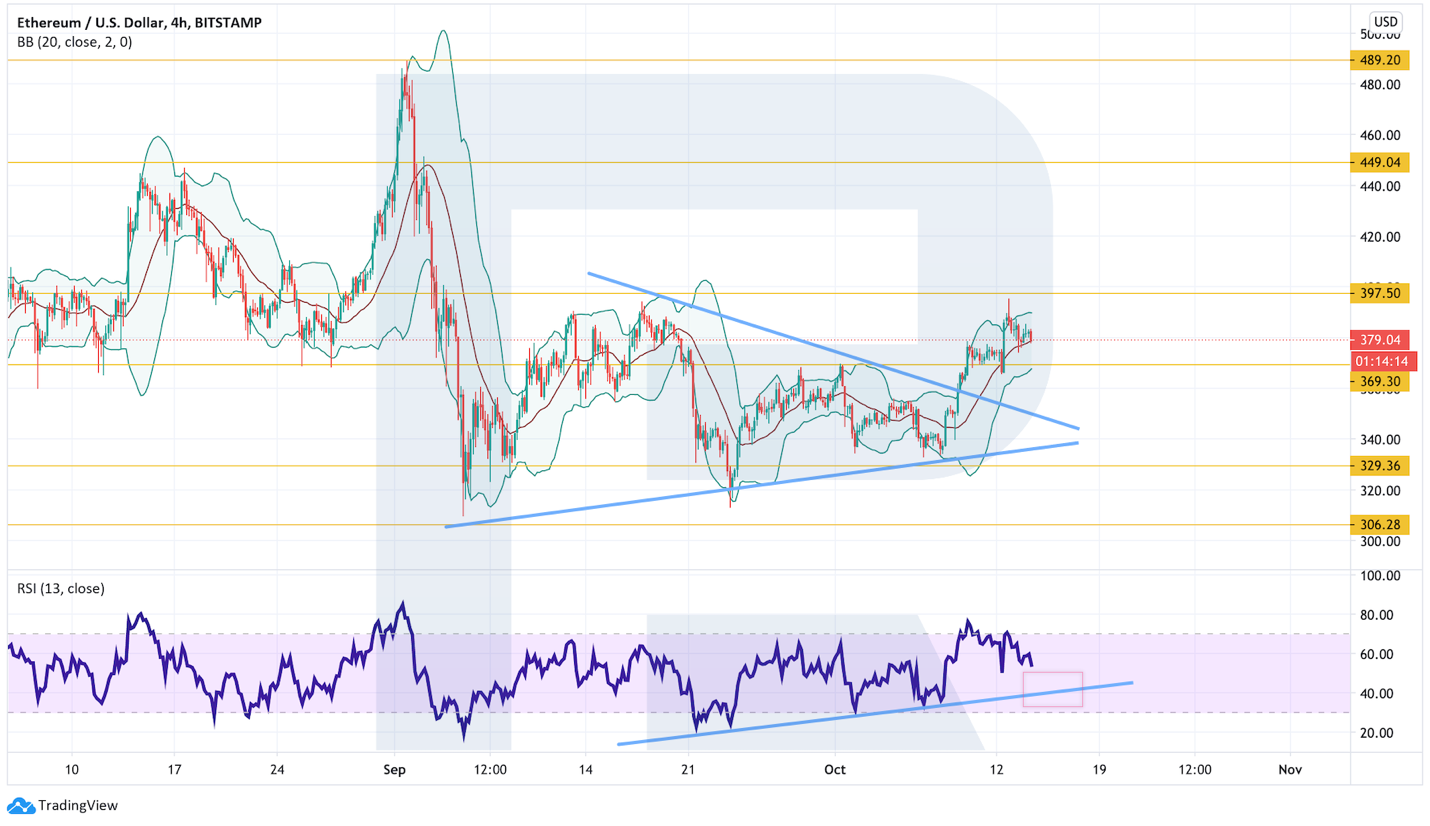
4-hour ETH/USD chart from TradingView.
Litecoin
Litecoin on the daily chart continues to move within an uptrend, and a reversal pattern ‘Head and Shoulders’ is forming here. For its invalidation, buyers need to push the price above $70, and such a move would indicate continued growth to $84. Confirmation would be a breakout of the upper boundary of the downtrend channel with prices held above $57. If sellers manage to breach the support region and hold below $38, one should consider a move down to $25. This could occur due to the formation of a reversal pattern.
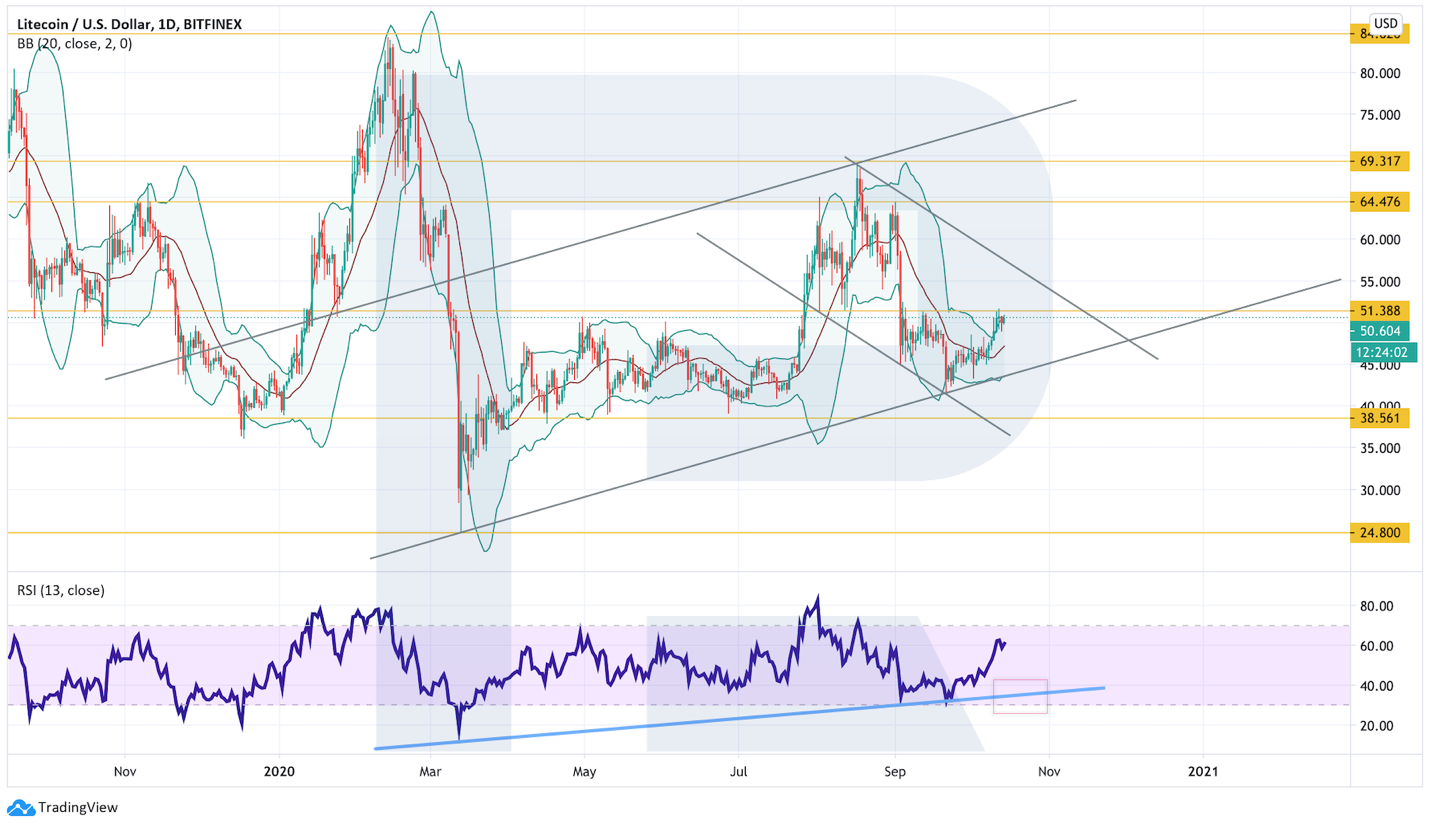
Daily LTC/USD chart from TradingView.
On the 4-hour chart, the quotes also left the triangle pattern. After a minor correction, one can consider a continuation of growth within the pattern. The growth target is $56. An additional signal in favor of this scenario would be a rebound from the RSI support line. In the case of a drop with a break of $41, one can consider a decline to $35.
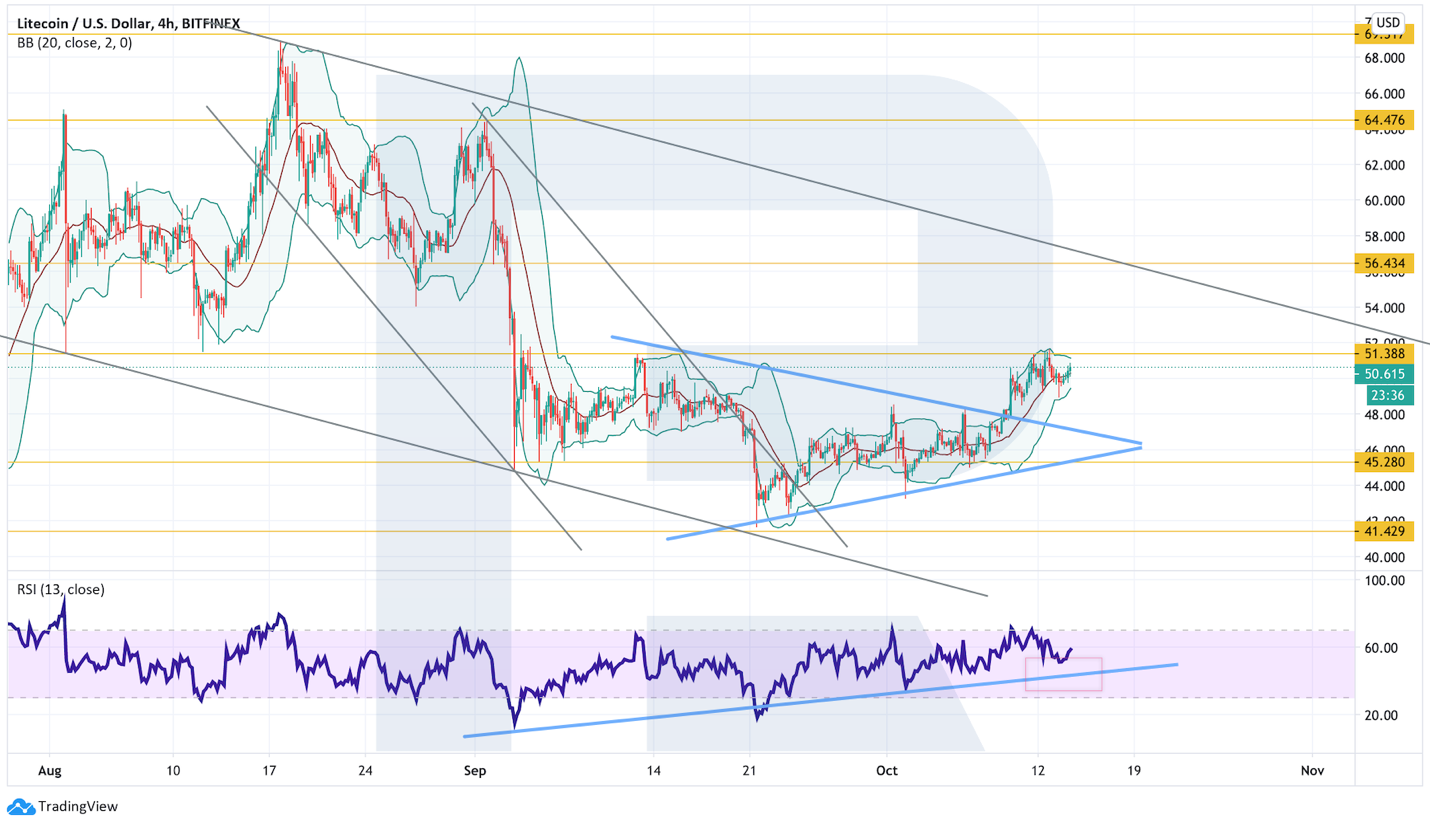
4-hour LTC/USD chart from TradingView.
XRP
Prices of XRP persistently test the upper boundary of the Bollinger Bands, but a full breakout has not yet occurred. Here too a large reversal pattern ‘Head and Shoulders’ is forming, for completion of which the price should test the $0.1675 level. It is here that one should expect the completion of the pattern’s right shoulder. A rebound from the RSI support line would support potential growth.
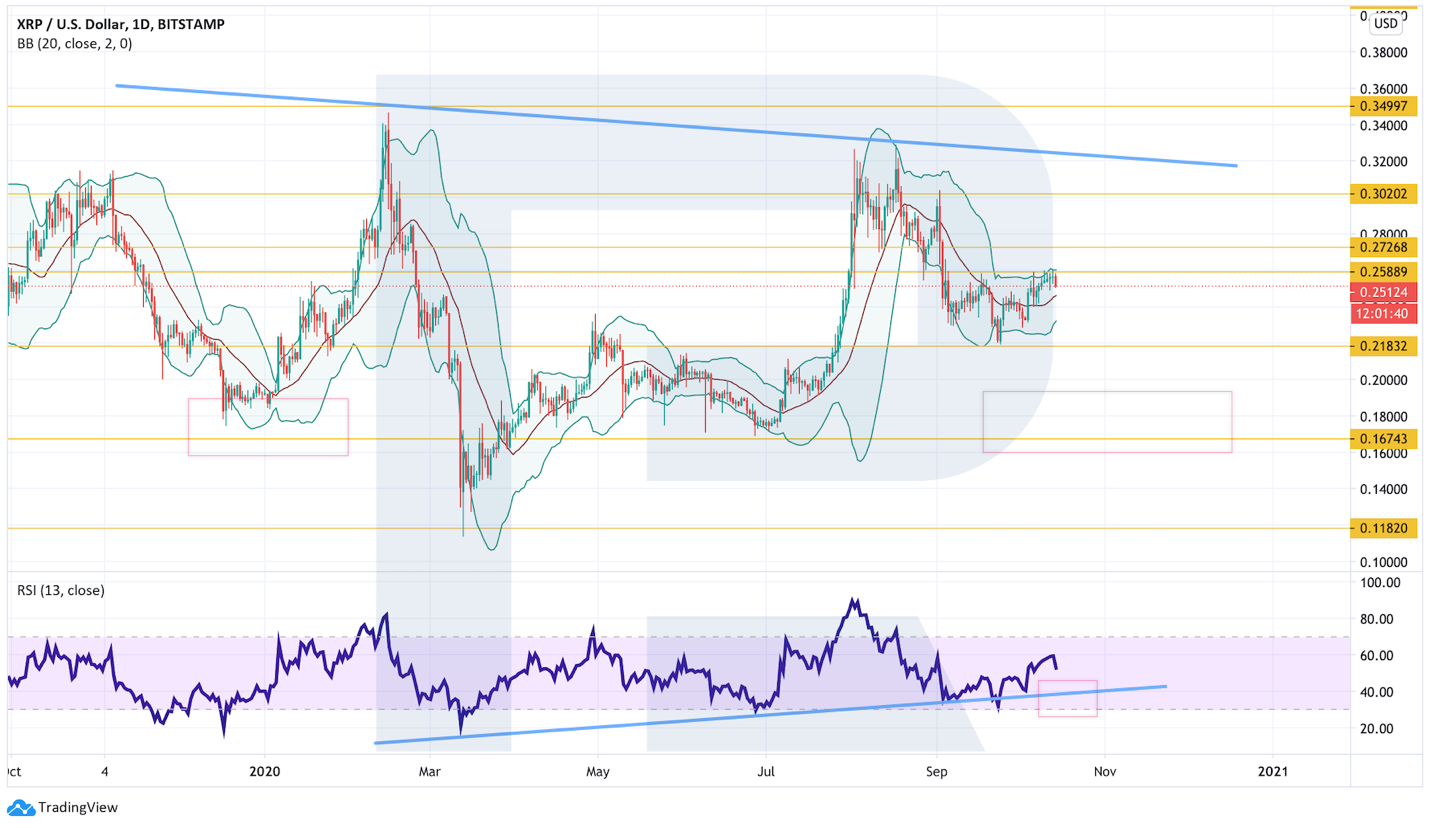
Daily XRP/USD chart from TradingView.
On smaller timeframes, the quotes trade within the Triangle pattern. Here too, note the importance of the $0.2590 level, which buyers have not yet managed to push above. Therefore one can consider testing the triangle’s lower boundary with a subsequent breakout of the pattern to the upside and continued growth toward $0.3050. An additional signal in favor of further growth would be a rebound from the RSI support line. The positive scenario could be negated by a break of the triangle’s lower boundary with the price holding below $0.2400, in which case one should expect a decline to $0.2185.
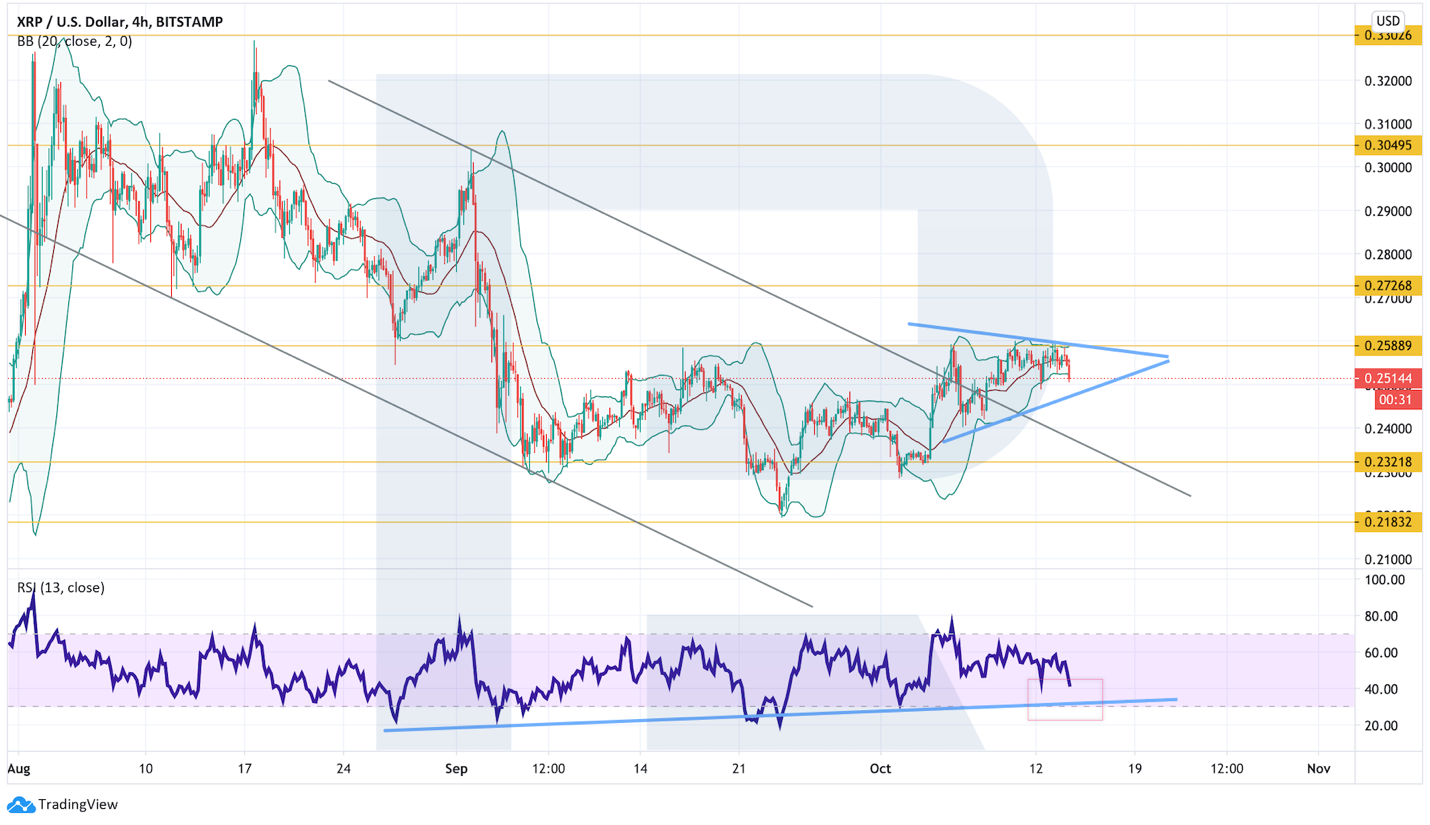
4-hour XRP/USD chart from TradingView.
Bitcoin Cash
On the daily chart, Bitcoin Cash quotes managed to rebound from the support area. The next target is $279, a breakout of which would indicate continued growth toward the $338 level. Here too runs the upper boundary of the downtrending channel, and its breakout would be a strong signal for the development of an up move. If sellers manage to rebound from the downtrend line and hold below $199, the option of a decline to $140 should be considered.
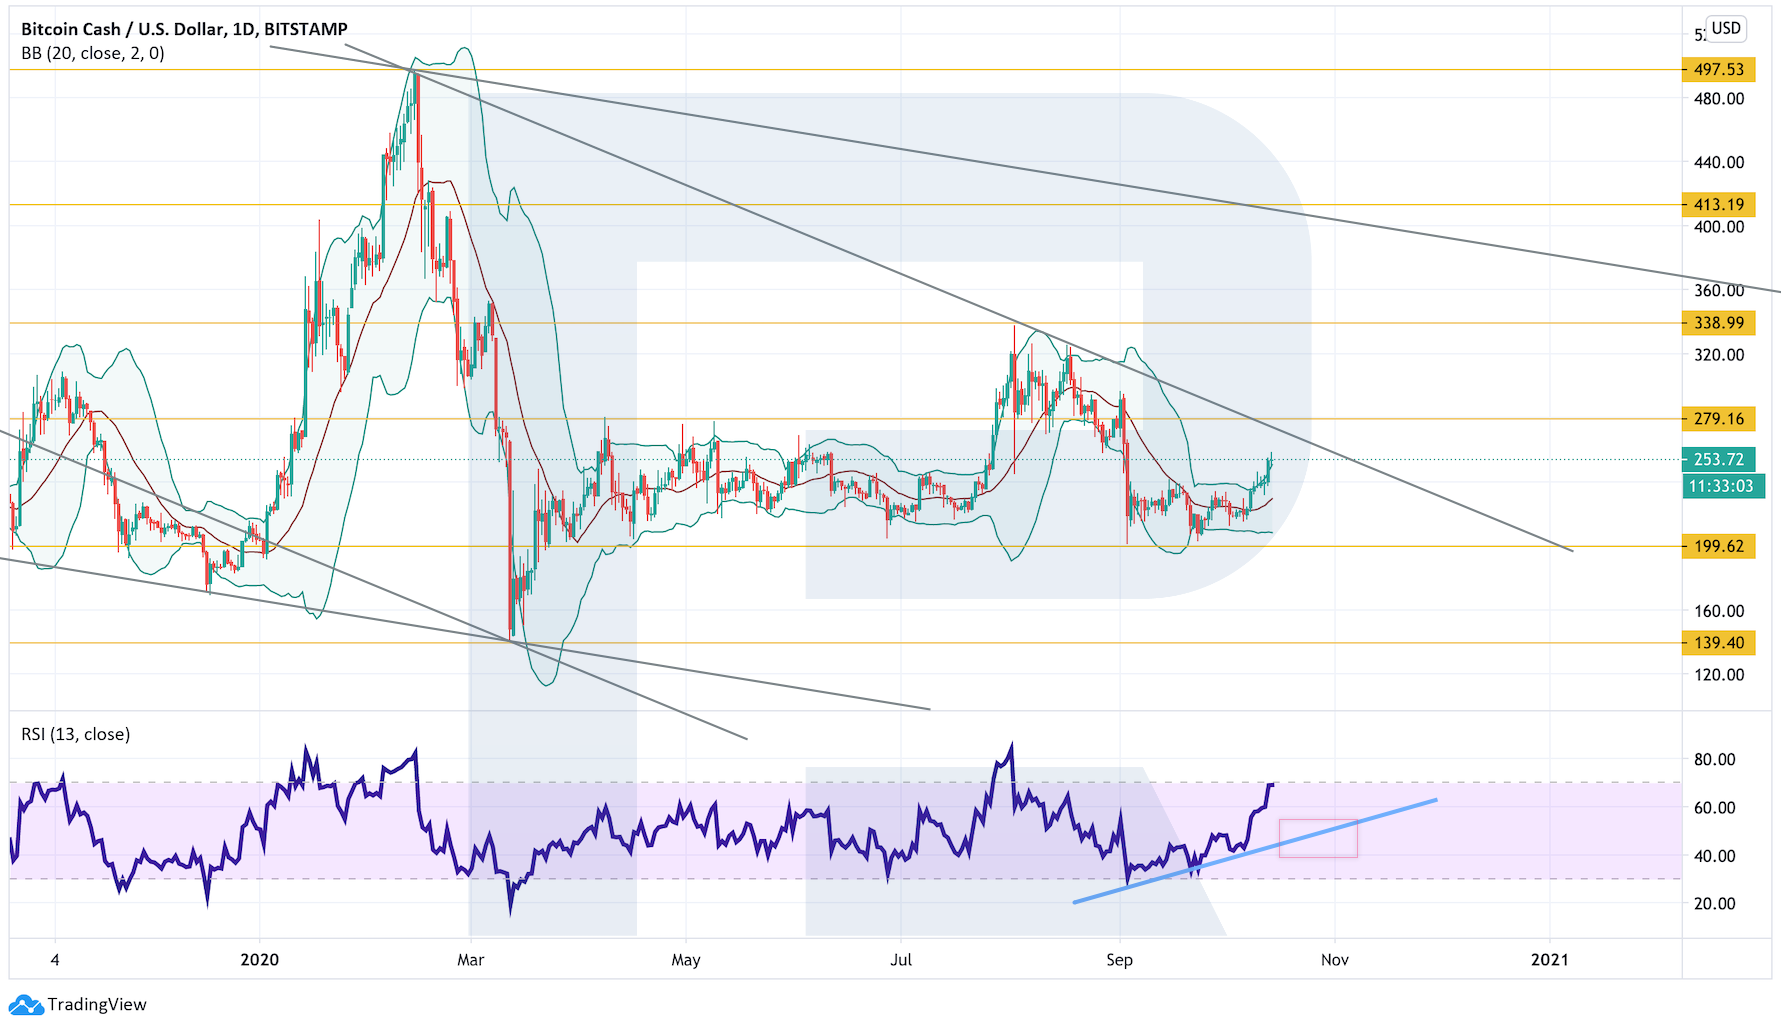
Daily BCH/USD chart from TradingView.
On the 4-hour chart, quotes broke out of the ‘Triangle’ pattern upwards. The breakout has occurred, and within the pattern there is potential for further growth. The target is $299. Confirmation would be a breakout of the resistance zone with prices above $258. An additional signal in favor of the bullish scenario would be a rebound from the RSI support line. The negation of such a scenario would be a break of the support zone with prices below $199, in which case one should expect a resumption of the downside impulse.
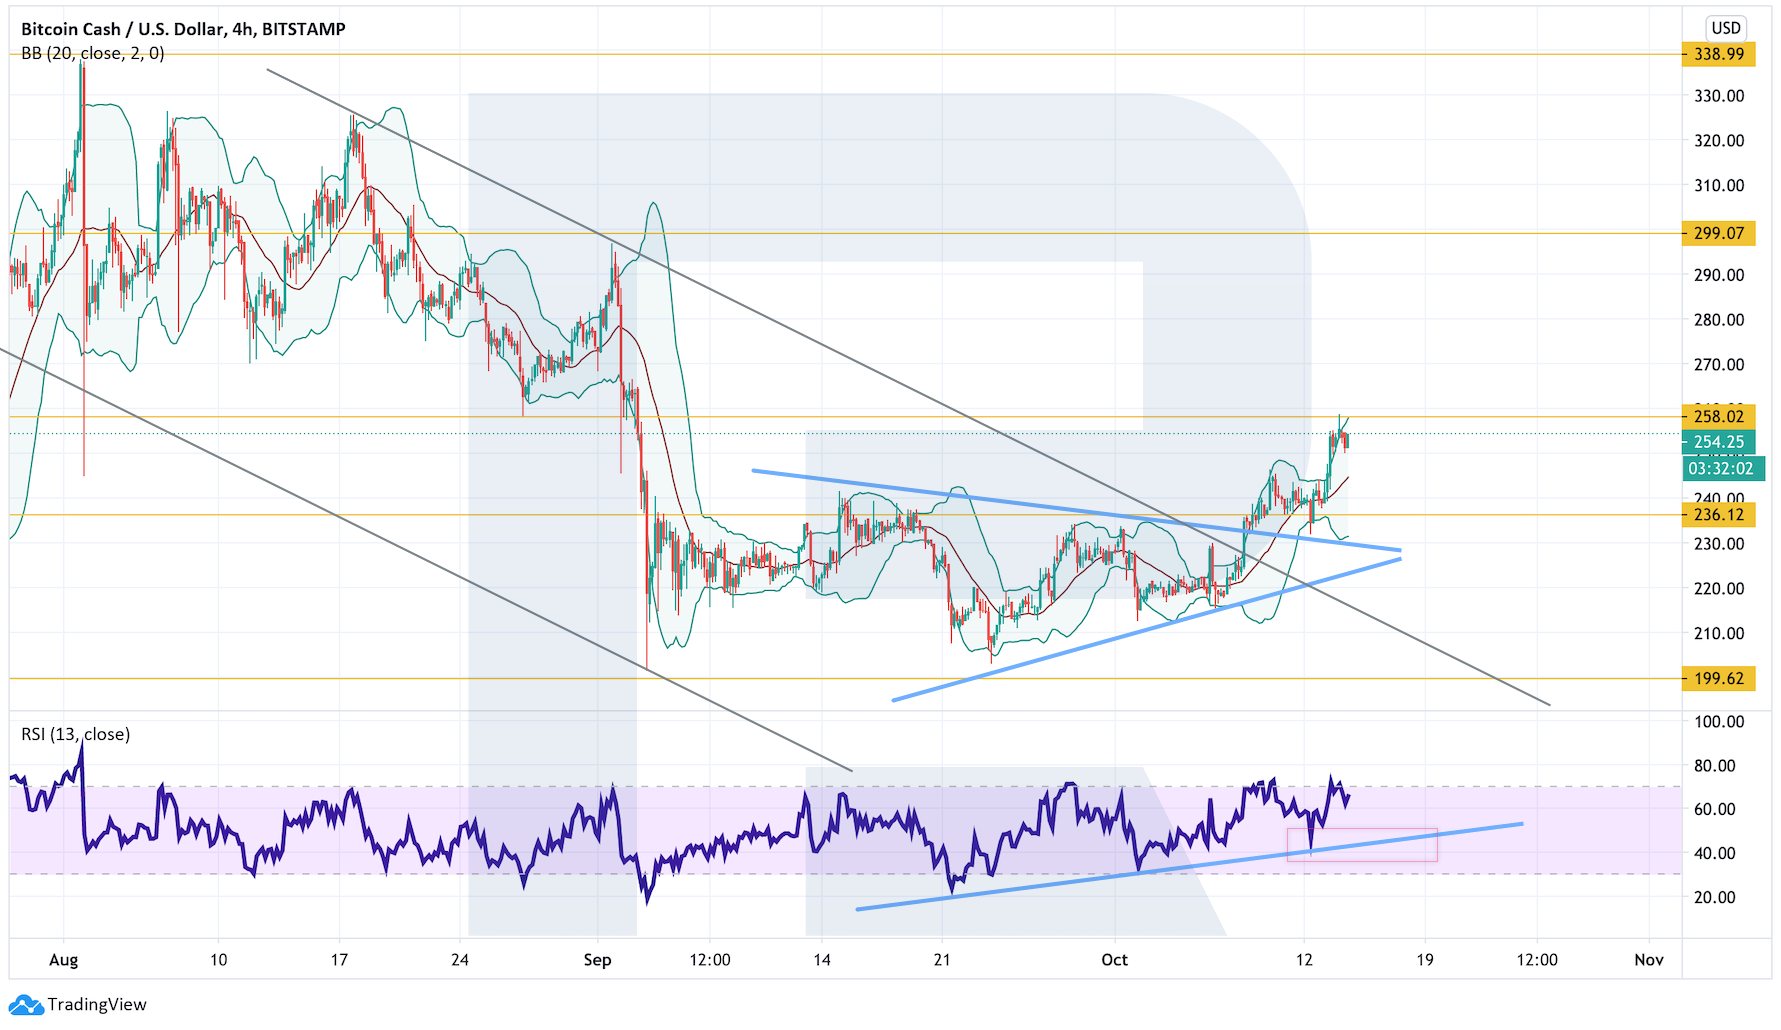
4-hour BCH/USD chart from TradingView.
Рассылки ForkLog: держите руку на пульсе биткоин-индустрии!