


Trader outlines indicators of bitcoin’s continued rise to $14,000
A practicing trader and founder of the project Crypto Mentors, Nikita Semov, discusses the current market situation.
Bar-by-bar analysis
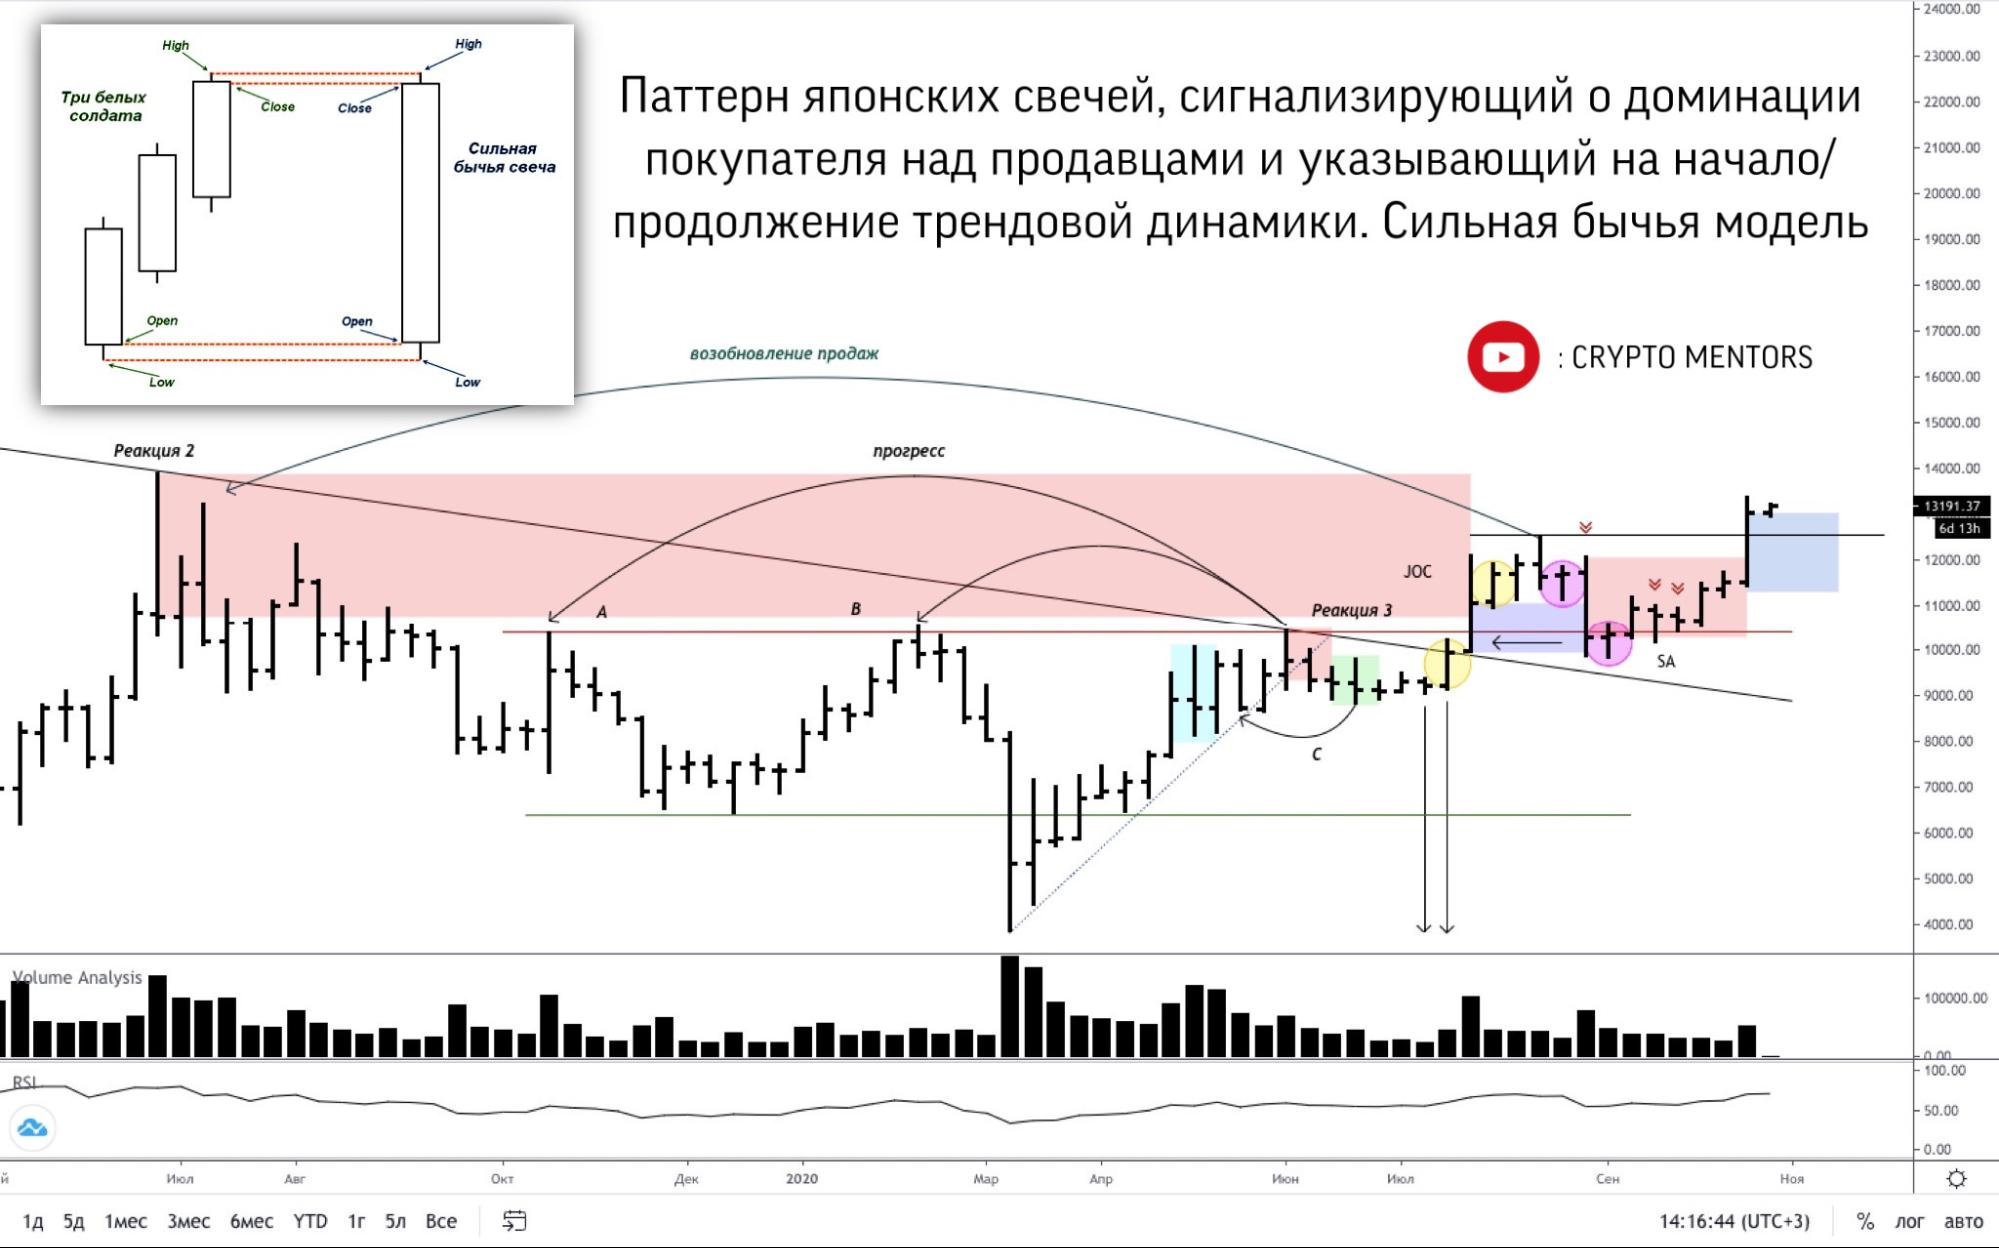
Let us look at the weekly time frame — the bar has a pronounced buy spread, which, by the matrix, is classified as large, indicating the dominance of the composite man. Relative to the current movement, the spread has grown markedly, as has the previous dynamics, forming the strongest up-bar in the last year.
Volume shows a pronounced spike, indicating purchases with confirmation of buyer interest. The progress is continuing, so the maximum one can expect is a test of the formed support bar and further continuation of the upward dynamics.
According to candlestick analysis, the “Three White Soldiers” pattern has formed — an indicator of significant demand.
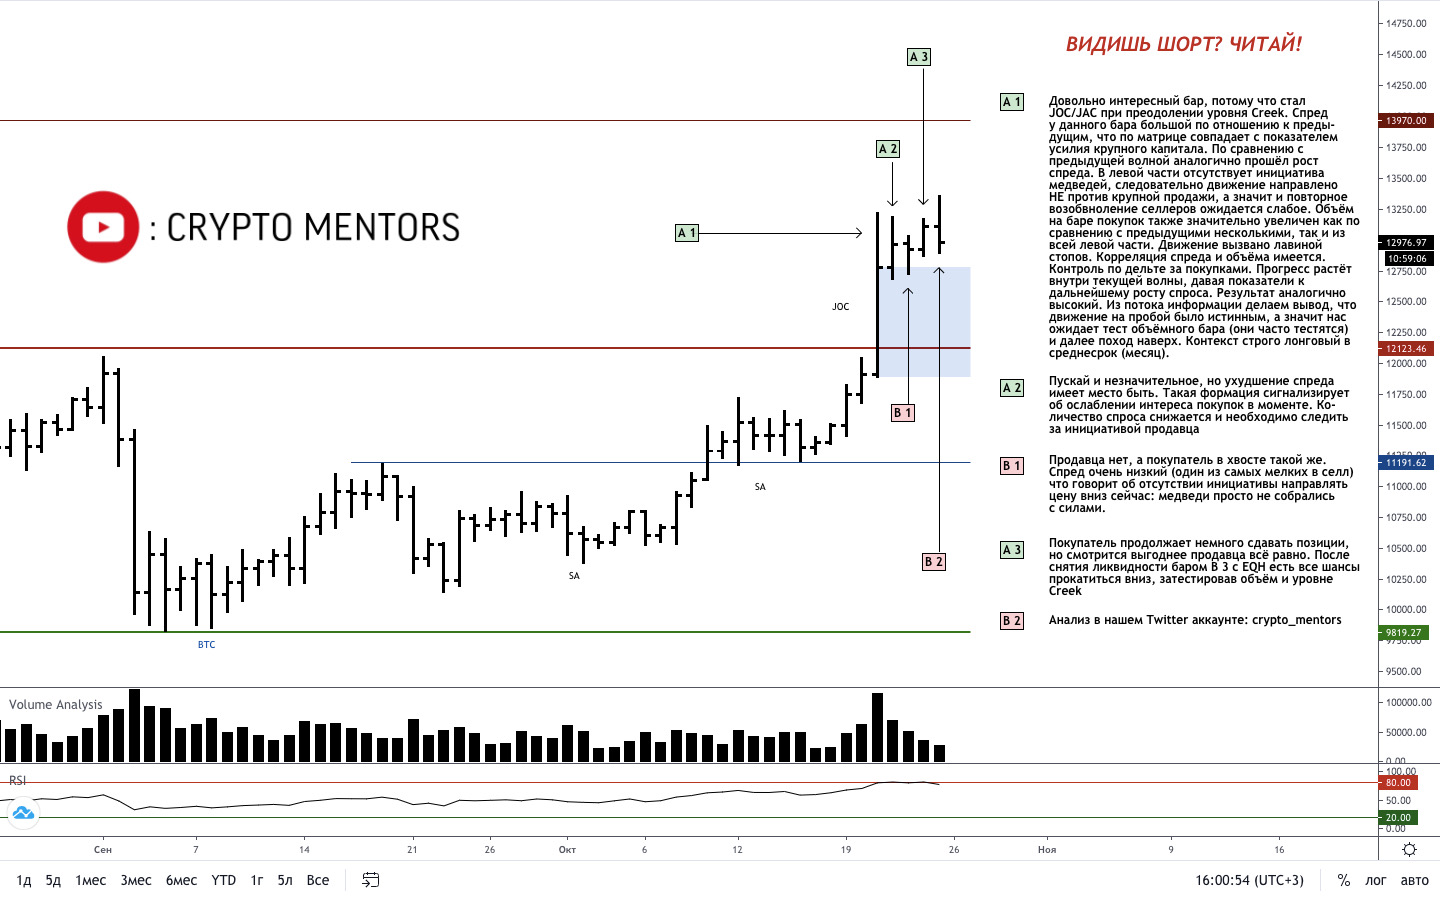
Bar-by-bar analysis of the completed week on the daily time frame shows that buying currently dominates, but a correction appears quite organic as a test, so we do not rule out a move downward without a substantial tilt in favour of the bears.
Expectations are built on a descent into the blue range on the chart, followed by a continuation of the rise. I recommend everyone to review the text on the image, where I spell out the nuances of the current situation in accordance with bar-by-bar analysis according to the Crypto.Pro system.
Today’s bar, 27.10.2020, has a high probability of closing on the selling side, since there is a fairly large pushing volume but no price response. The progress has weakened noticeably. The buyer for the day is slightly losing to bitcoin — an additional sign indicating a minor selling correction with a subsequent resumption and surpassing the current highs.
Price Action and VSA
A typical balance with clear Ice and Creek levels. After the UT pattern, there was a test and expansion with liquidity absorption in one direction. The time is ripe to expect a second expansion with stops collected below in the SP format with EQL.
Carrying out such a breakout, the price has every chance to continue rising, as it encounters a support bar on the left. This pattern is quite typical, given the appearance of the BUNP, so the preferred scenario is the one indicated by the arrows on the chart; use it as your guide.
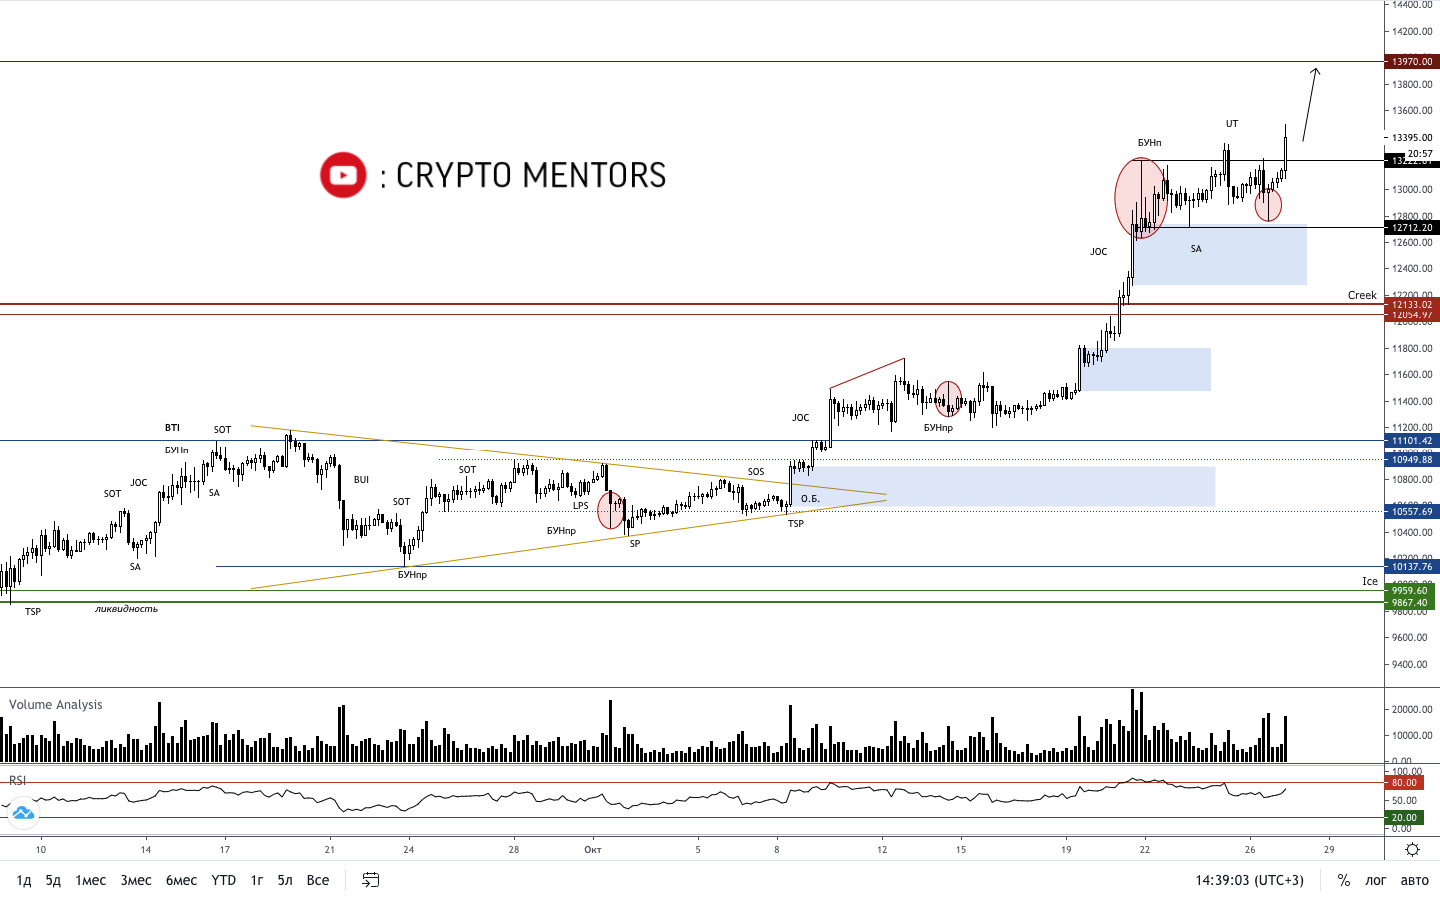
The global situation has not changed, so you can review our previous analysis, where we pointed to important long-term zones.
The balance continues. Over the weekend there were early signs of top-value protection [1]. From the bottom, holding elements appeared on every breakdown [2] — this indicates interest from a limit buyer in this balance. A break of this level by sellers, firstly, looks logical and expected, and secondly, signals strong dominance of buys and further expansion toward $14,000.
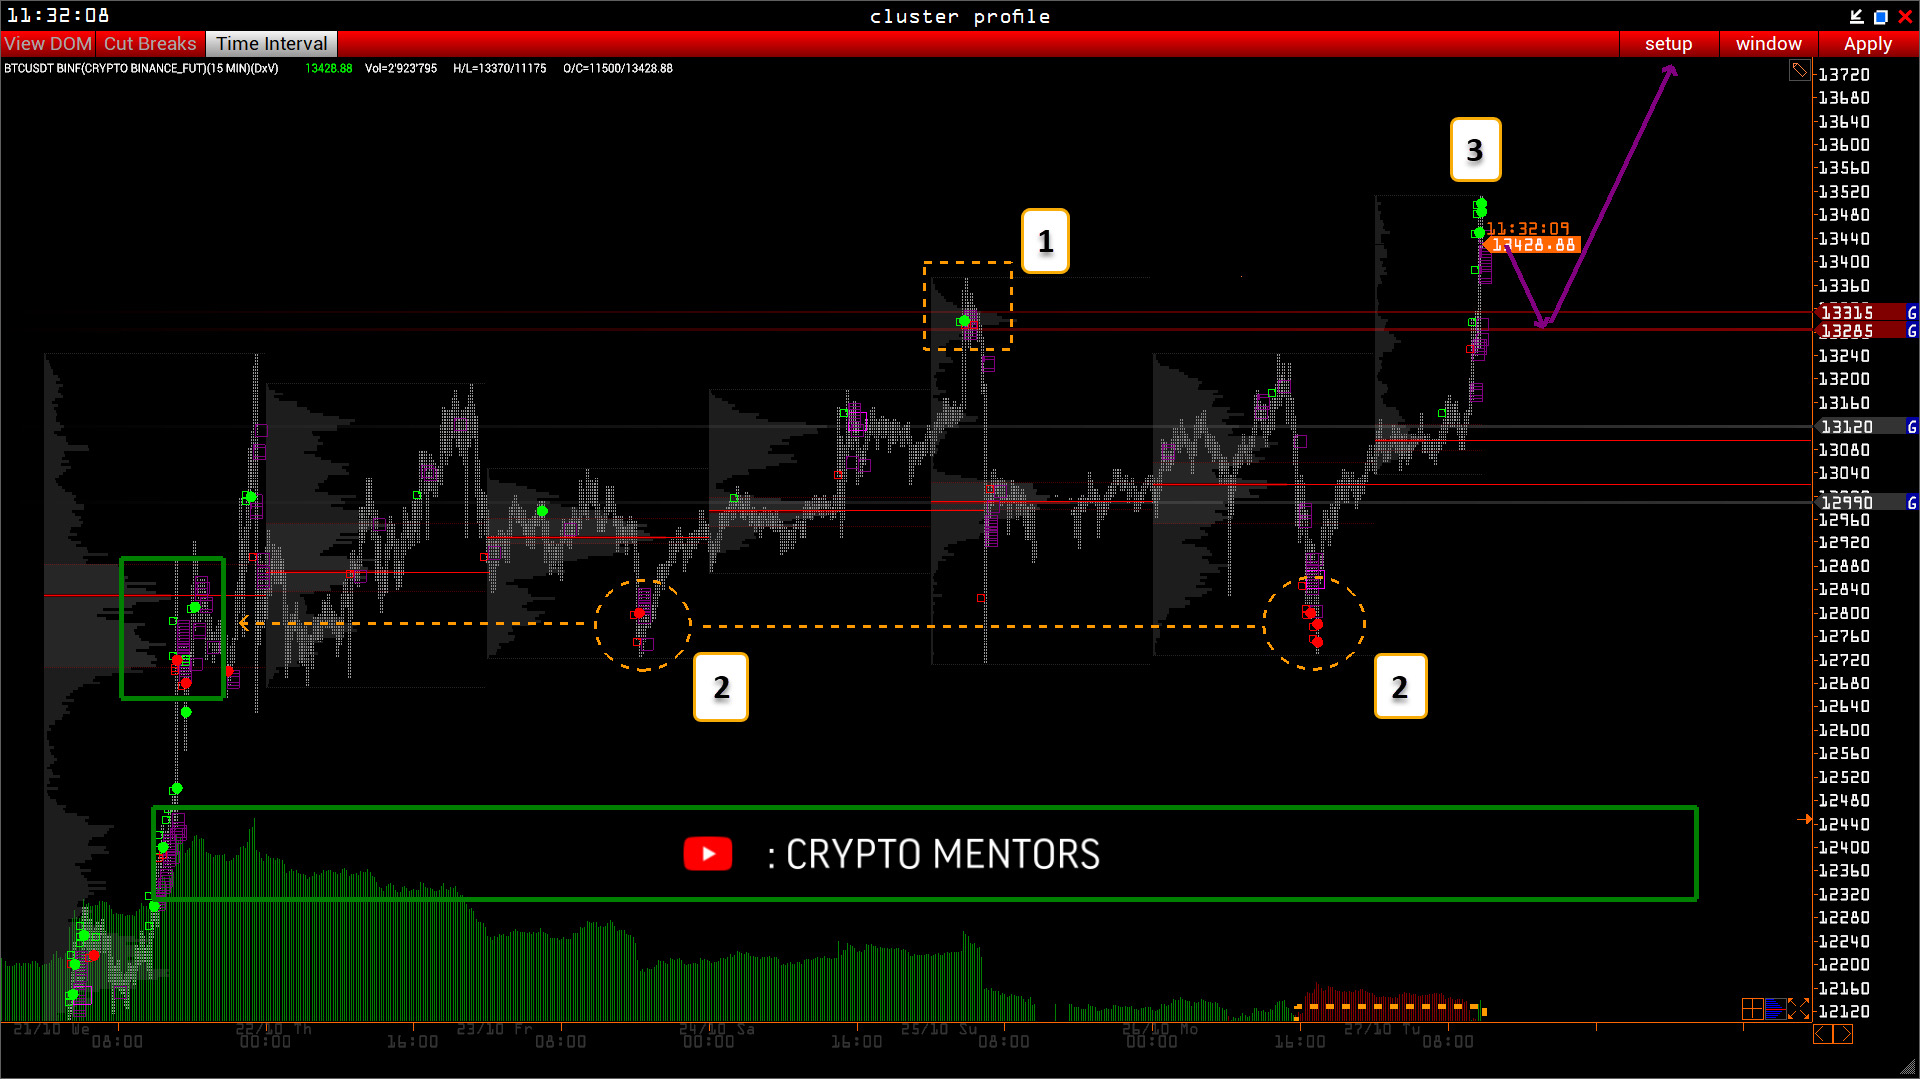
Учитывая выброс объемов и появление аномальных значений по дельте [3] говорит о том, что нас вполне может ожидать коррекция, обозначенная стрелочками, после чего восходящий тренд продолжится.
Conclusions
In the long term, we expect long positions; in the short term, we need to watch the reaction to this breakout. With a good test of $13,315, the rise will resume. A return to the balance zone can be classified as manipulation.
Subscribe to Forklog’s channel on YouTube!
Рассылки ForkLog: держите руку на пульсе биткоин-индустрии!