

Analyst warns of Bitcoin price risk if the $20,000 level is not breached
The leading RoboForex analyst, Dmitry Gurkovsky, explains possible future scenarios for Bitcoin’s price movement.
Bitcoin updated its all-time high after a deep correction, once again demonstrating that institutional and retail investors continue to buy the asset at every dip.
Bitcoin itself is in a powerful uptrend. While the leading cryptocurrency remains at the top of the market, gold continues to fall. Many major players openly announce closing positions in gold and buying Bitcoin and Ethereum at an 80 to 20 ratio. The update to its all-time high also fuels interest from new investors ready to buy “digital gold” at any price, just to enter the market ahead of the next wave of growth.
However, not all traders are confident in the continuation of the rally. John Bollinger, the author of the well-known indicator, warns investors that the current move in Bitcoin’s price closely resembles a classic pattern signaling a market top.
However, there is not yet confirmation of this pattern in the form of a break of the $16,200 support level, so discussing a market reversal is premature. Moreover, such a price construct can be easily broken by buyers if the price continues higher. For this reason, at current historical levels one must be very careful.
It is likely that we are dealing with a “Double Top” pattern, where the price tests the resistance level twice unsuccessfully, and then falls through the lower boundary of the pattern. In this case, one could expect the asset’s price to decline by the height of the pattern. If the bulls fail to break through $20,000 and the price falls below the $16,300 level, further declines to $13,070 should be expected.
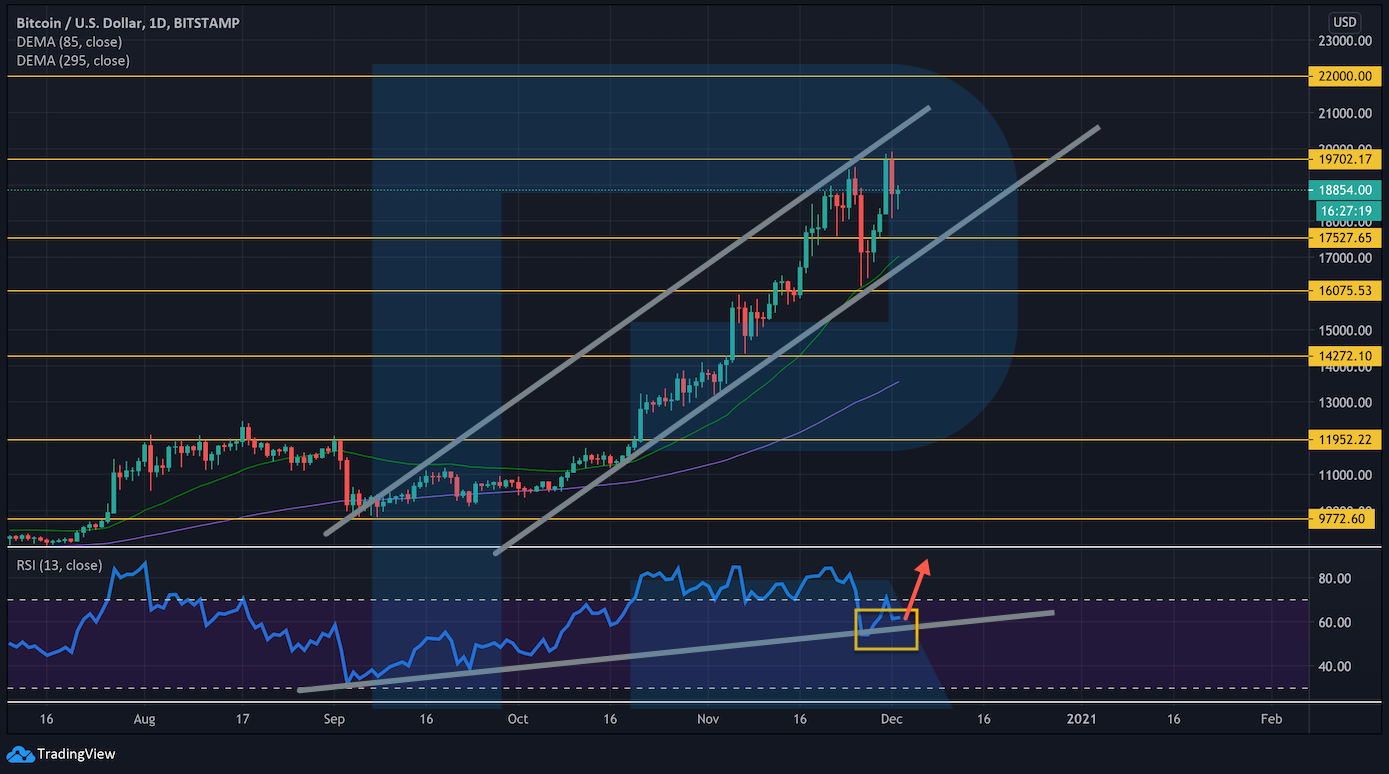
Daily BTC/USD chart for Bitstamp from TradingView.
From a technical analysis perspective, BTC is moving within a clear uptrend — during correction it has not even reached a fast moving average. The RSI indicator, meanwhile, rebounds from its support line, which serves as additional evidence in favor of price growth.
However, buyers must break above $19,705 to “break” the reversal pattern that John Bollinger mentioned. Otherwise, with a break of the lower bound of the bullish channel and a close below $17,525 the asset could enter a prolonged correction.
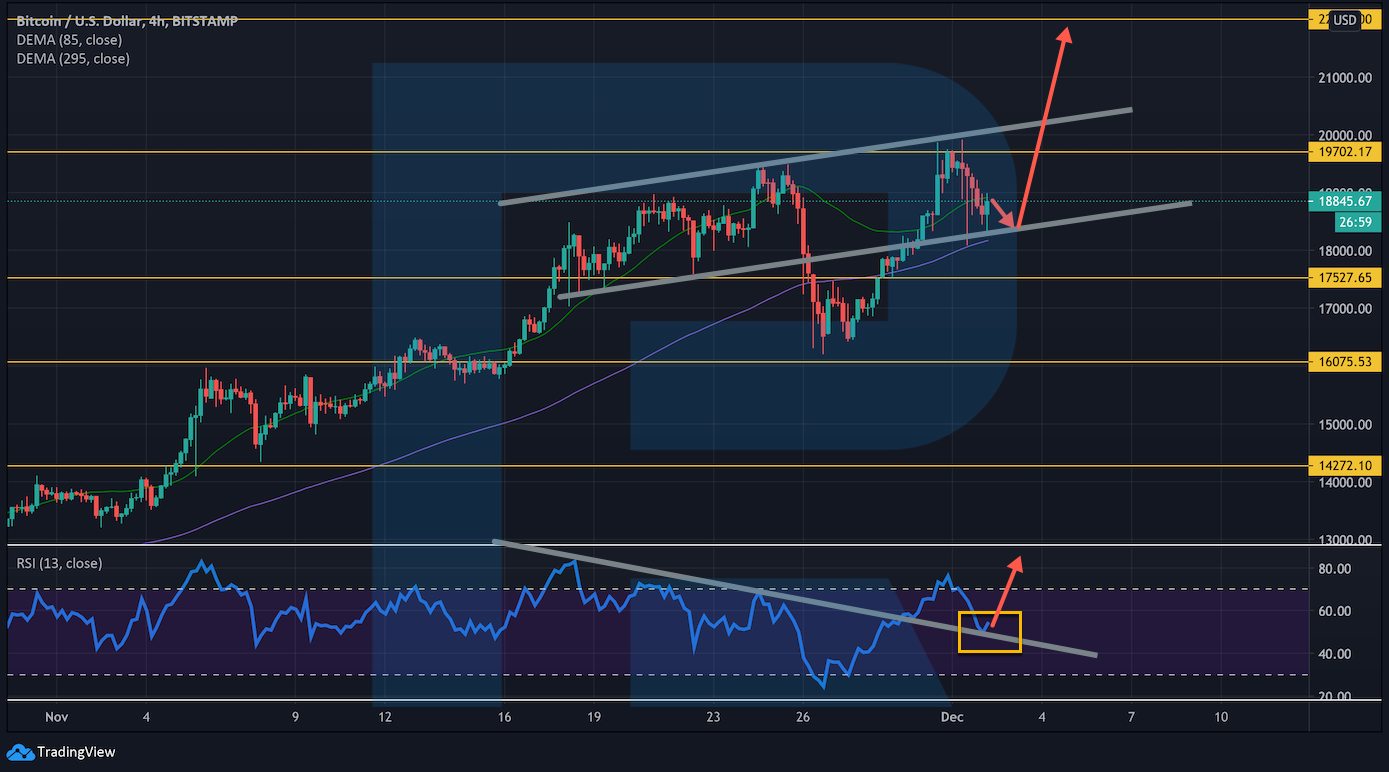
4-hour BTC/USD chart from Bitstamp on TradingView.
On the 4-hour chart, an inverted “Head and Shoulders” pattern is forming. This pattern isn’t fully template-like due to the slope of the neckline, and in this variant the price doesn’t always break it — often it rebounds higher from the right-shoulder level. So in the near term an aggressive rise for BTC to new all-time highs is possible.
If the price can settle above the neckline, the continuation of the asset’s growth to $21,500 and higher can be discussed. An additional signal in favor of this scenario is a bounce off the RSI trend line, which could trigger a breakout on the price close above the nearest resistance.
Subscribe to ForkLog news on Telegram: ForkLog FEED — full feed, ForkLog — the most important news and polls.
Рассылки ForkLog: держите руку на пульсе биткоин-индустрии!