


Trader outlines scenarios for Bitcoin price movement as it tests $20,000
The trader Ilya Meshcheryakov explains the current market situation.
Earlier last week Bitcoin managed to form a new all-time high on several exchanges, but breaking through $20,000 remains postponed. Crossing this level promises to be no easy task.
The vast majority of long-term holders of digital gold are seeing a positive effect from their investment. It is now hard to imagine a scenario in which none of them decides to lock in profits. The pressure from long-term holders is the first trigger for a decline in prices.
It is worth noting that many trading algorithms, when forming a new high, are tuned for active selling. This is linked to the large liquidity of purchases arising when short positions’ stop-orders trigger and new long positions become active. The latter are mainly opened by players entering on the media-driven hype around new price peaks. This becomes a good reason for large players to sell a portion of the cryptocurrency into the liquidity that emerges.
The medium-term outlook for BTC will be defined after a breakout from the current triangle. On the hourly chart volatility has been decreasing over the past week right around $20,000. A breakout from such a consolidation is usually impulsive. The height of the triangle is about $1,600.
The chart below marks the zones whose attainment would confirm the breakout of the pattern.
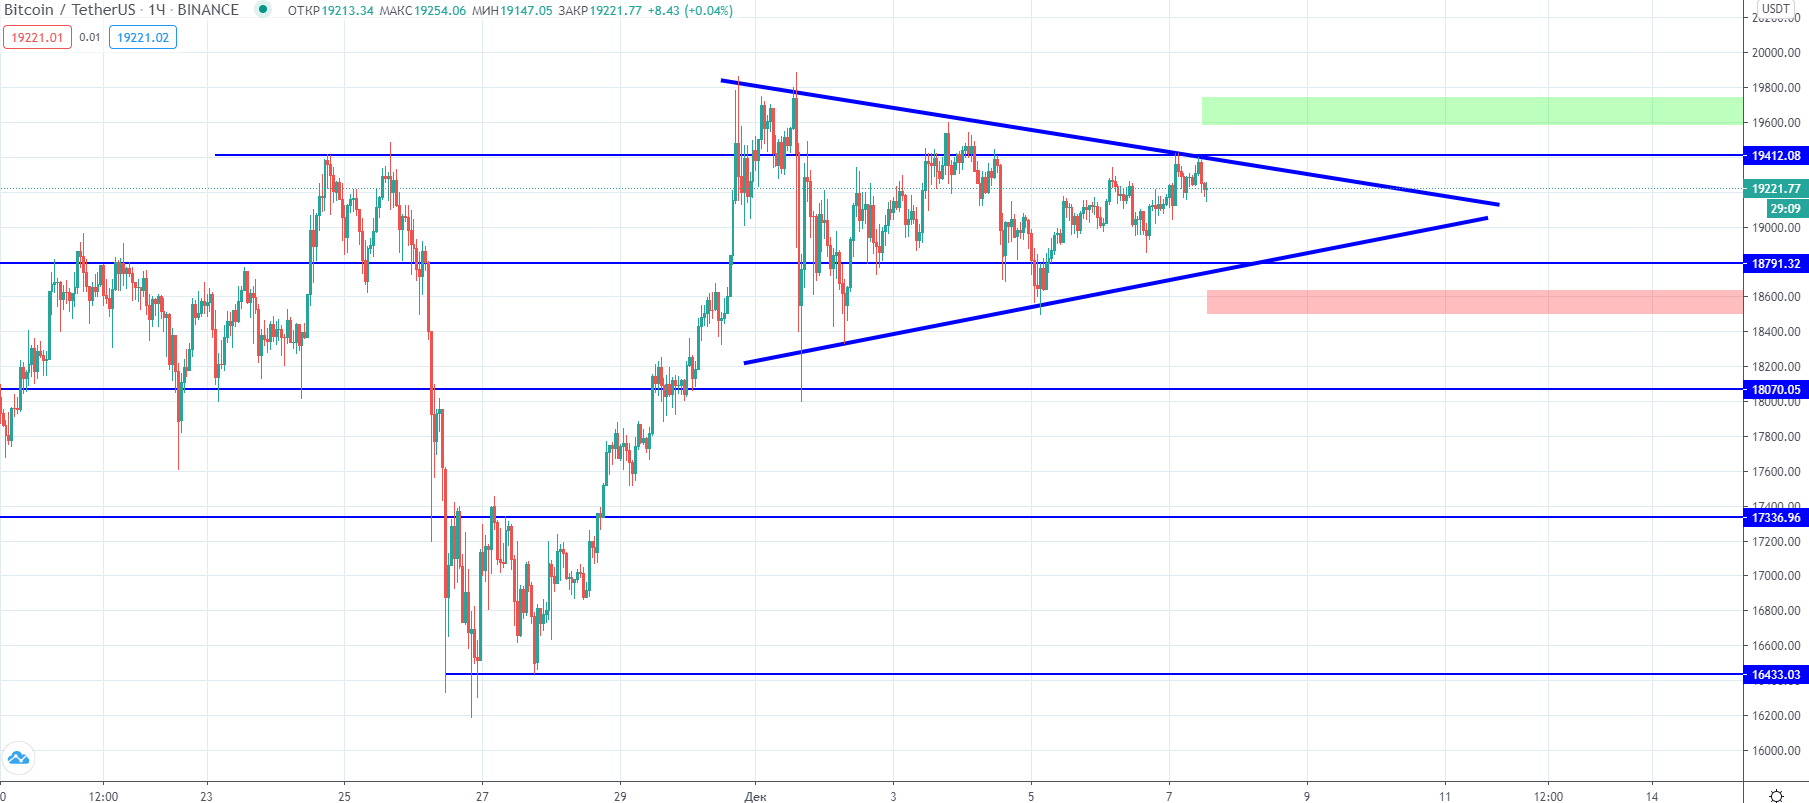
The triangle formed by Bitcoin price with zones highlighting the positive (green) and negative (red) scenarios. Hourly BTC/USDT chart from TradingView.
A break below the triangle would push the price toward around $17,300, while an impulsive move upward would target $21,000, with an intermediate zone at $20,500.
Triangles near price highs often break upward after a false downside breakout. However, final trading decisions should be made based on the price action.
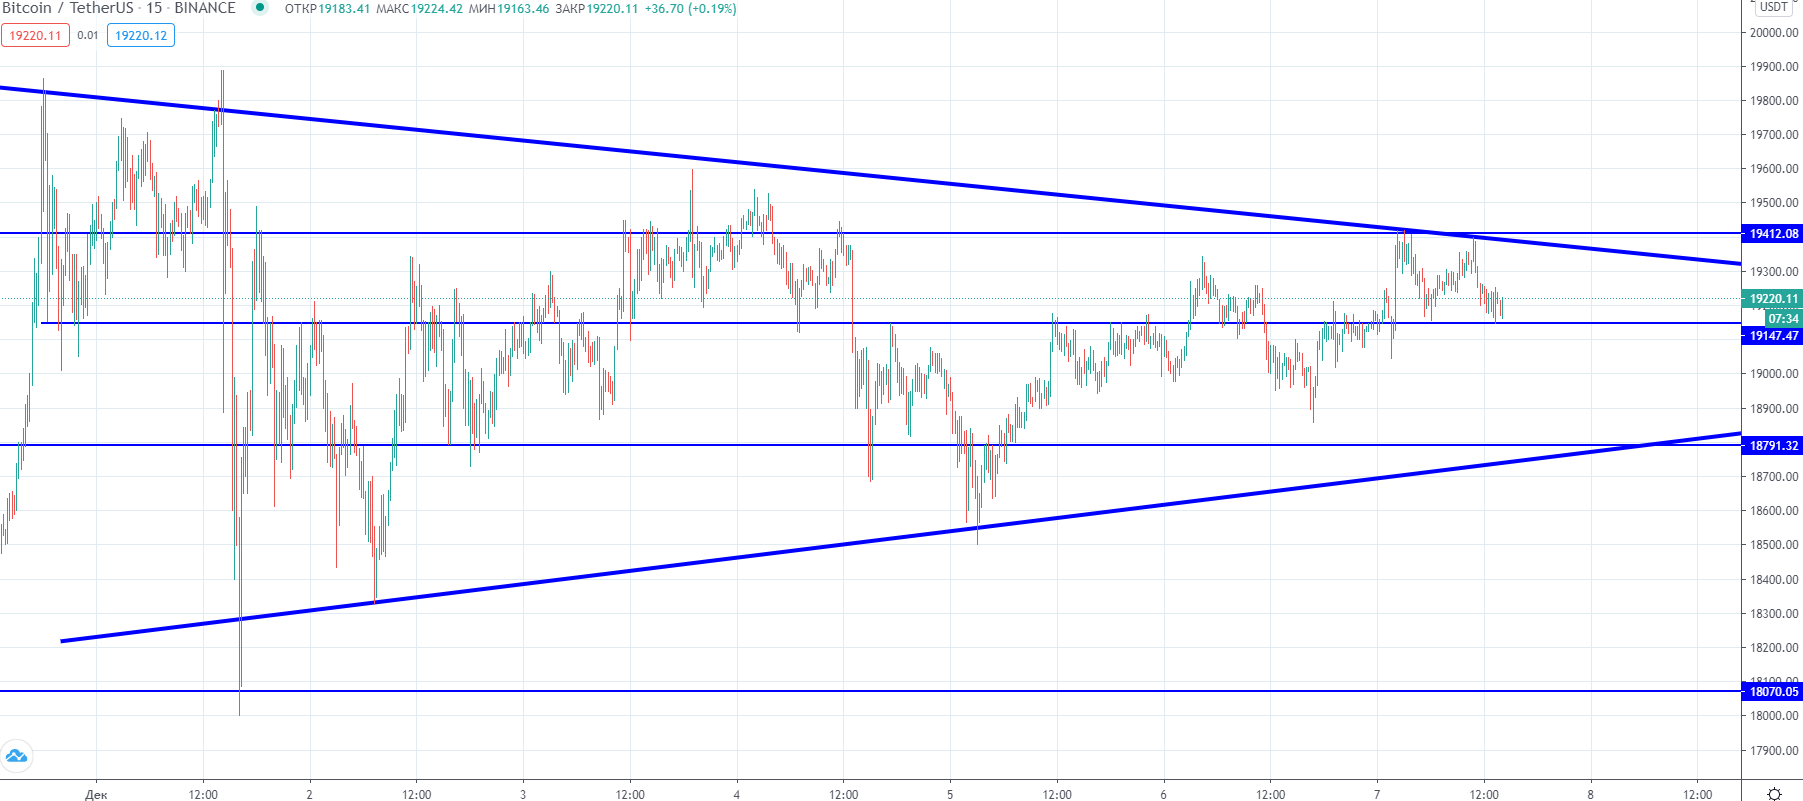
Support and resistance levels within the current consolidation. Fifteen-minute BTC/USDT chart from TradingView.
Trading inside a triangle is almost never a good idea due to the “spring effect” — risk control is hindered, and the probability of a breakout grows with every new candle. However, three price levels can help — $18,790 and $19,410 as support and resistance respectively, and an intermediate level at $19,150. The idea is to trade between the first two as in a price channel with an intermediate target as the third.
Despite the ongoing uncertainty, Bitcoin still has decent odds of hitting new highs this year. It is crucial to monitor developments around the current decline in volatility.
Follow ForkLog news on Twitter!
Рассылки ForkLog: держите руку на пульсе биткоин-индустрии!