

Trader notes potential downside for Bitcoin price
Trader Илья Мещеряков explains the current market situation.
In recent days, the crypto market has steadied somewhat and volatility has fallen sharply. This allows a measured assessment of Bitcoin’s medium- and long-term prospects.
For about two weeks now, BTC has been forming a “triangle” pattern. The pattern signals uncertainty and a narrowing of volatility. There is still some distance to extreme narrowing, so this situation is likely to continue for about another week.
From the price action inside the triangle, several conclusions can be drawn about the balance of power between bulls and bears.
The key support zone sits around $34,900 (marked in green on the chart below). From this level there was strong buying activity, as well as a false breakout that led to renewed price growth.
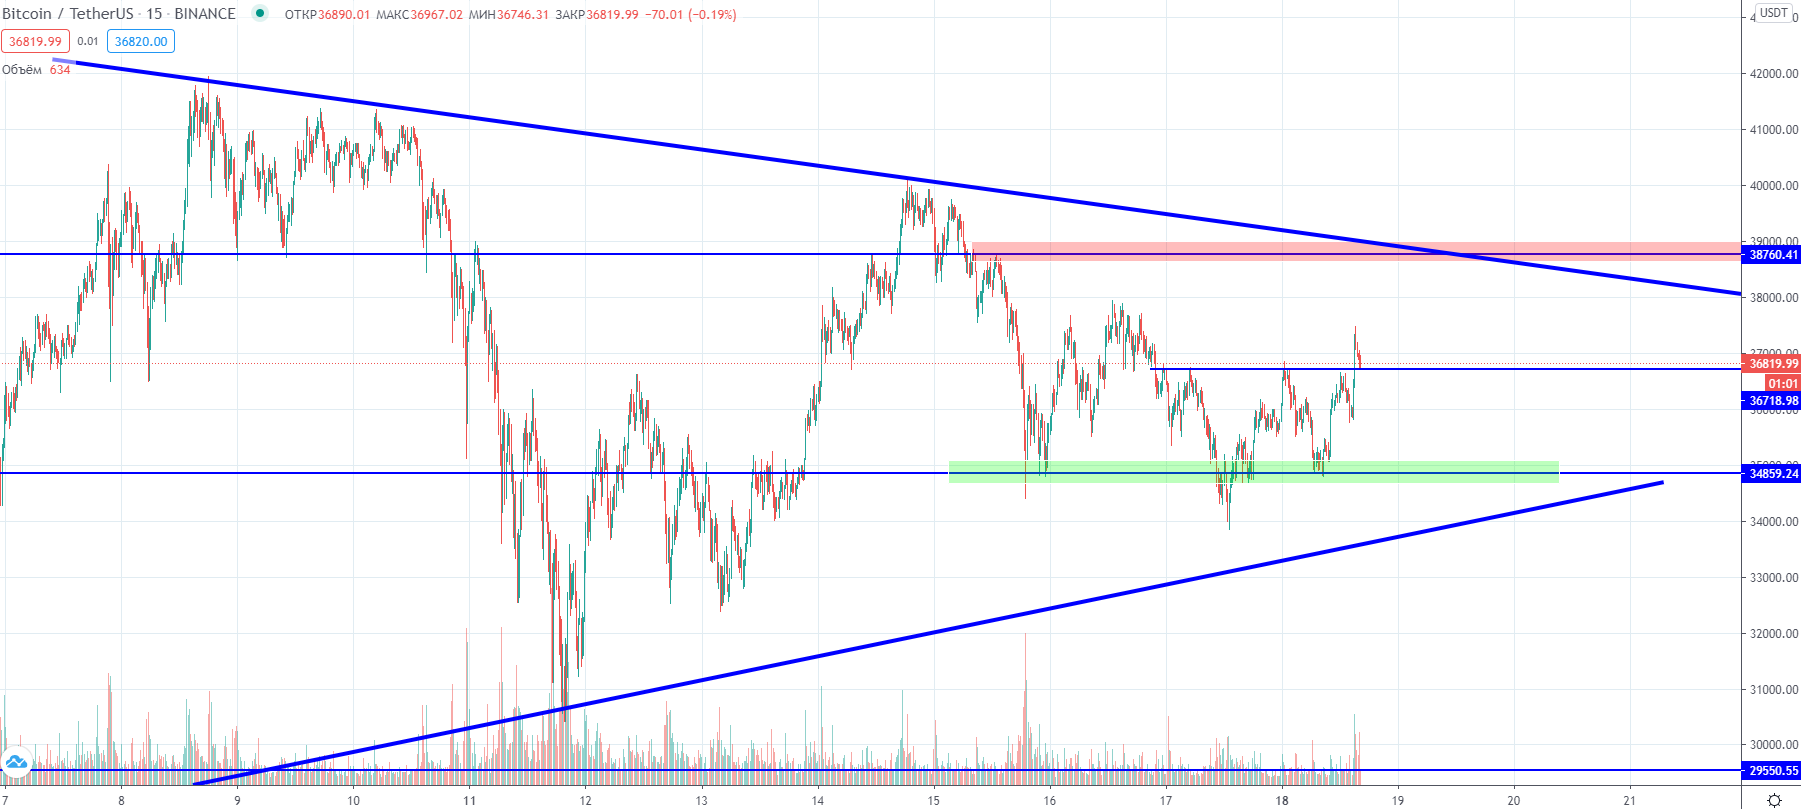
Global triangle on BTC, as well as support (green) and resistance (red) zones. Fifteen-minute BTC/USDT chart on the Binance exchange from TradingView.
Bulls must defend this zone, as a break below may trigger a domino effect — a drop below $34,500 would accelerate as short-term buyers’ stop orders are triggered. A fall below $33,000 would also eject mid-term positions inside the triangle. Under this scenario, long-entry points should not be sought before $29,500.
The resistance is near $38,700 (red on the chart above). This is where the price could touch the upper boundary of the triangle. A breakout above resistance on the first attempt is unlikely — from this zone, short positions could be taken with modest risk controls.
The height of the triangle is about $11,000. This means that on an upside breakout the target would be around $48,500, and on a downside breakout around $22,000.
On a finer time frame, a price channel can be observed and a pullback off its upper boundary. A short-term pullback could reach $35,600, located at the lower boundary of the channel.
Always bear in mind that trendlines are considerably weaker than support/resistance levels. This means one should carefully assess the risk-reward ratio.
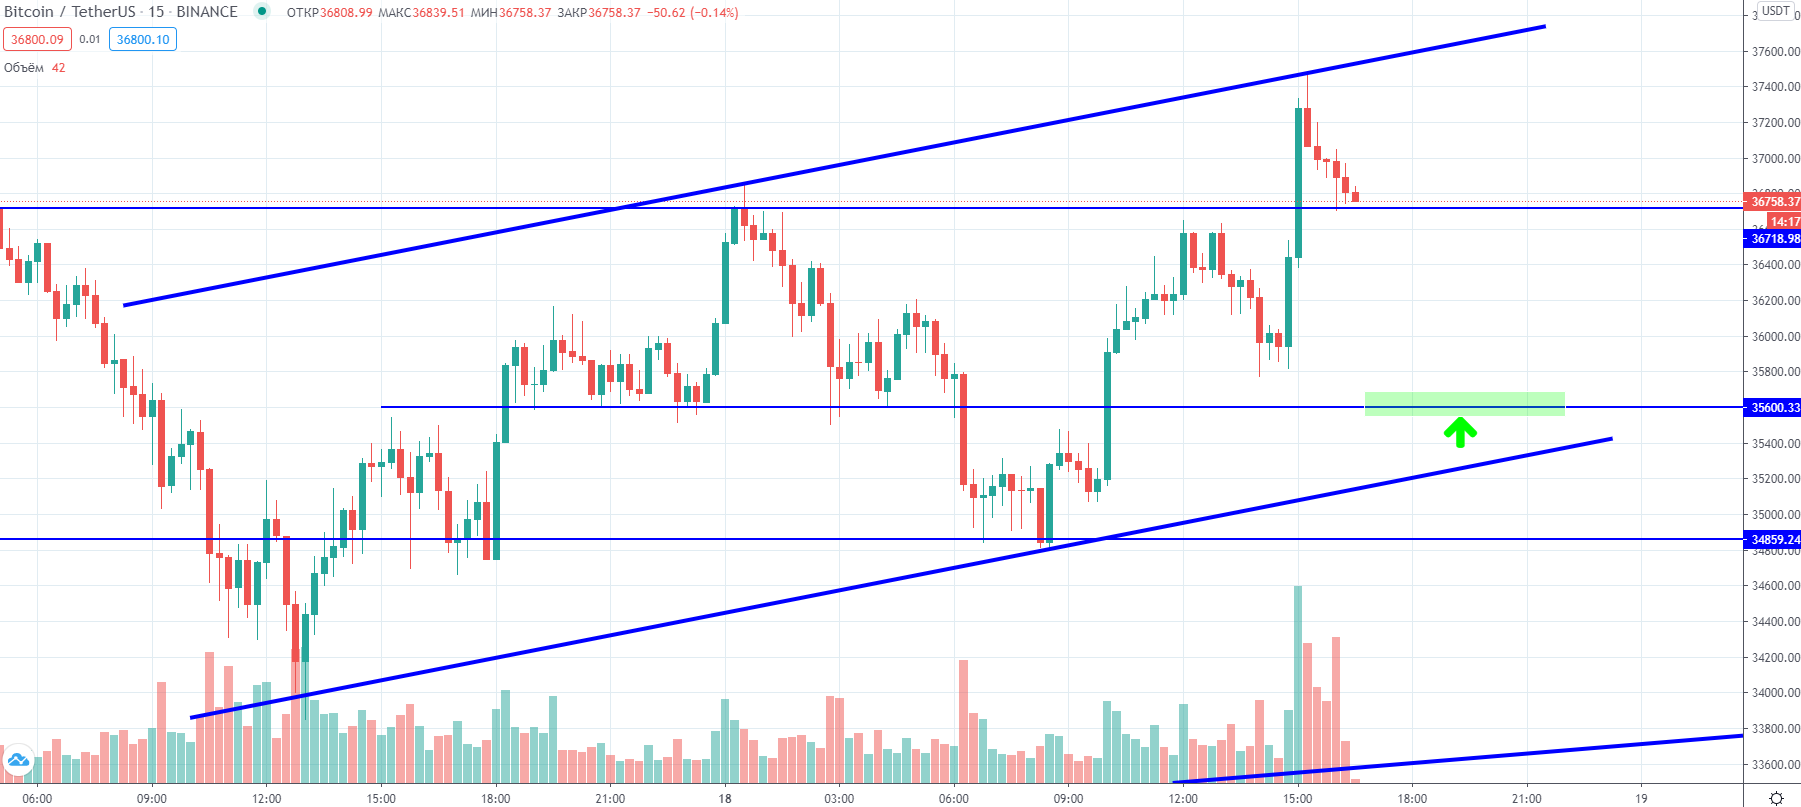
Local ascending price channel. Fifteen-minute BTC/USDT chart on the Binance exchange from TradingView.
Within the broader triangle, Bitcoin is expected to continue losing volatility, and short-term ideas may be most viable. Their advantages include modest risk and quick execution.
Long-term investors should wait for a breakout of the figure, or turn their attention to the altcoin market. There you can find coins that are trading stronger than the market.
Subscribe to ForkLog’s channel on YouTube!
Рассылки ForkLog: держите руку на пульсе биткоин-индустрии!