

Futures analysis: bulls show strength, but bears remain steadfast
The July impulse has returned Bitcoin to May levels; on August 14 the price of the leading cryptocurrency reached a local high of $48,300. Ethereum also hit a fresh high, around $3,340.
Should we expect further upside in the cryptocurrencies? We analyse indicators and price levels for Bitcoin and Ethereum on the Bybit cryptocurrency exchange.
BTCUSD
On the weekly chart BTCUSD impulse rally of Bitcoin stalled at the 61.8% Fibonacci retracement level. A reversal lower from this level would confirm that the four-week rise was a correction within a bearish trend. The bears’ targets under such a scenario lie below the June low of $28,900.
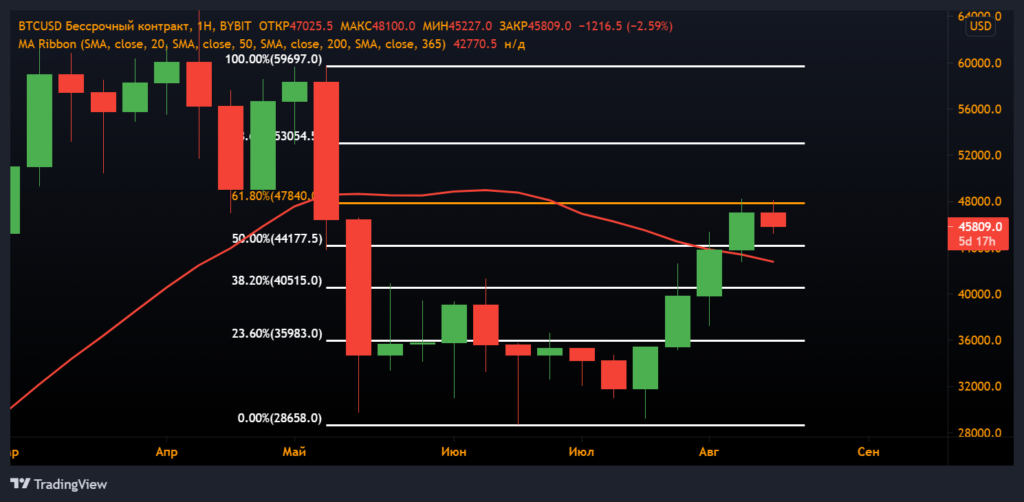
A breakout above the 61.8% level together with a close above the 20-week moving average (the red line) could provide an additional signal for the bulls. This rally is unlikely to be as uncorrected as the previous impulse from $29,500 to $42,300, as Bitcoin price enters a broad distribution zone from $50,000 up to the all-time high at $65,000.
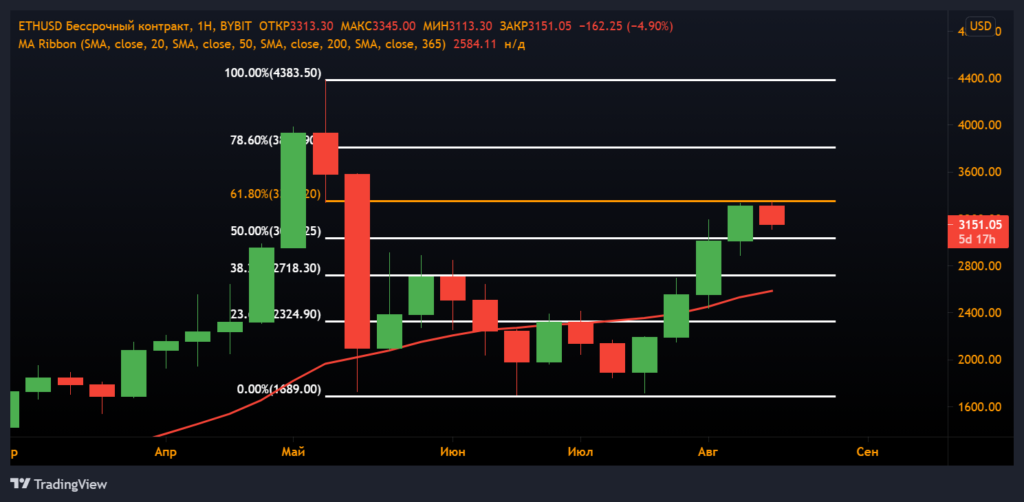
ETHUSD
On the ETHUSD chart the price has also approached the 61.8% level. If it turns down, the bears’ targets lie below the lows of around $1,700.
Conclusions
The market is testing the $48,000 level for a second week. A breakout above could serve as definitive confirmation of the continuation of the bull market. A rejection of this level would only strengthen the downtrend with targets below $29,000 for Bitcoin and $1,700 for Ethereum.
Subscribe to ForkLog news on Twitter!
Рассылки ForkLog: держите руку на пульсе биткоин-индустрии!