

May 2022 in numbers: Terra collapse, Bitcoin’s local bottom, and DeFi liquidity outflows
Key takeaways
- The Terra and UST collapse sparked a protracted market correction.
- The Fear and Greed Index hovered at extreme lows.
- There were signs of capitulation among Bitcoin holders.
- Total value locked in the DeFi sector fell by 43%.
- Liquidity inflows into Ethereum layer-2 solutions increased.
- Market capitalization of stablecoins fell to $157 billion.
Movements in leading assets
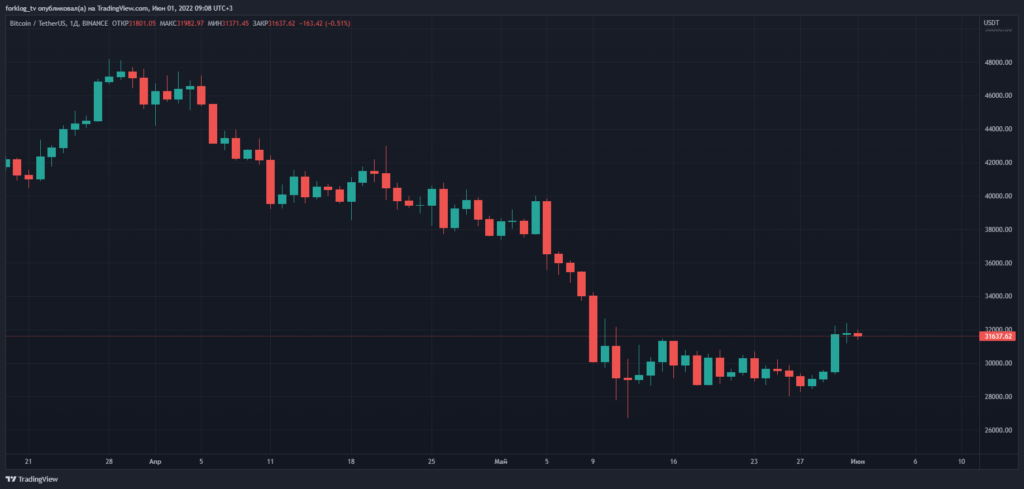
- Bitcoin failed to sustain above $40,000 and continued its correction. On May 12 it reached a December 2020 low of $26,700.
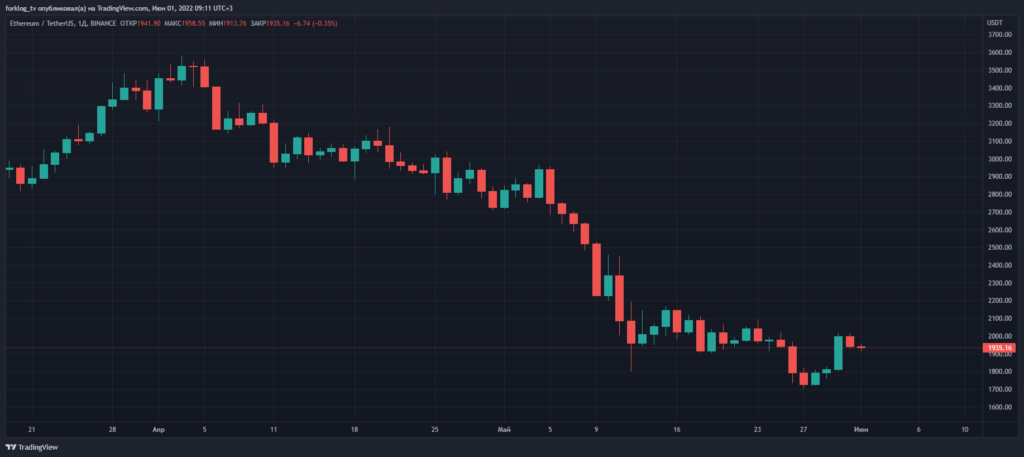
- Earlier in the month Ethereum again tested the $3,000 level but could not hold above it. On May 27 the cryptocurrency hit a local low near $1,700; such a price level last occurred in July 2021.
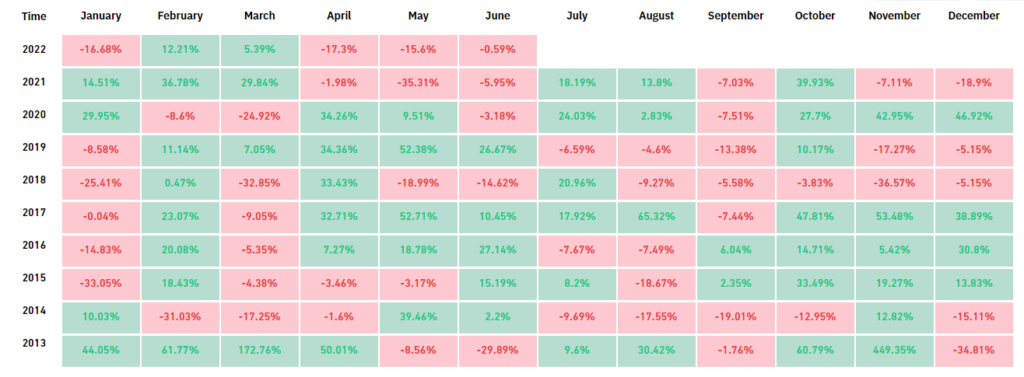
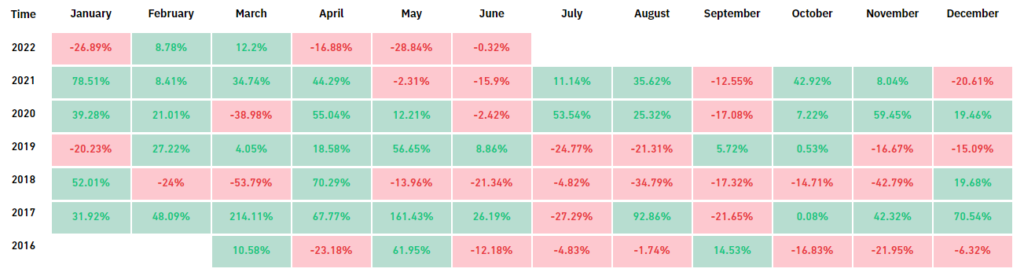
- For the month, Bitcoin fell 15.6% and Ethereum lost 28.8%.
- As usual, Bitcoin pulled down most digital assets, resulting in a market cap decline of 22% to $1.3 trillion.
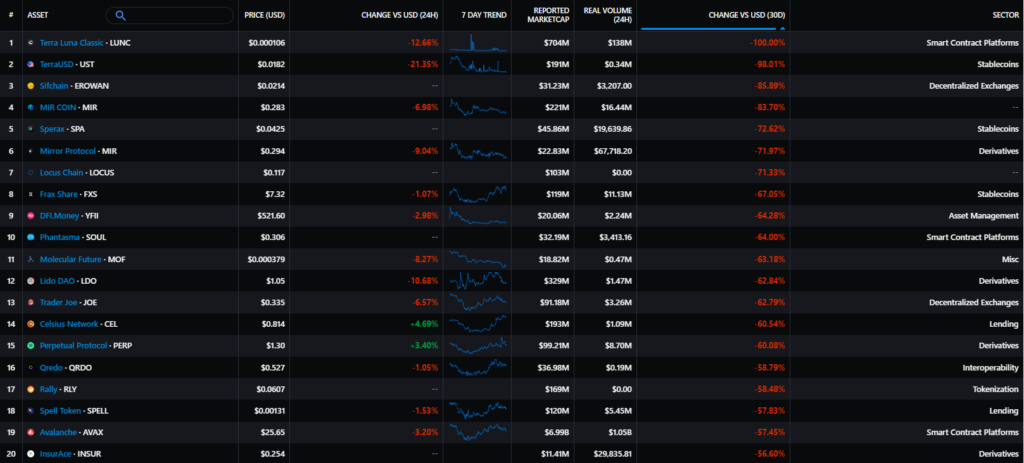
- The market-wide correction was driven by the Terra ecosystem collapse and the LUNA token’s crash (down 98% and LUNA’s token down 100%). On May 8 UST briefly lost its peg to the US dollar, and on May 13 it collapsed to $0.05. The events unfolded against a backdrop of abnormal LUNA issuance (6.9 trillion tokens), used to back the UST. Major exchanges delisted LUNA, and validators temporarily paused the network to guard against potential attacks. The Luna Foundation Guard’s purchases of 80,394 BTC were used to stabilise the price, but selling them added further pressure on the market.
- At the end of the month Terraform Labs founder Do Kwon proposed rebooting the project and creating a new chain. The community approved the plan — old tokens became Terra Classic (LUNC) and TerraClassicUSD (USTC), and the new Terra 2.0 — the old ticker LUNA, followed by listings on exchanges. On May 31 rumours circulated that Kwon was working on a new stablecoin, but there was no confirmation.
- Among the laggards of the month were tokens built on Terra’s Mirror Protocol (MIR), Frax Share (FXS), used to back the algorithmic stablecoin FRAX, and Celsius Network (CEL). Avalanche (AVAX) and the Trader Joe DEX built on its stack also faced a pronounced hit.
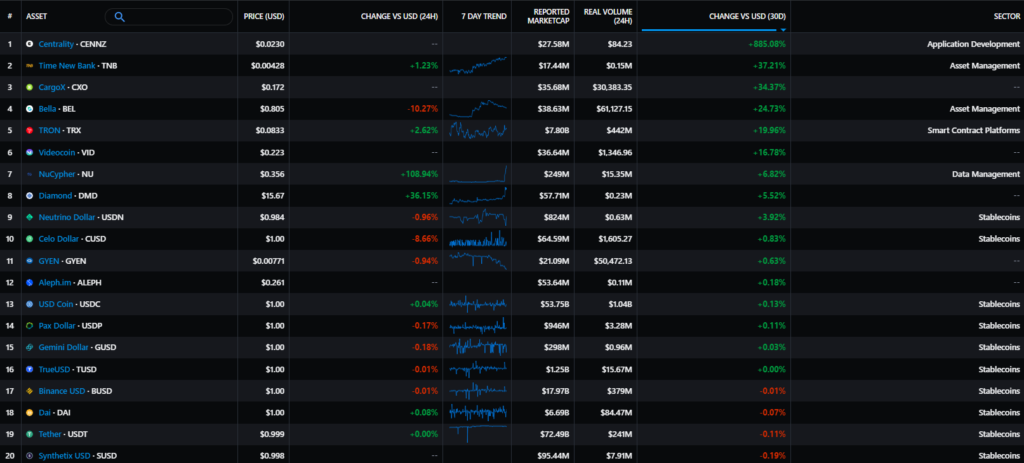
- Overall, most major projects showed negative dynamics amid Bitcoin’s correction, though Tron stood out. The TRX token rose about 22% for the month after the launch of the algorithmic stablecoin USDD with a 30% yield, a surprising move given Terra’s collapse.
Equities of crypto-related companies
Dynamics of mining company equities
Canaan (CAN):
-2.09%
Ebang International (EBON):
-13.98%
Riot Blockchain (RIOT):
-28.74%
Hut 8 (HUT):
-28.37%
Marathon Digital (MARA):
-34.25%
Macro backdrop
- The traditional financial market is poised for further rate hikes by the Fed, with expectations of 50 basis points in June and July. Futures on CME imply a 96.8% probability for June and 94.2% for July.
- The Fed could reassess the trajectory of the policy rate if inflation slows and equities slump sharply. Owing to lockdowns in China, higher energy and food prices, one can’t rely on bottom-line expectations. In particular, in the eurozone and the United Kingdom, analysts underestimated the inflation acceleration.
- After April’s negative momentum on Wall Street, investor sentiment stabilised. But Bitcoin registered a record nine-week streak of declines as correlations with stock indicators weakened.
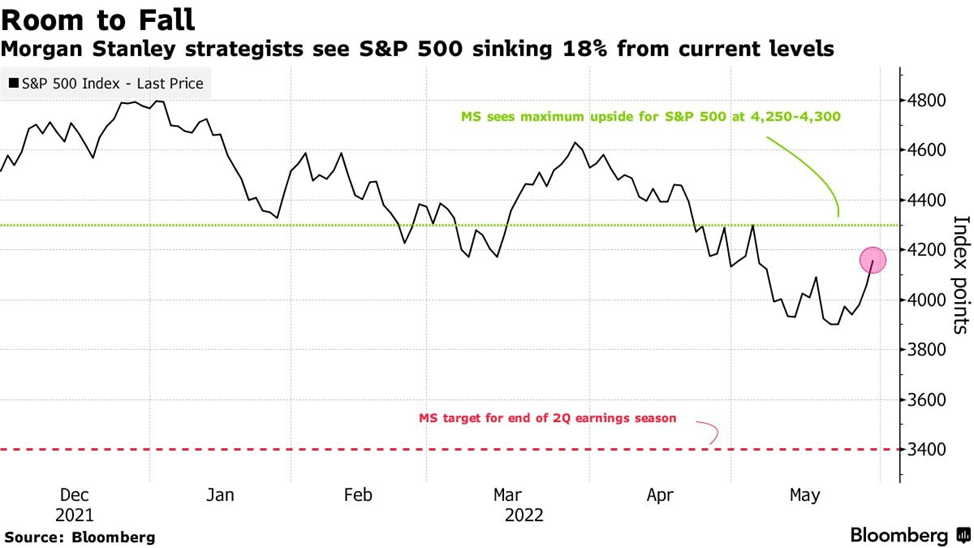
- Morgan Stanley experts questioned the ability of the stock market to resume a bounce in the coming weeks. They project a drop in the S&P 500 to 3400 points over the next three months (a -17.8% from the May 31 close). A deterioration in profit forecasts for Q2 could be a driver.
- Analysts at Glassnode urged watching Wall Street’s reaction to the Fed meeting and the degree of correlation between the crypto market and equities. The recent capitulation of part of the holders and accumulation by whales created a certain buffer against a broader downturn.
Market mood, correlations and volatility
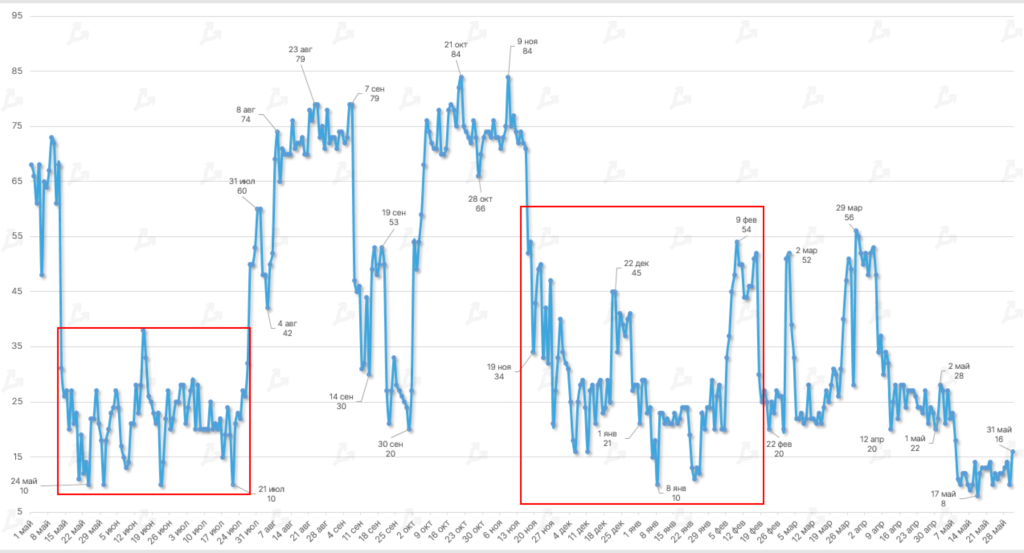
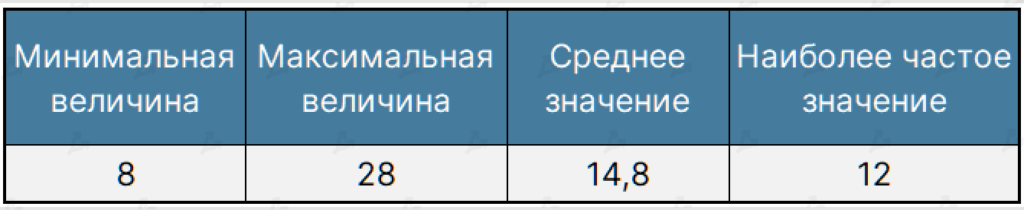
- May was characterised by predominantly bearish sentiment. The Fear & Greed Index stayed in the “extreme fear” zone for the month, hitting 8 on May 17. The last time it reached such a level was in March 2020.
- Historically, a drop to record lows in the indicator has signalled a market reversal. A similar pattern occurred in July 2021, ahead of Bitcoin’s rally, and in January 2022 when the first crypto correction began.
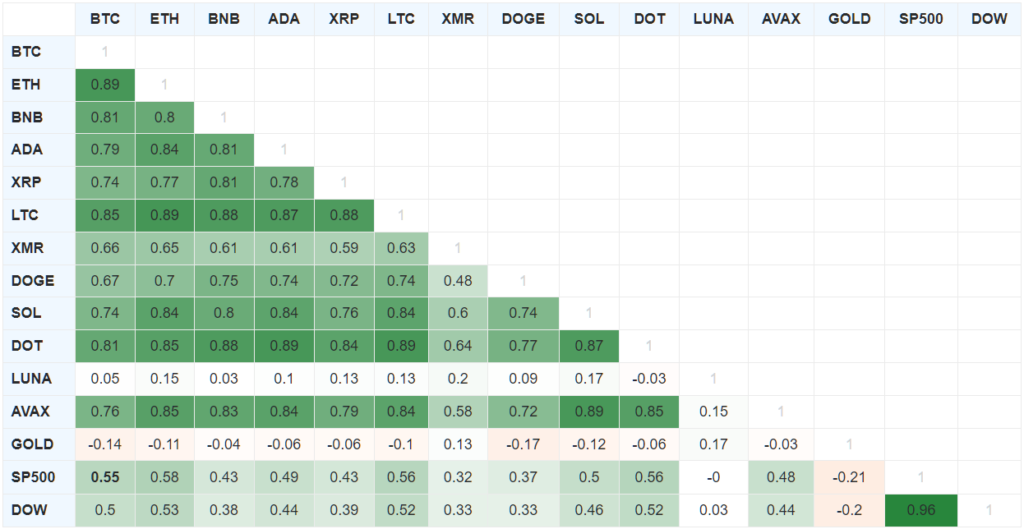
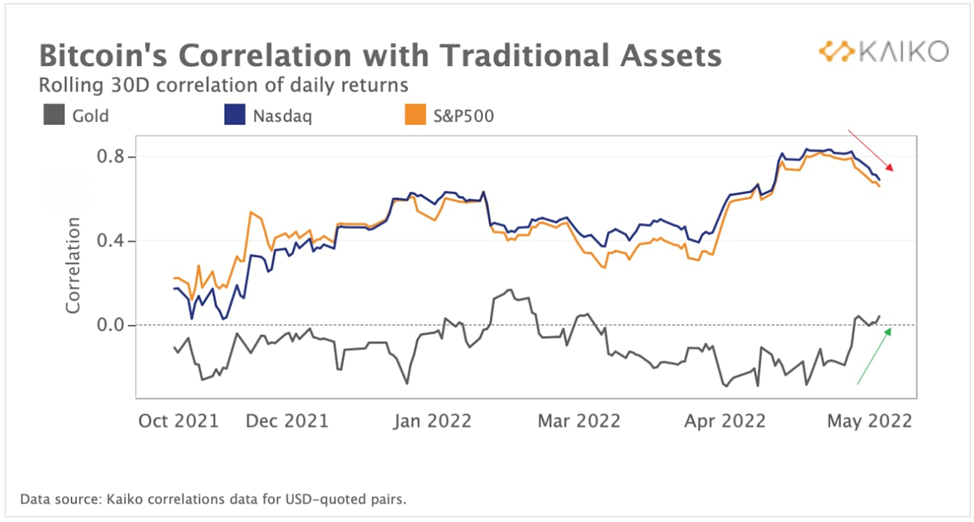
- Compared with April, May’s Bitcoin correlation with the US stock market (smoothed 90-day average) strengthened. The correlation with the S&P 500 stood at 0.55 and with the Dow at 0.5. In April the values were 0.52 and 0.44 respectively.
- By mid‑May, Bitcoin’s correlation with traditional equities reached a peak above 0.91, coinciding with a record drop in stock indices.
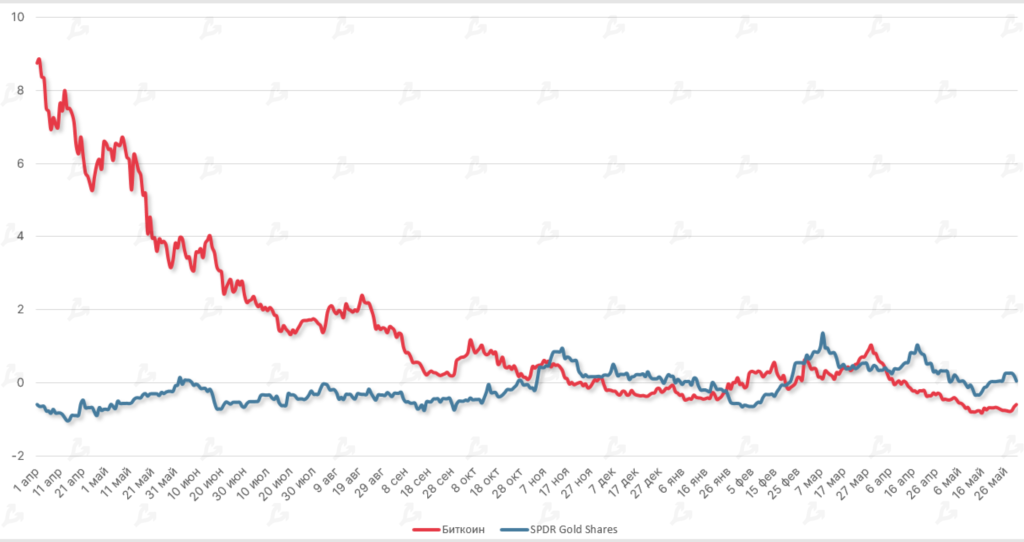
- Bitcoin and gold prices continued to move in opposite directions. Relative to last month, this trend moderated (−0.14 vs −0.18 in April).

- In May, the average historical volatility of Bitcoin price stood at 3.58%. The indicator spiked in the middle of the month as prices carved out a local bottom below $27,000.
- Historically, volatility rises with a change in market trend.
- The dynamics of the Sharpe Ratio (using two-year US Treasuries as risk-free) signal a relatively higher risk for Bitcoin investment. Since April, the metric lags gold ETFs.
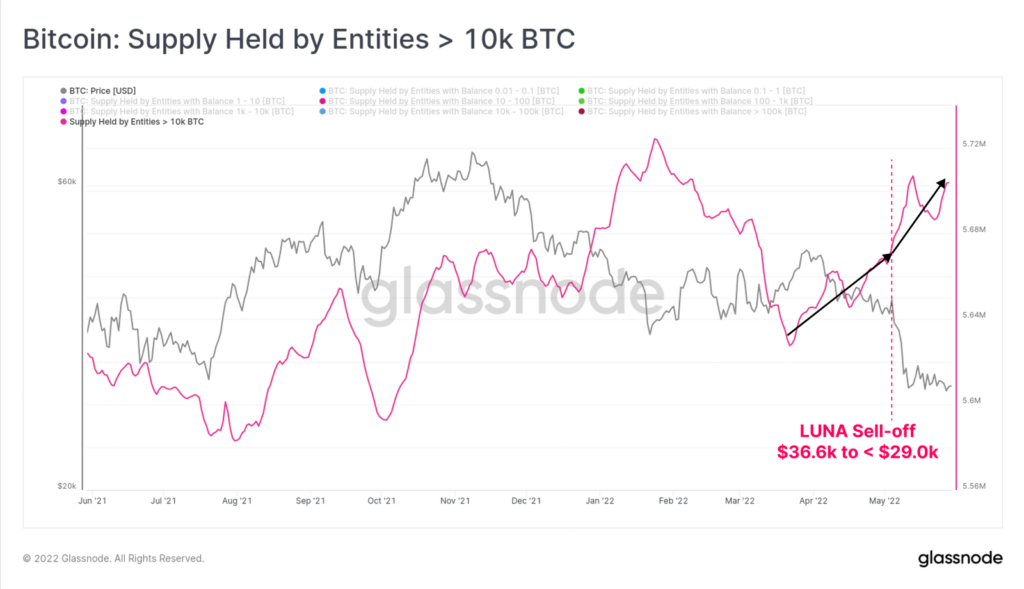
- Against the Terra crash, a substantial part of sold reserves — 80,081 BTC — moved to wallets with balances from 10 BTC to 100 BTC.
- Whales with more than 10,000 BTC also showed significant activity; in May they acquired 46,269 BTC, including a portion of the LFG reserves sold.
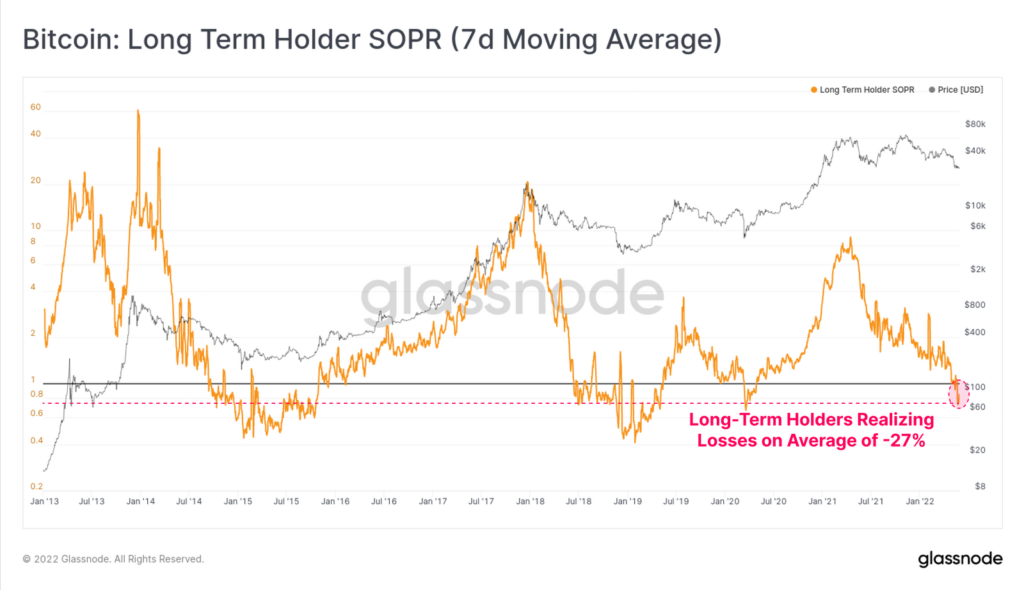
- First signs since the summer of 2020 of capitulation by long-term holders of digital gold — last week the LTH-SOPR indicator reached -27%.
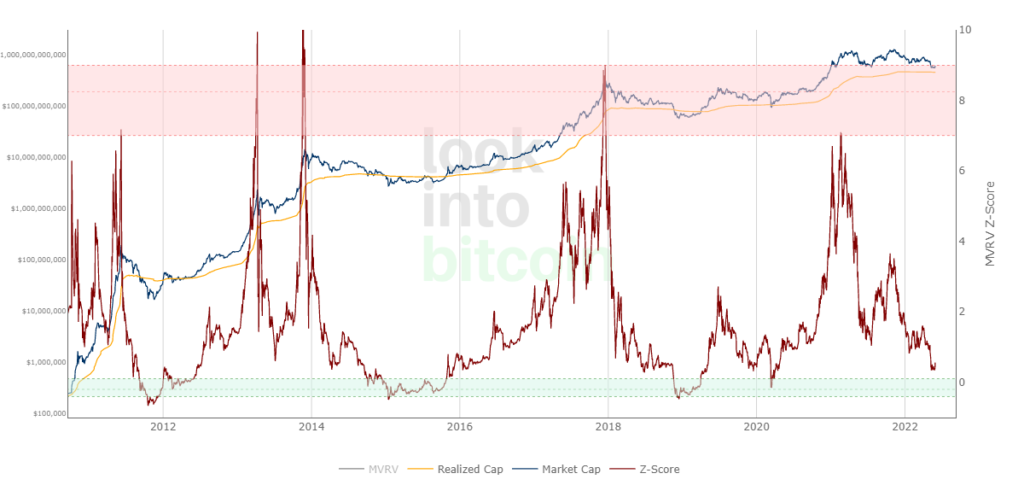
- The MVRV Z-Score indicator does not yet give a reliable buy signal, though it is close to the green oversold zone. This suggests that price recovery around late May–early June could be only a correction rather than a rally ahead of the main trend.
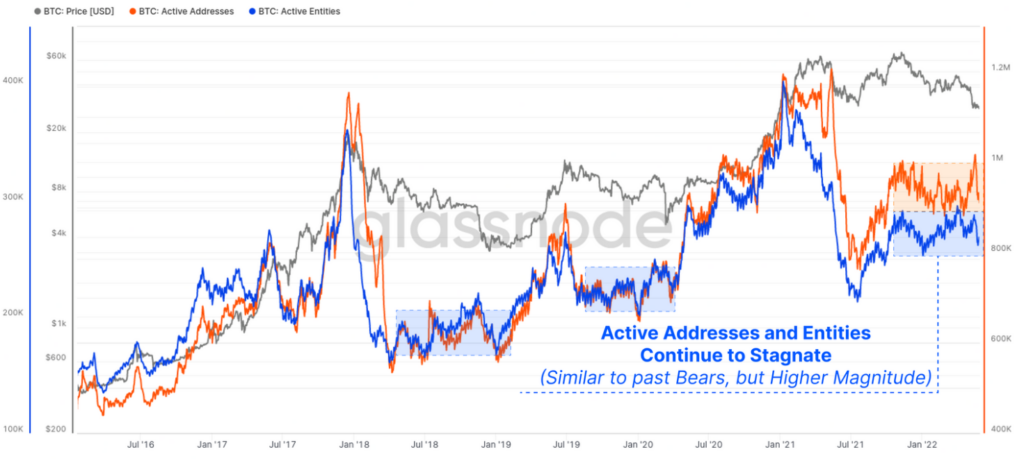
- There is no positive momentum in active Bitcoin addresses and their clusters — price action remains sideways, signalling weak new-user inflows and subdued on-chain activity.
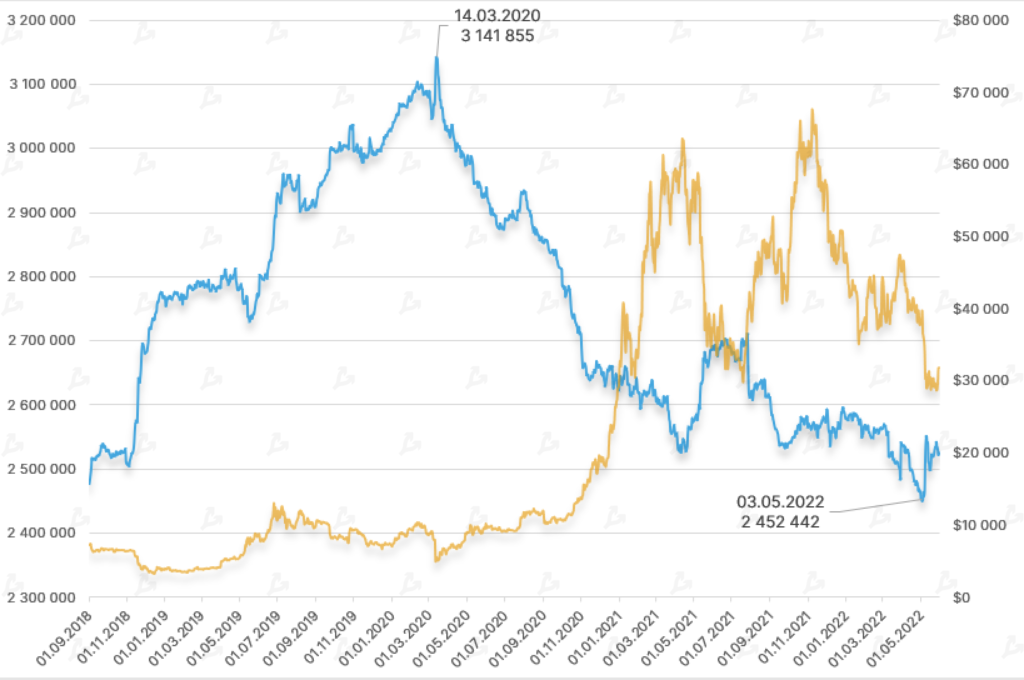
- Bitcoin Supply on centralized exchanges declined to 2.48 million coins, a level seen in September 2018. Outflows to non-custodial wallets could point to a growing appeal of long-hold investment strategies. This is also a positive factor for Bitcoin’s price, reducing the risk of near-term selling pressure.
Ethereum
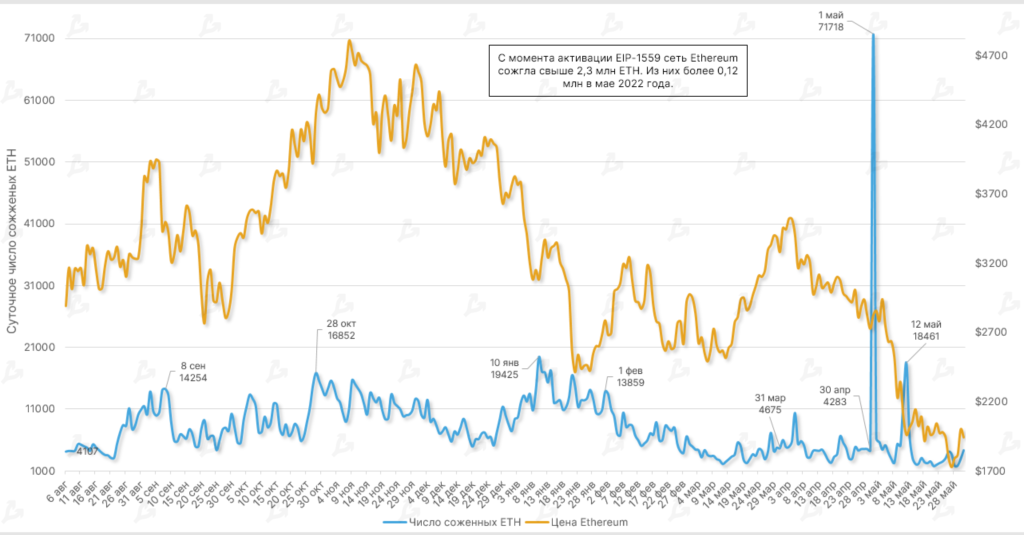
- Since the EIP-1559 launch in August 2021, more than 2.3 million ETH have been taken out of circulation. Of these, over 120,000 were burned by the protocol in May 2022.
- On May 1 a Metaverse launch, Otherside from Yaga Labs, took place. In the backdrop of NFT sales, the network burned a record amount of ETH — more than 71,700 tokens.
- Another spike occurred on May 12 when Ethereum prices briefly tested $1,800.
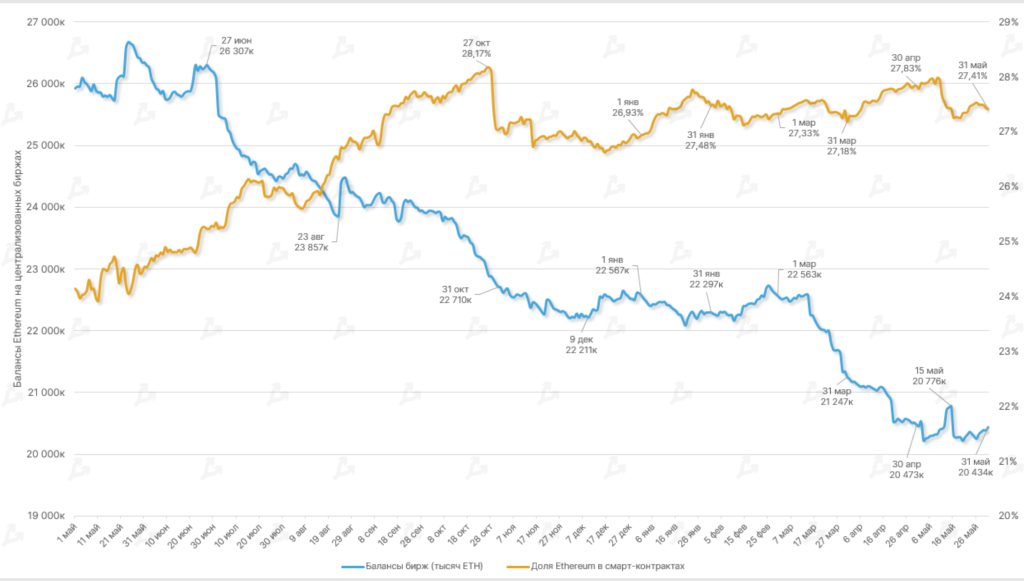
- Into mid‑May there was a rebound in Ethereum balances on centralized exchanges, which halted once the price hit a local bottom. For May, overall ETH supply declined slightly.
- The share of ETH locked in smart contracts and decentralized apps remained high. As of May 31, the share stood at 27.41% (27.83% in April).
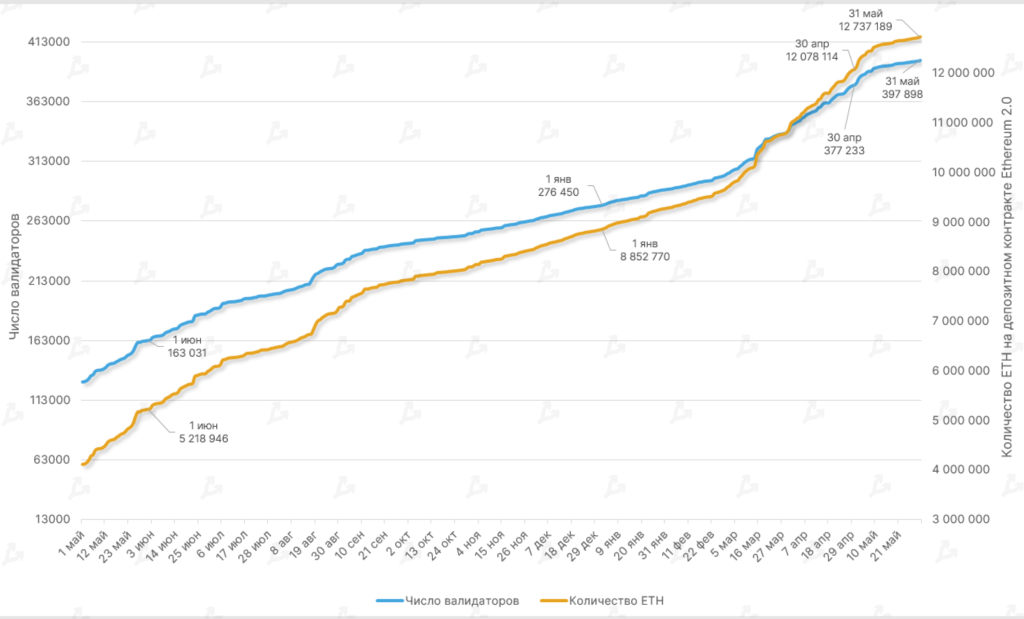
- As of May, the number of ETH on the Ethereum 2.0 deposit contract surpassed 12.7 million. The figure rose by 5.4% in the month (April had a near 10% increase).
- The Beacon Chain’s validator count exceeded 397,000. The number of participants interacting with Ethereum 2.0 grew by 5.4% in the month.
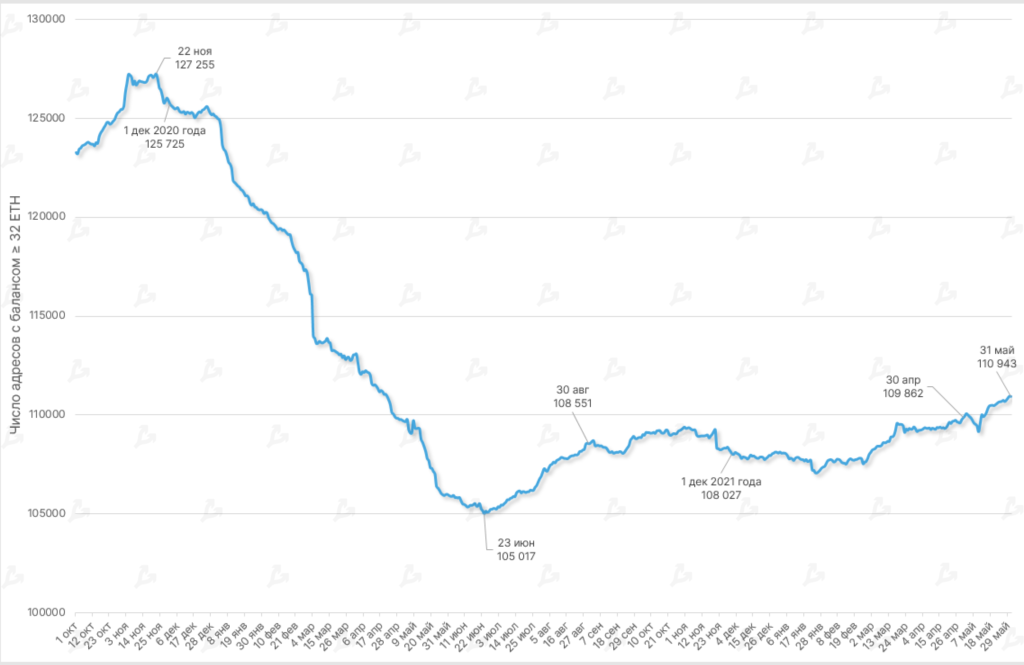
- The number of addresses with balance ≥ 32 ETH continues to rise. As of May 31, it reached 110,943.
Lightning Network
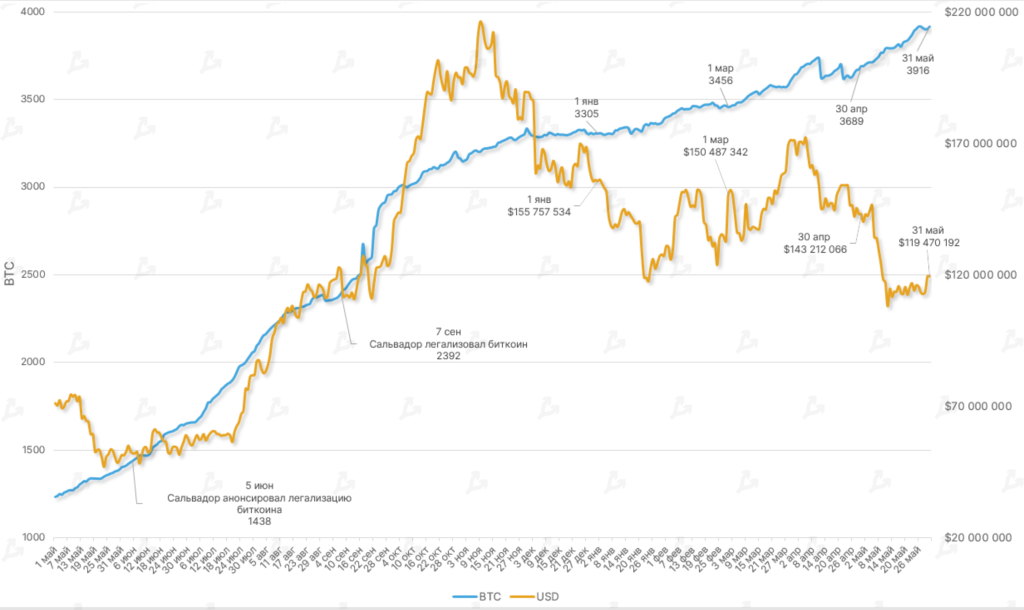
- In May, the Lightning Network’s capacity for micro-payments continued to grow, reaching 3,916 BTC (3,689 BTC at end-April).
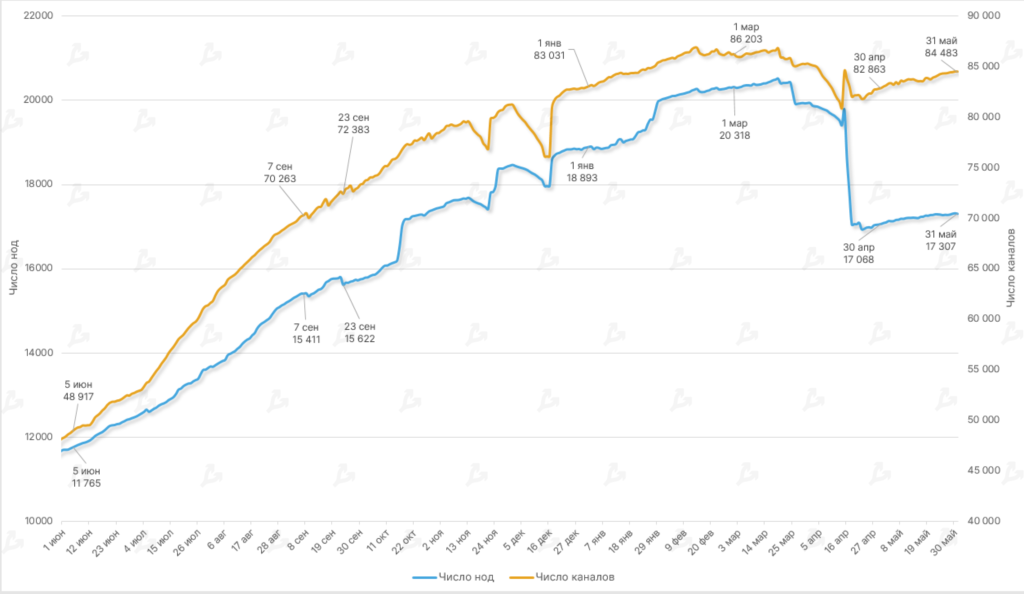
- After a sharp drop in nodes and channels in April, both metrics rebounded — the first rose 1.4% and the second nearly 2%.
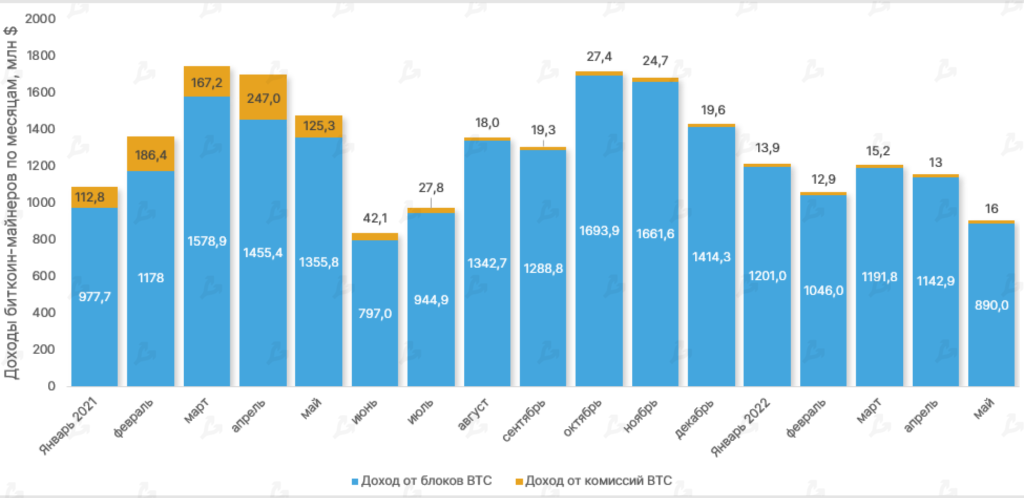
Mining, hash rate, fees
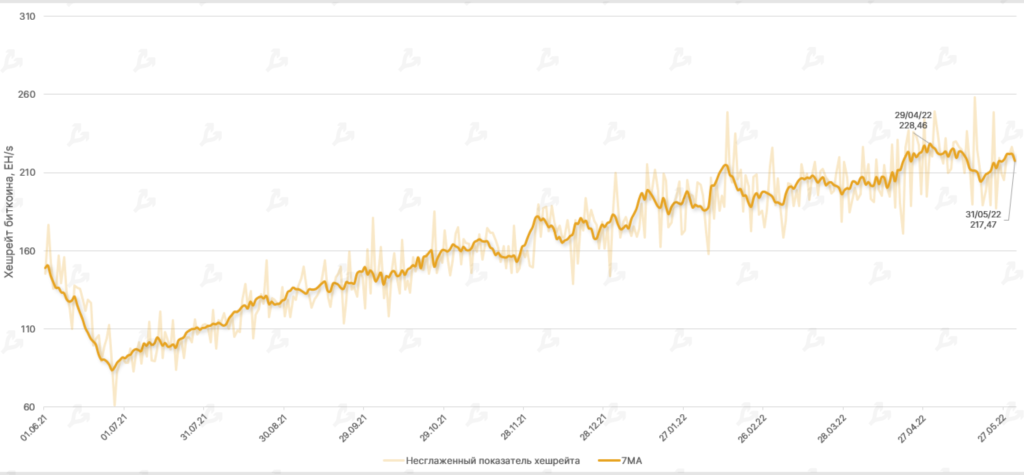
- The smoothed 7-day moving average of Bitcoin’s hash rate fell by 4.8%. Some of the less efficient miners likely exited as the price of digital gold declined.
- The trend of diminishing Bitcoin mining profitability has been evident since last autumn. In May, Antminer S9 devices operated at breakeven or slightly above.
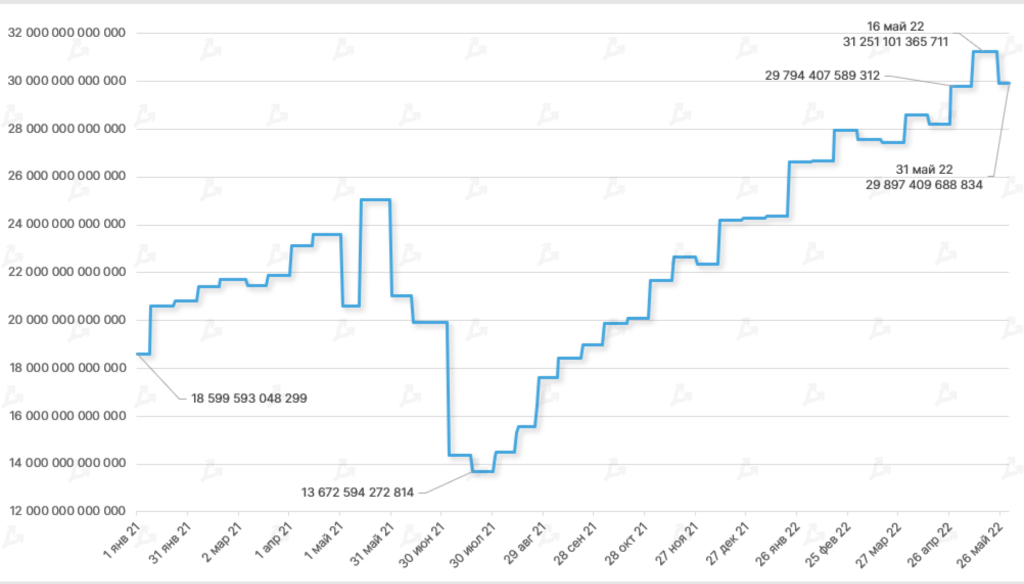
- Mining difficulty in mid‑May reached a peak of 31.25 T; following the fall in hash rate, the metric retraced to 29.9 T — the largest drop since July 2021.
- The distribution of hash power among mining pools hardly changed — Foundry USA (20.9%), followed by F2Pool (14.3%) and AntPool (14.2%).
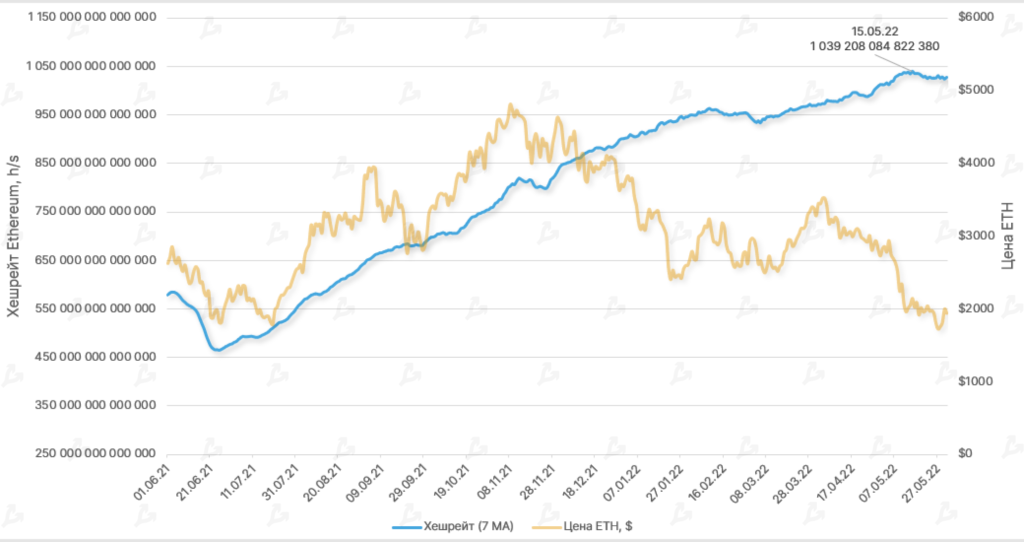
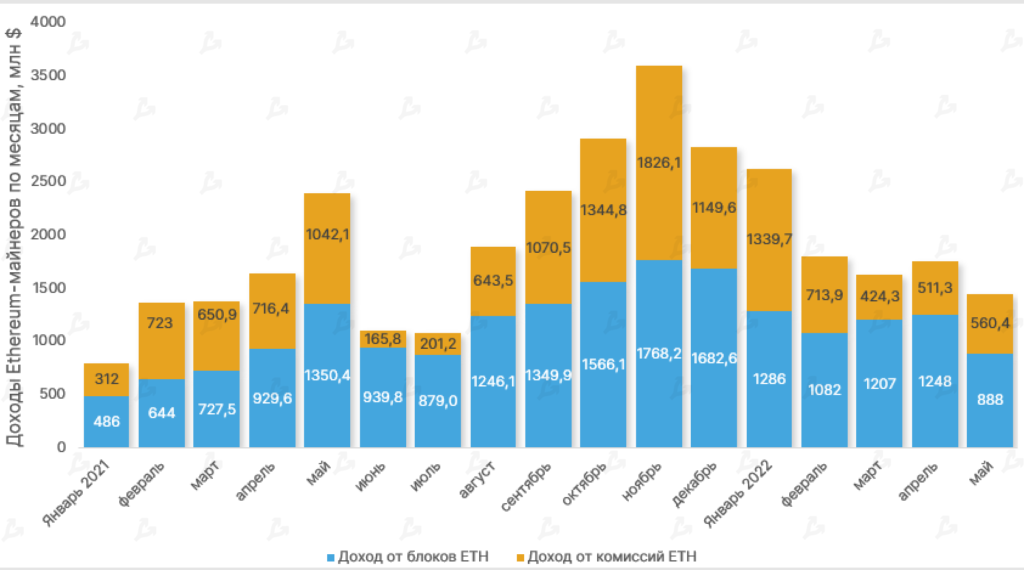
- In mid‑May, Ethereum’s hash rate reached an all-time high of 1039 TH/s. The rise in the metric despite price declines points to waning profitability for miners of the second-largest crypto.
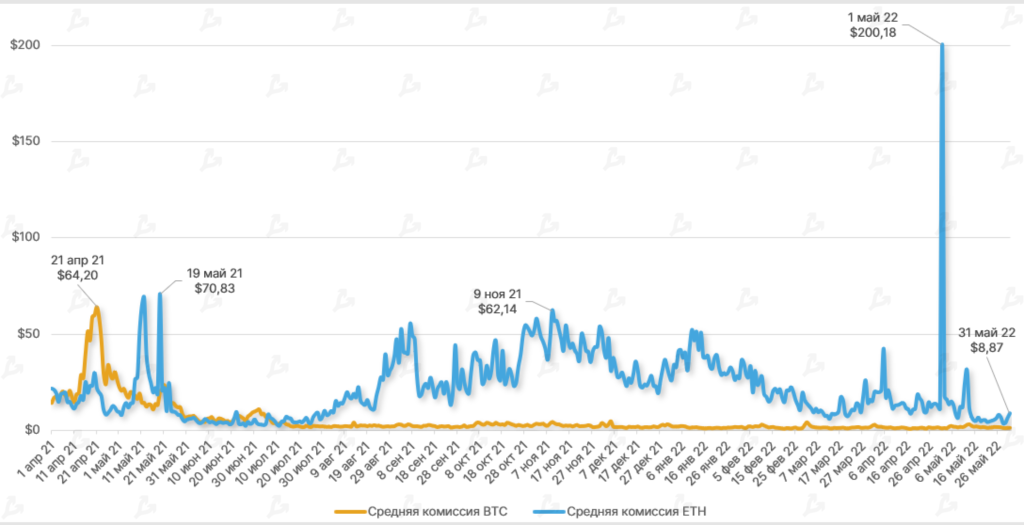
- On May 1 the average Ethereum transaction fee surged to about $200, a new record. This followed the Otherside metaverse launch by Yuga Labs, whose NFT tokens were snapped up in under three hours. Miner earnings from fees in the first day of May reached a record $231 million, according to Glassnode.
- By late May, Ethereum transaction fees dropped back to July 2021 levels. The decline is attributed to softer DeFi activity and ETH price weakness.
- Bitcoin transaction fees in May remained broadly in the $1.3–$3.4 range, aided by SegWit, Lightning Network, Taproot, and relatively low on-chain activity.
Found a mistake? Select it and press CTRL+ENTER
Рассылки ForkLog: держите руку на пульсе биткоин-индустрии!
Related
We use cookies to improve the quality of our service.
By using this website, you agree to the Privacy policy.