


On January 14 bitcoin topped $96,000, its highest since November. After a week of sideways trade, the coin joined a rally in risk assets and precious metals.


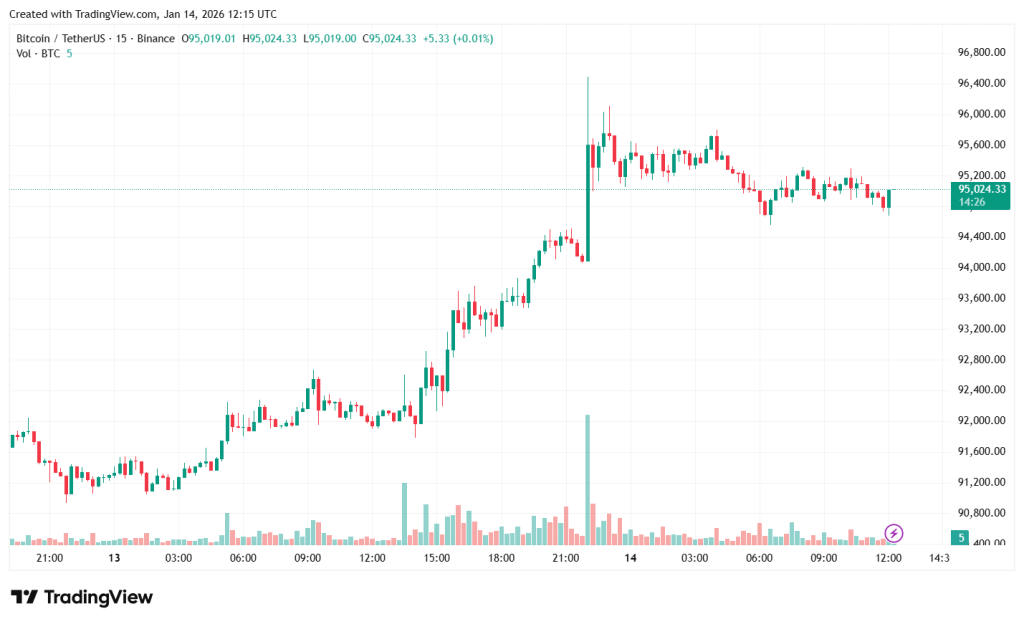
At the time of writing, the asset trades at $95,024 (+3.4% over 24 hours).
In a comment to ForkLog, Max Gnatyshyn, head of operations for Toobit in the CIS, noted that January began for bitcoin and Ethereum with “bullish volatility”. The main driver was demand for spot ETFs.
According to him, bitcoin is more tightly linked to macroeconomic conditions and ETF flows. Ethereum’s dynamics depend more on internal factors: technical upgrades and activity in DeFi and L2.
Gnatyshyn advised watching US monetary policy and regulatory changes — these factors determine the inflow of institutional capital.
“Whether Ethereum can overtake bitcoin in 2026 depends on second-layer adoption, the dynamics of staking and the fee-burning mechanics,” the expert added.
Analysts at QCP Capital noted that bitcoin had long lagged gold and equities. The break above $95,000 flipped the script — that barrier had capped prices since November.
In their view, the current price already discounts the main macro risks: from events in Venezuela and Iran to tariff policy in the US. QCP allowed for a shift of capital into digital assets amid the debasement of fiat currencies.
“In the absence of new unknowns, any dips should be viewed as a buying opportunity,” the firm’s note said.
Charles Edwards, founder of Capriole Investments, pointed to a key technical signal — a daily close above the 2025 open ($93,500). This happened for the first time since January 6.
Strong Bitcoin move! Bitcoin just has its first promising technical move in a while. Closed the daily above $93.5K. Opens up good odds of trend to $108K from here. Also need to see this weekly close above $93.5K to confirm the downside fakeout (bullish). Now would be a great time… pic.twitter.com/l6XIkjaZue
— Charles Edwards (@caprioleio) January 14, 2026
“This opens up good odds of a move to $108,000. To confirm a bullish reversal, a weekly close above $93,500 is needed,” Edwards wrote.
A trader known as Jelle also recorded a breakout from a descending triangle that had been forming since mid-November.
Major $BTC ascending triangle breakout 📈👇 pic.twitter.com/KBIDXJnCie
— Jelle (@CryptoJelleNL) January 14, 2026
Some analysts remain cautious, however. A trader nicknamed Roman called the current action “textbook bearish” because price is rising on falling volume.
$BTC 1W
This is text book bearish price action: volume going up — price going down followed by volume going down — price going up/sideways.
Maybe we retest 100k area but this is nothing to get excited about.
Next time large volume comes in, it’ll likely be a move lower. pic.twitter.com/HGADBWsmW5
— Roman (@Roman_Trading) January 13, 2026
He expects a drop towards $76,000, though he allows for a retest of the $100,000 area.
An analyst known as CrypNuevo warned of stiff resistance at the 50-week exponential moving average around $97,650.
$BTC update:
We’ve been able to successfully project the exact Price Action for the last 7 days.
Now, I call for caution. This could be a liquidity run towards the 1W50EMA where price could be rejected from.
Breaking above $100k (4% higher) is my invalidation to this idea. pic.twitter.com/kZupjrjAKS
— CrypNuevo 🔨 (@CrypNuevo) January 13, 2026
He sees the current rise as a “liquidity run” before a pullback. Only a sustained move above $100,000 would invalidate the bearish scenario.
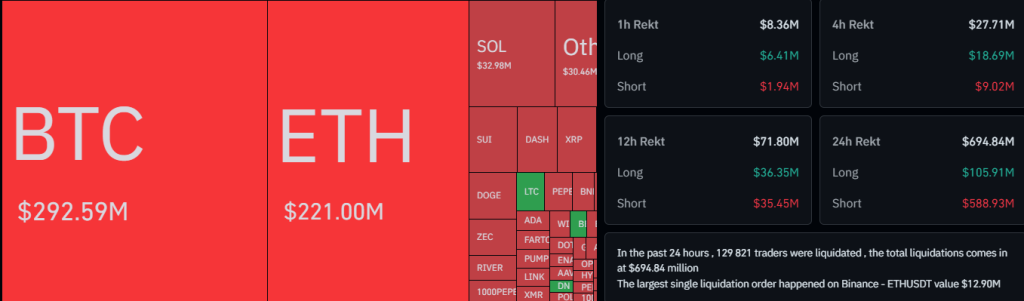
Short sellers’ losses
The rise sparked a wave of liquidations in derivatives. Over the past 24 hours, traders lost $588.93m on forced closures of short positions. Of that, $292.59m came from bitcoin.


Kronos Research’s chief investment officer, Vincent Liu, characterised the move as “a sharp short squeeze”. Institutions also added to the optimism: on January 13, net inflows into US spot bitcoin ETFs totalled $753.73m, the highest since early October.
Justin d’Anethan, head of research at Arctic Digital, linked the move to a rotation into “hard assets”. With inflation easing and legal pressure on the the Fed from the US Department of Justice, investors are seeking alternatives to the dollar.
The technical picture has also improved. Tony Sycamore, an analyst at IG Australia, reckons that holding above $95,000 opens the way to $100,000. The next target is the 200-day moving average at $106,115.
Joshua Lim, co-head at FalconX, says the macro backdrop remains favourable for digital assets.
Rising bitcoin reserves
Over the past six months, the amount of bitcoin on the balance sheets of public and private companies has risen from 854,000 BTC to 1.11m BTC, according to Glassnode.
Over the past 6 months, Bitcoin treasuries held by public and private companies have grown from ~854K BTC to ~1.11M BTC.
That’s an increase of ~260K BTC, or roughly ~43K BTC per month, highlighting the steady expansion of corporate balance-sheet exposure to Bitcoin.… https://t.co/hHXjcSDDj4 pic.twitter.com/oluVGO2bGD— glassnode (@glassnode) January 13, 2026
The cumulative increase came to about 260,000 BTC. Average monthly purchases reached 43,000 BTC — evidence of steady corporate interest in digital assets.
Analysts also commented on price consolidation between $80,000 and $95,000. According to the metric Short-Term Holder Cost Basis Distribution, a high concentration of positions has formed in this zone.
Attempts to rise are capped by selling from recent entrants. That has kept prices in check despite renewed demand above $80,000.
For the first time since mid-2022, the 52-week correlation between bitcoin and gold fell to zero.