


The market overview is provided by Nanny Ventures analyst Maxim Lenets.
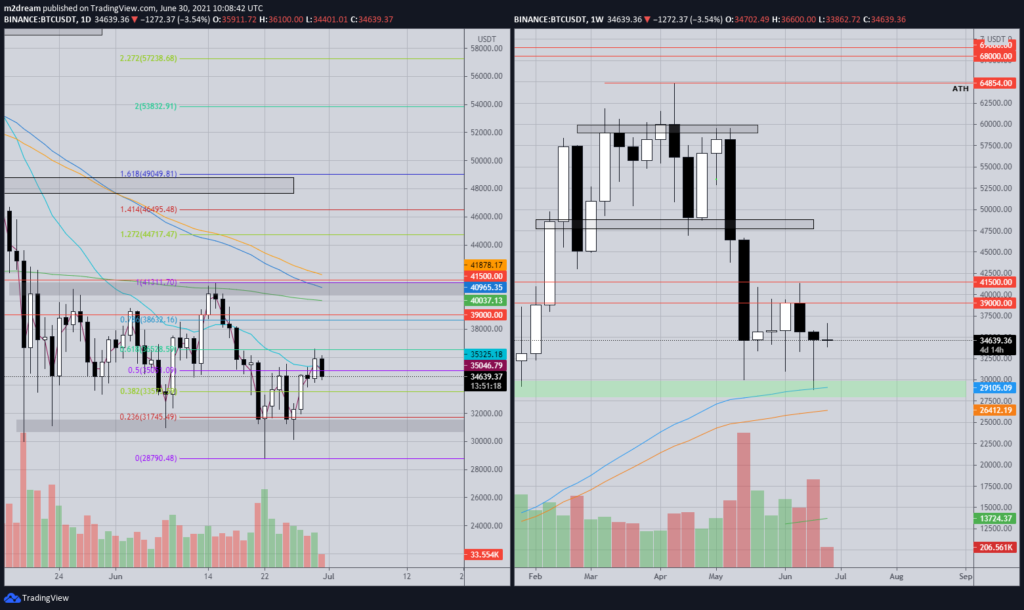
Last week, Bitcoin price posted a new local low at $28,805. However, the weekly BTC/USDT candle closed as a pin bar at $34,700, despite miners being shut down in China, signaling positive momentum.
If you extend the Fibonacci retracement from the previous test of the upper boundary of the range at $41,330 to the local low, on June 29 the price tested the 0.618 level ($36,500) several times, but buyers could not sustain a move above.
If they manage to hold Bitcoin above $36,500, the next resistance zone will be the $39,000-$40,000 range. The market shows a positive mood, but a high level of fear persists. It is difficult to talk about medium-term buys until price holds above the $40,000-$41,000 level.


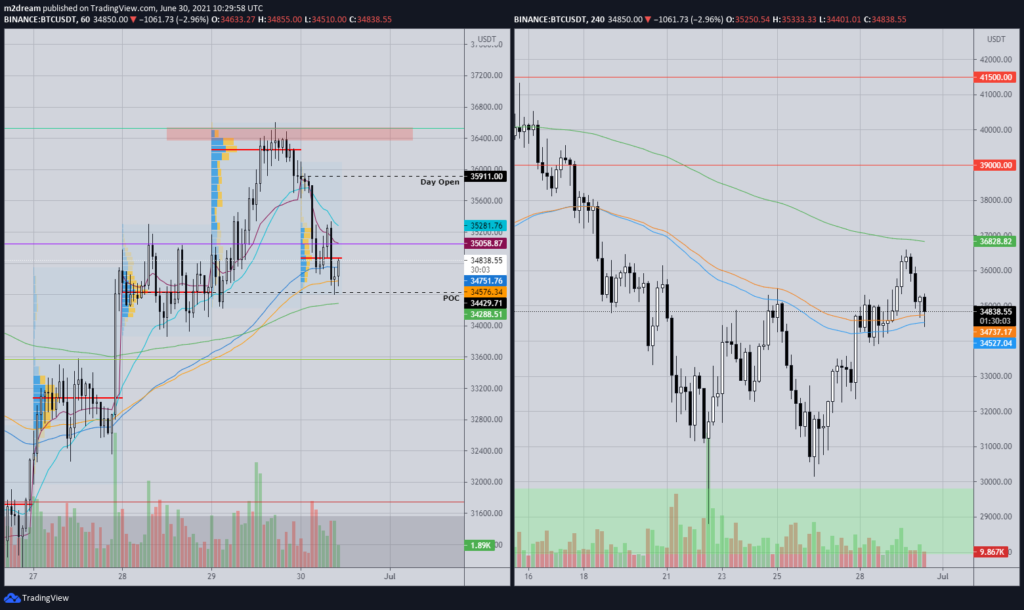
The local upward structure remains. On the 4-hour chart, Bitcoin trades above the EMA-72/89. Ideally, the candle should close above $34,900-$35,000 to move higher toward a retest of the daily open.
The EMA-200 sits in the $36,900-$36,800 zone, so it is important to see price hold above $37,000 on the 4-hour chart for further upside.
On the hourly timeframe, the price tested Monday’s POC at $34,400 and is attempting to rebound. If sellers push price lower, the next local support will be $34,000-$33,500.
Read ForkLog Bitcoin news in our Telegram — crypto news, prices and analytics.