


Maxim Lenets of Nanny Ventures explains the current market situation.
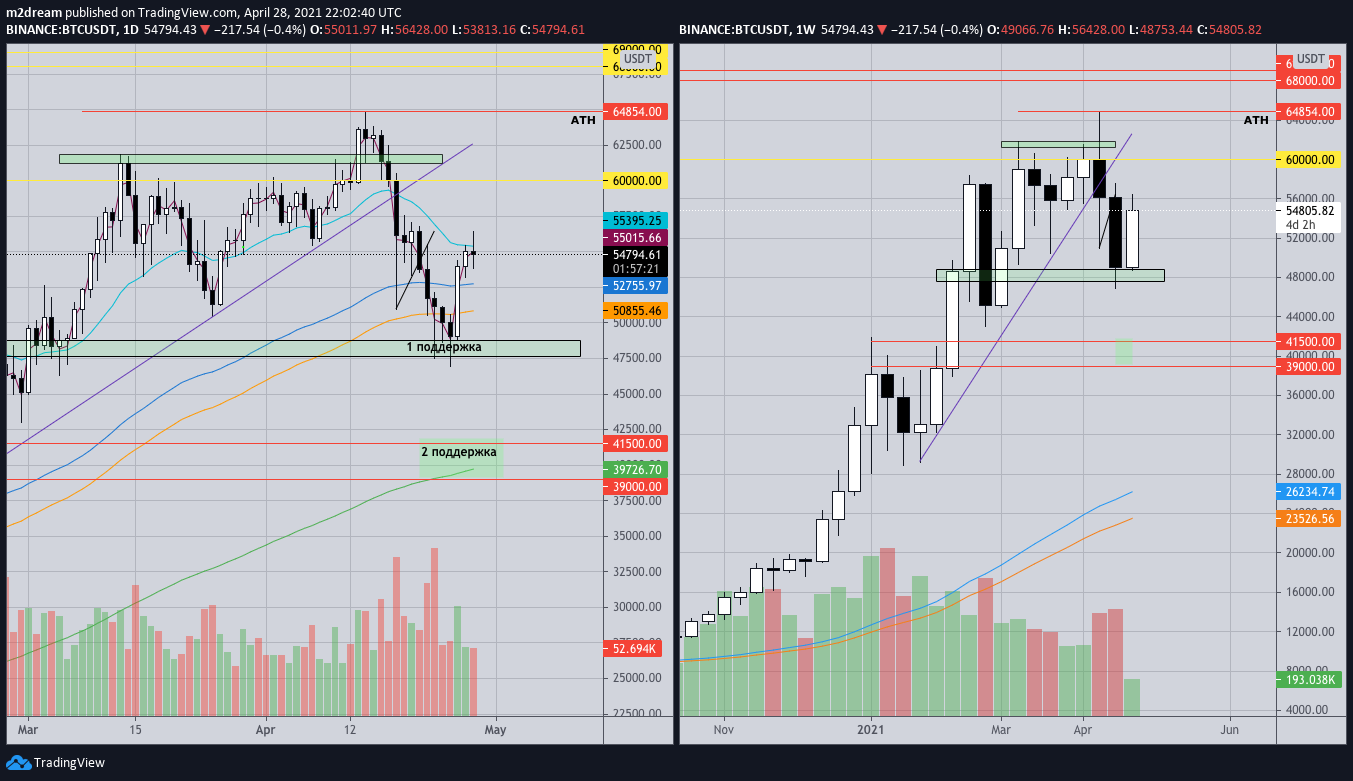
Last week, the price slipped to the first support in the $47,500–$48,500 range (chart below). The weekly candle closed at $49,066, with all red candles late in the week being aggressively bought, forming large wicks.
The week began on a favorable note for buyers, with Monday closing above the exponential moving averages on strong volumes. This points to a test of the $60,000 psychological level. The news backdrop also supports this scenario, as the Fed kept the base rate in a 0–0.25% range.


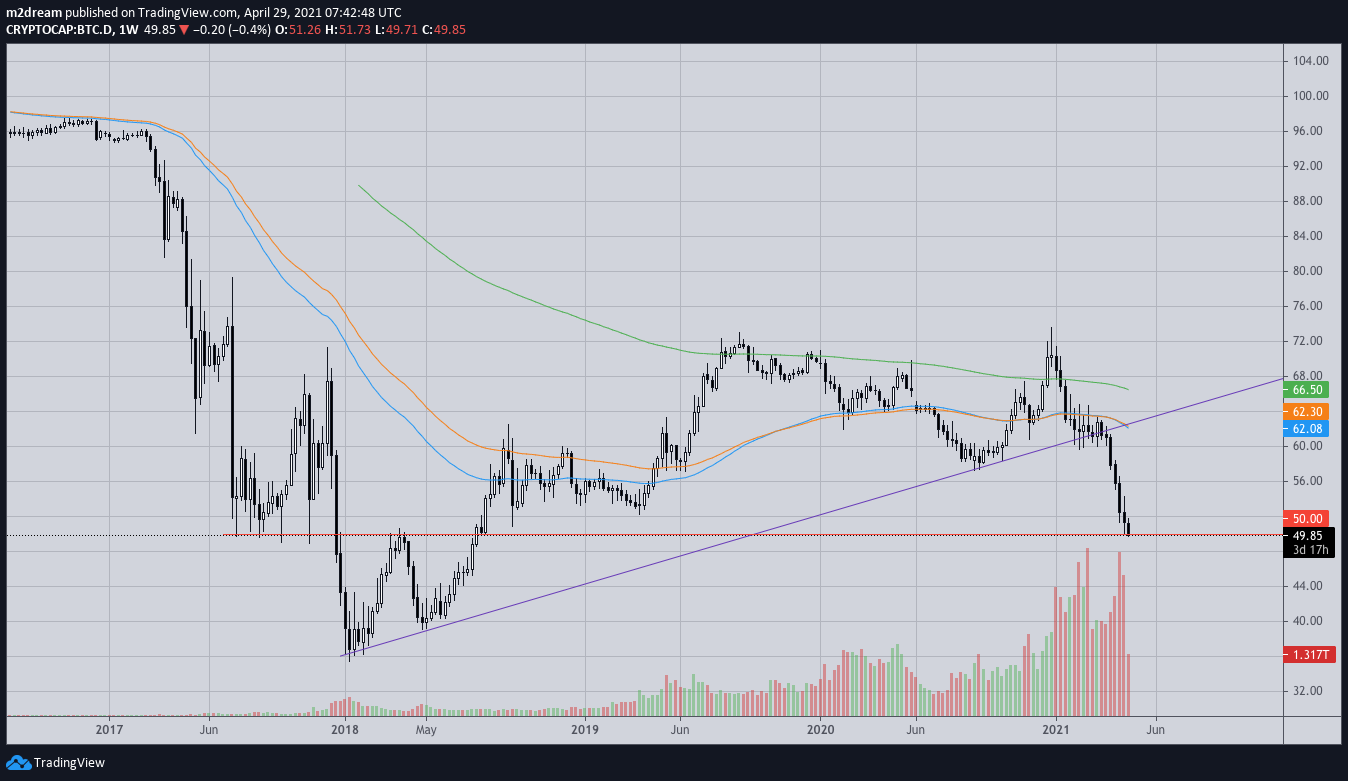
The Bitcoin dominance index broke through the psychologically important level — 50%. We are watching whether it can hold below it or manage to rebound.

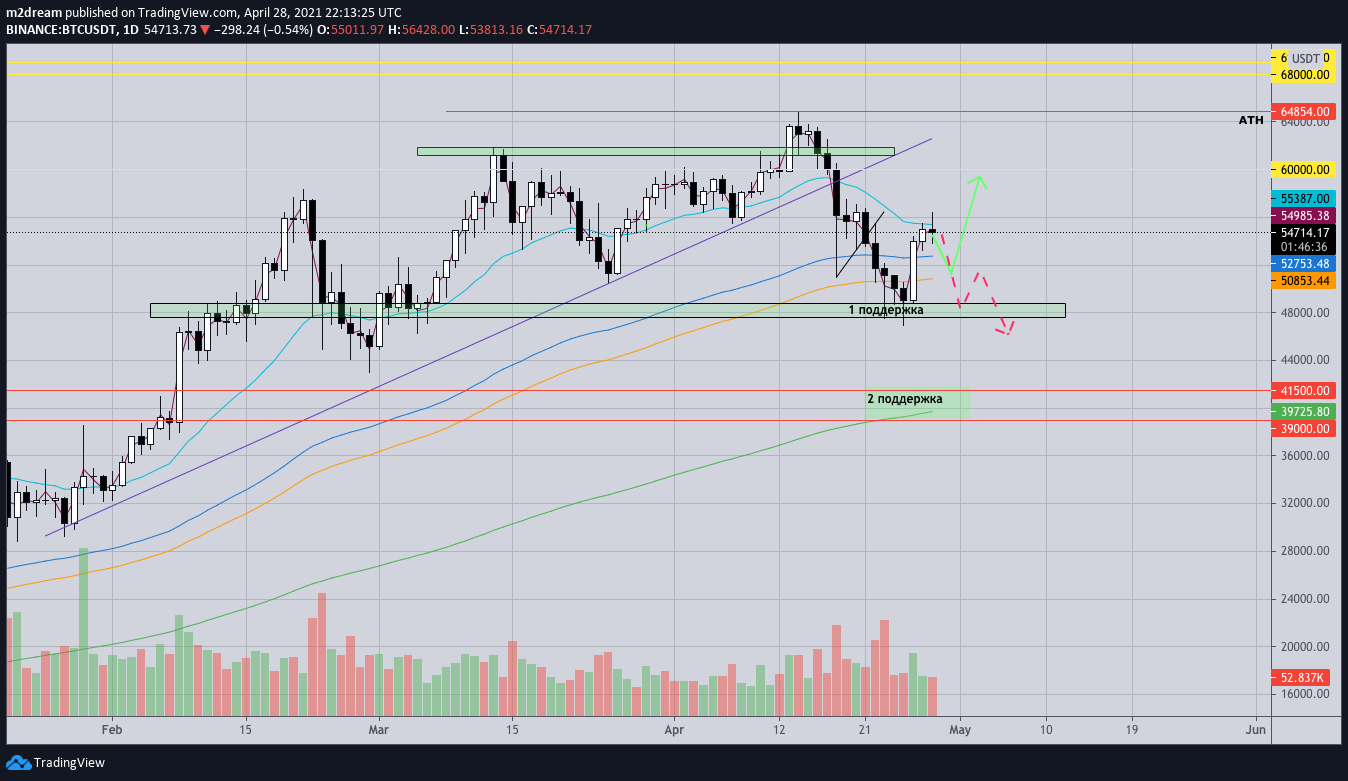
The price must hold above $52,500–$51,000 to preserve the bullish scenario for the coming days; otherwise a retest of the support level is possible.
Displacing the long scenario would amount to a breach of the support zone on high volumes (chart below). However, the probability of such a scenario is lower than that of a range-bound move.
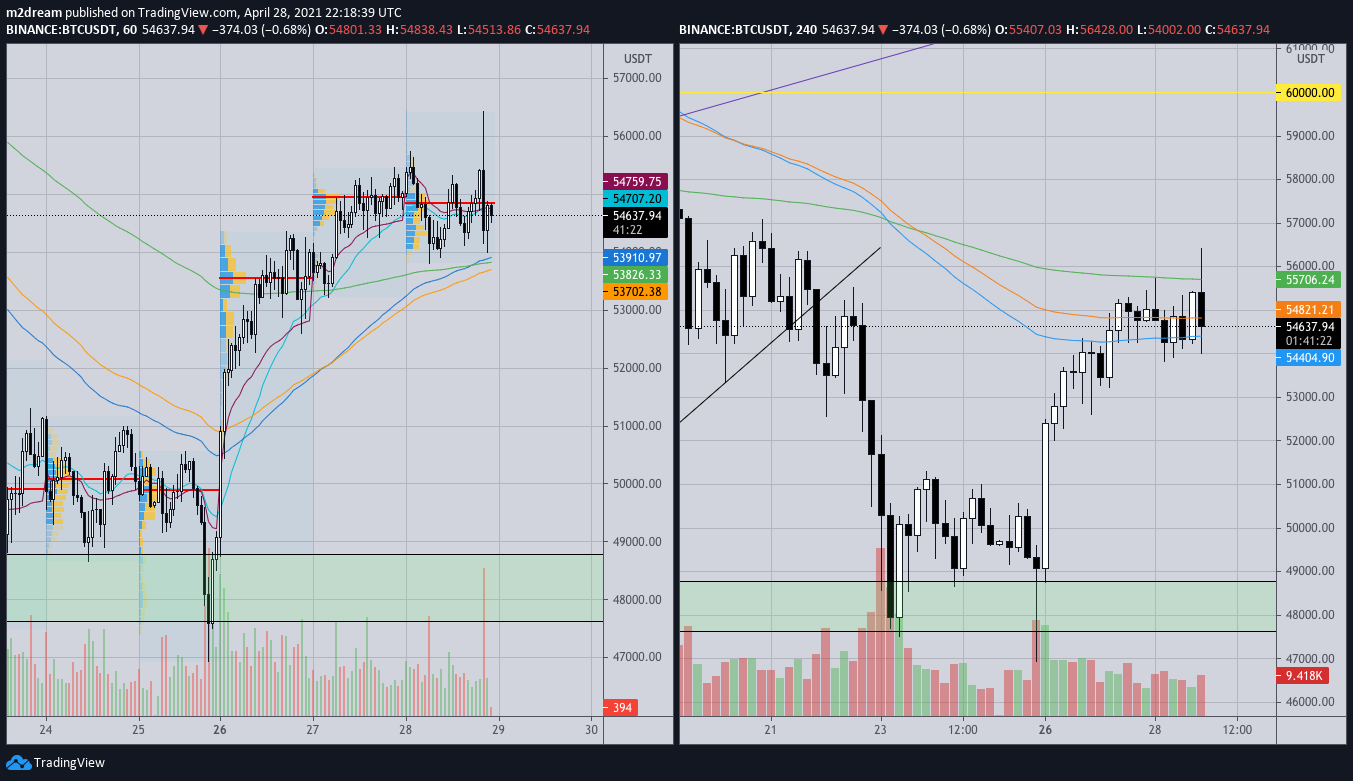
An interesting picture emerges on the hourly and four-hour charts. On the hourly chart, the price confidently holds above the moving averages; on the four-hour chart, a possible short squeeze, having briefly breached the EMA-200 and failing to sustain. Note the huge volume on the hourly chart during the squeeze.
We would like to see range-bound trading in the $53,500–$55,500 area before a move higher. If a break and local hold above $58,000 can be achieved, it would open the road to $60,000.
Overall, the bullish scenario remains, and optimism is returning after last week’s nervous drop.
Subscribe to ForkLog news on VK!