


Liquidity in digital assets continues to decline, amid a slide to cyclical lows in on-chain transfers, changes in exchange balances and capital flows, according to Glassnode.
With liquidity across the Digital Asset landscape continuing to recede, we assess activity in both on‑ and off‑chain environments, and develop a new framework to help identify peak Altseason regimes.
Discover more in the latest Week On-Chain?https://t.co/CDvm0PugY7 pic.twitter.com/wssftzRm03
— glassnode (@glassnode) October 10, 2023
On-chain analysis explains the current market apathy, where hodling remains dominant.
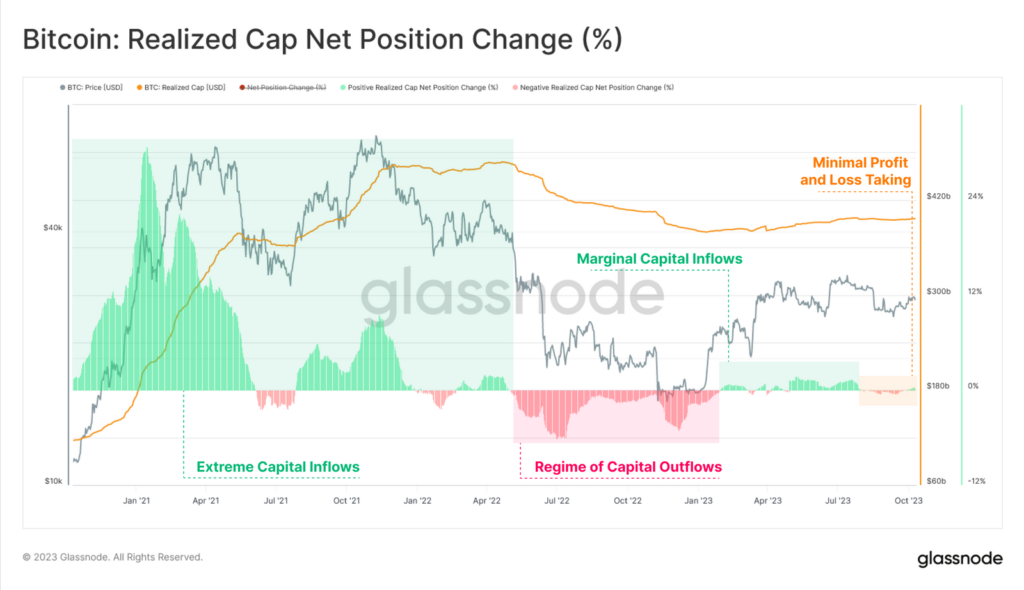
The “realized cap” metric remains at a level of ‘relative indecision’ — only a small number of on-chain moved coins show a significant divergence between current value and the price at which they were acquired.


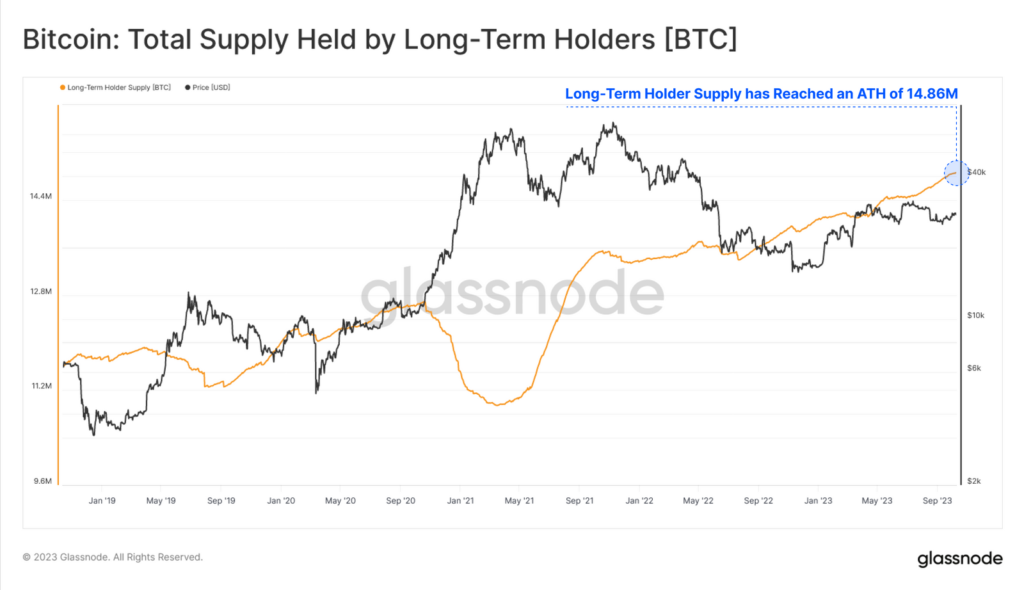
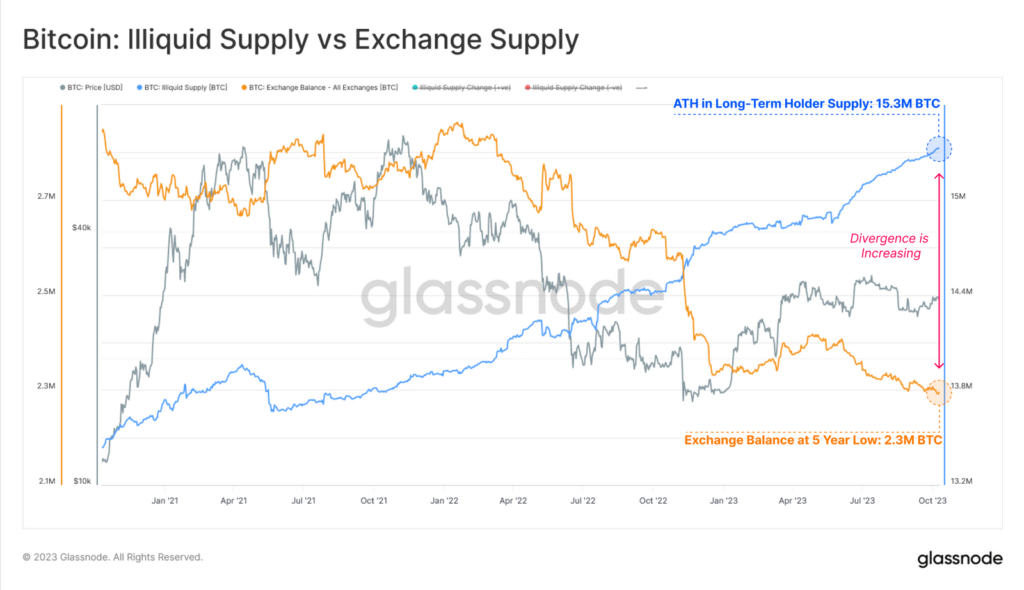
As a result, the number of bitcoins held by long-term investors reached a new record of 14.859 million — 76.1% of the available supply.
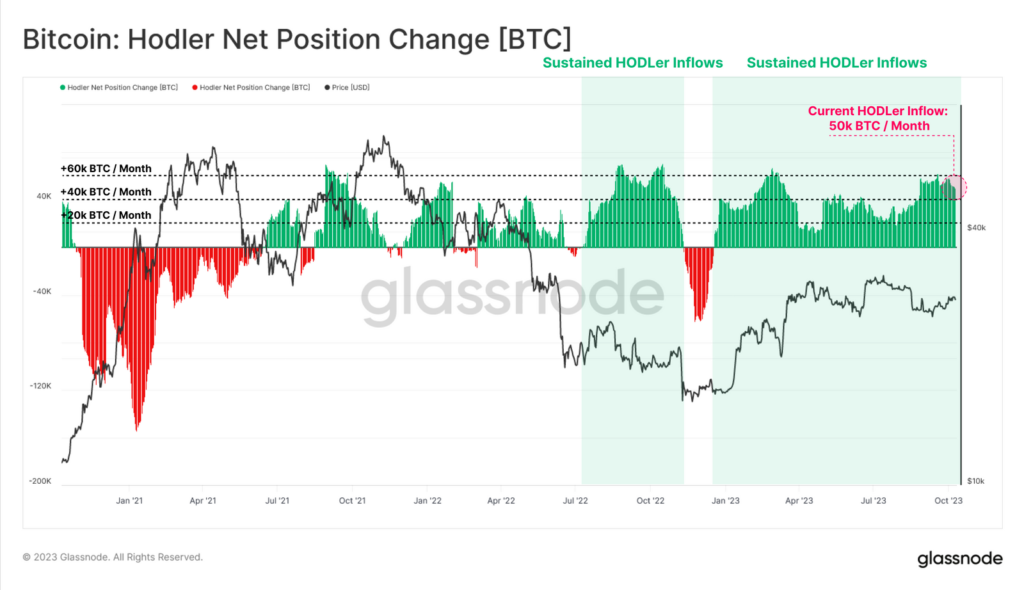
The net change in hodlers’ positions confirms the resilience of the coins’ ‘sleeping’ state. Monthly inflows to long-term investor wallets total 50,000 BTC. This points to both a shrinking available supply and a broad reluctance to transact.
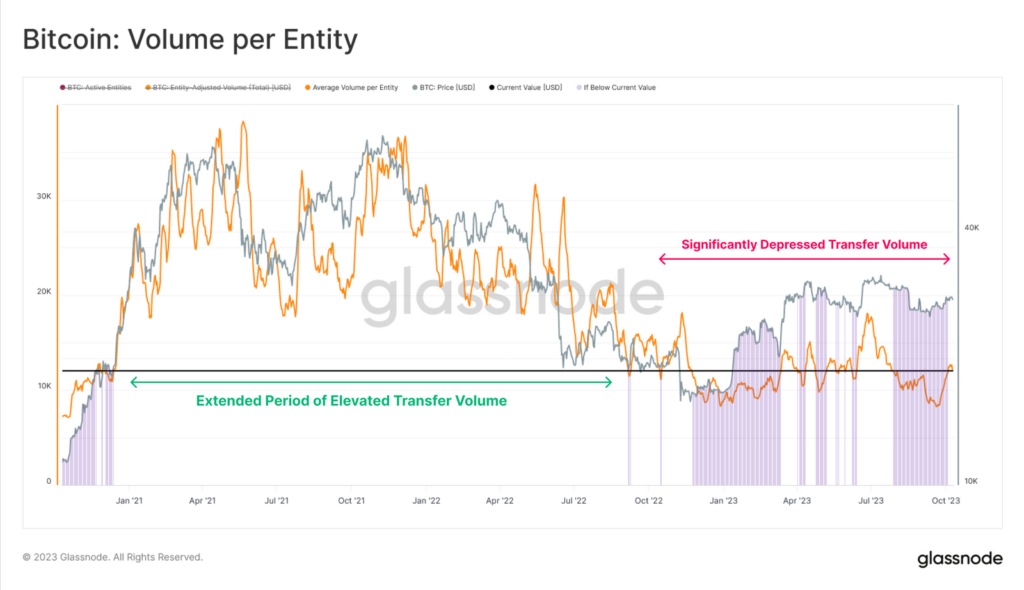
Previous observation is reinforced by the assessment of the average transfer size per active market participant. The metric declined to ~$12 200 (~0.44 BTC). The metric has returned to levels seen at the end of the 2017 bull cycle and at the end of 2020 (before the last rally).
The growth of the illiquid supply of bitcoins takes place as exchange balances fall to a five-year low (2.3 million BTC). The divergence of the two indicators suggests that investors are withdrawing coins from CEX to non-custodial wallets, where they subsequently enter a ‘mature’ category.
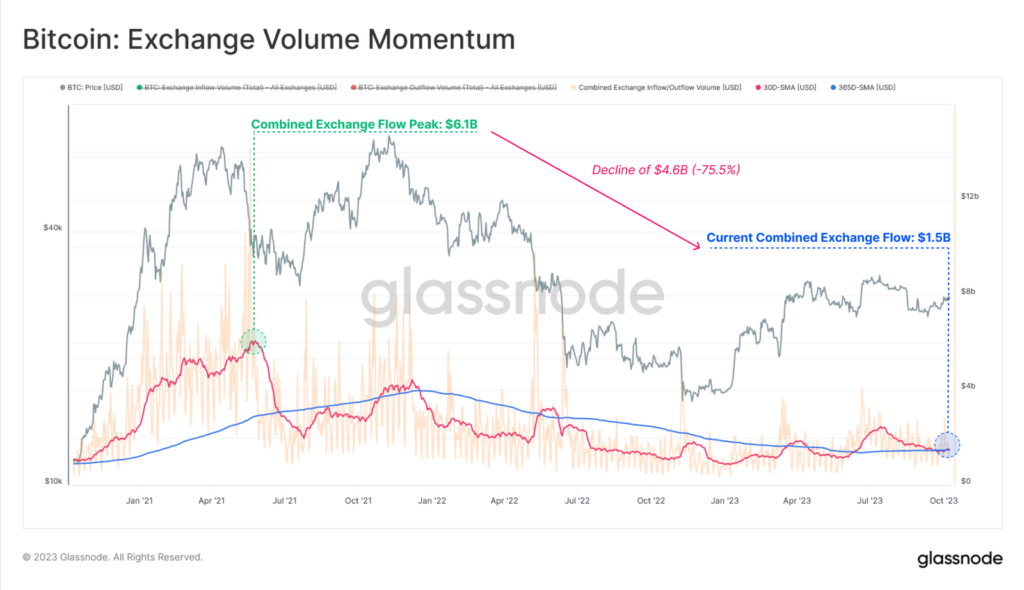
Analysts also analysed the dynamics of exchange-related inflows and outflows as a marker of investor activity. The 30 DMA and 365 DMA of the aggregate indicator fell to $1.5 billion. From a peak of $6.1 billion in May 2021, the indicator collapsed by 75.5%.
Specialists proposed a new methodology for assessing risk appetite, as well as for detecting periods of altcoin-season extremes within capital rotation.
According to Glassnode, historically the dynamics of digital gold have served as a leading indicator, after which trust grows first in Ethereum and then along the risk curve.
To visualise capital rotation, analysts proposed using the 30 DMA Realized Cap applied to Bitcoin, Ethereum, and stablecoins. The indicators were then normalised to Realized Cap (for the first and second cryptocurrencies) and to total market capitalisation (in the case of ‘stablecoins’).
The model presented below allows one to determine:
- risk-on regime (all three of these major assets show net capital inflows);
- or ‘risk-off’ (any of the three major assets begins to demonstrate net capital outflows).
To refine the picture, analysts added a filter in the form of events when capital moves toward Ethereum and stablecoins. To confirm correctness, the analysts added the Bitcoin dominance index to the chart and ensured that the metric’s decline coincided with the peaks of interest in altcoins.
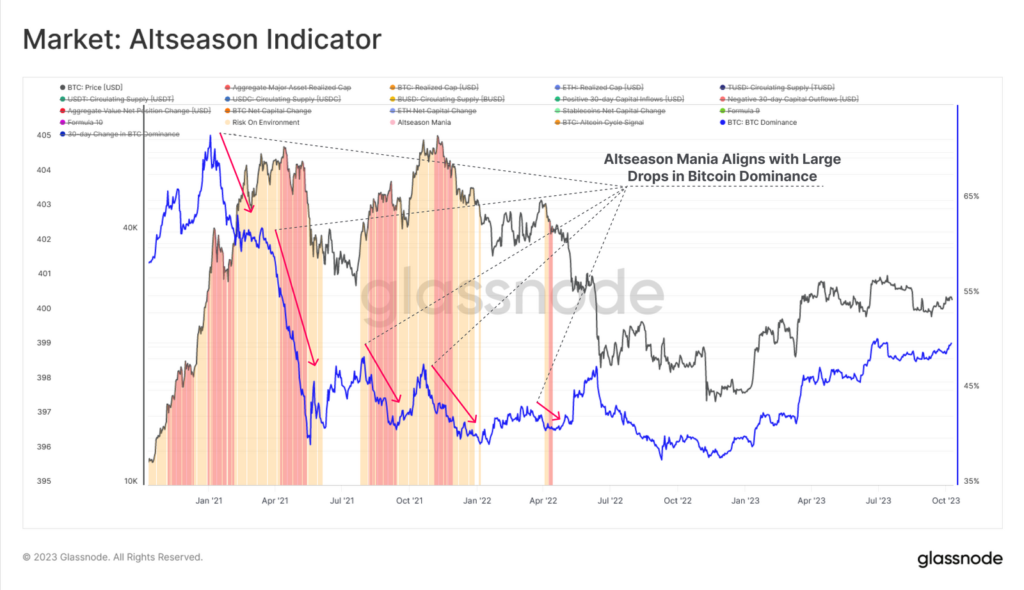
«Despite significant fluctuations in altcoin valuations, the model says that the risk-on regime is not observed at present. This confirms the previous conclusion about a lack of liquidity available in the market», — the analysts concluded.
In April, the dominance index of the leading cryptocurrency reached 51.1%, approaching levels seen in April 2021.
Earlier CryptoQuant analyst known as Maartunn stated, that Bitcoin is expected to see a “substantial rise” if it clears above $27,900. The level coincides with the MVRV indicator MVRV applied to short-term market participants.