


Almost all short-term bitcoin investors are in ‘paper losses’, a shift in sentiment. According to Glassnode, for the first time after FTX collapse, there are signs of panic among this cohort.
With almost all #Bitcoin Short-Term Holders now underwater on their position, sentiment has shifted towards the negative.
In this report, we explore several measures to track investor sentiment. We develop indicators which assess divergences between the market and observed… pic.twitter.com/DcD5ULIPwy
— glassnode (@glassnode) September 18, 2023
As the price retraced sharply from around $26,000, more than 97.5% of coins held by speculators were underwater. When a metric reaches such values, the probability of approaching a selling peak grows at a geometric pace, the analysts noted.


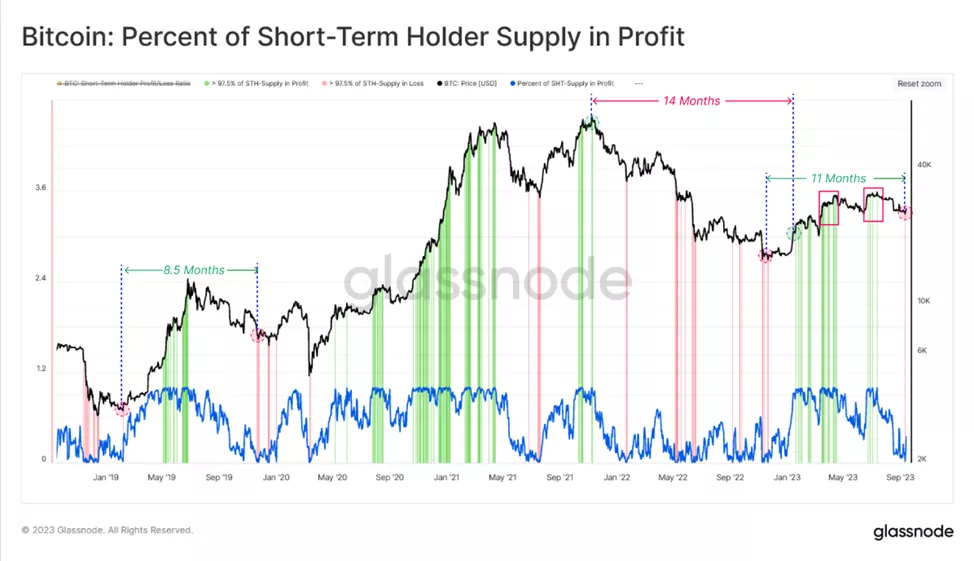
Indicators MVRV and SOPR for short-term investors corroborate the observation that historically the selling peak with the greatest relative losses coincided with significant price bottoms.
Such calculations are necessary to assess the ‘inflows’ and ‘outflows’ of changing sentiment among new market entrants. They are based on analysing the divergence between the costs of two subgroups: hodlers and coin-spenders:
Negative sentiment arises when the cost basis of the ‘spenders’ is higher than that of the holders;
Positive sentiment — in the opposite situation.
Since mid-August, a first regime has formed in the market — for the near-term prospects there will be a certain degree of panic and negative sentiment, the experts explained.
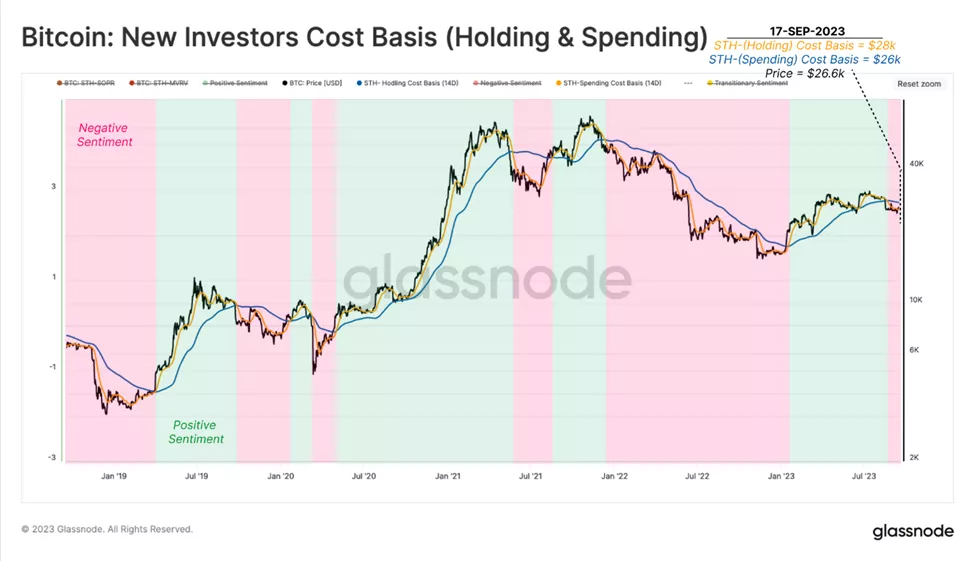
To better visualise the indicator, analysts normalised it by the spot price.
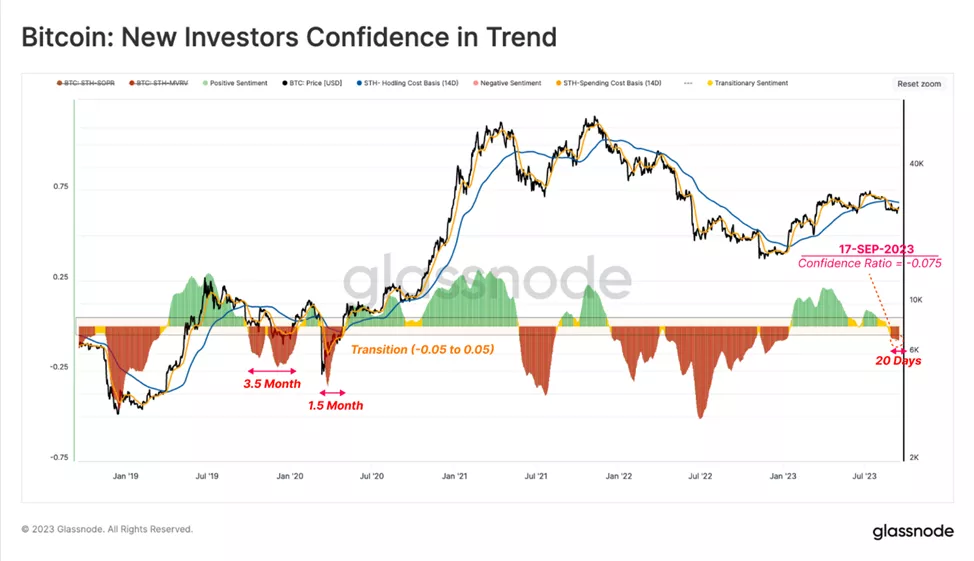
The range of the metric is bounded by extremes from -0.25 to 0.25, with rare excursions beyond the range at market turning points. As a neutral corridor, experts selected values from -0.05 to 0.05.
Ranges of negative sentiment during a recovery after bear markets typically last from 1.5 to 3.5 months, they noted. The current period stands at 20 days (as of September 17).
Two models proposed as potential ‘bottoms’:
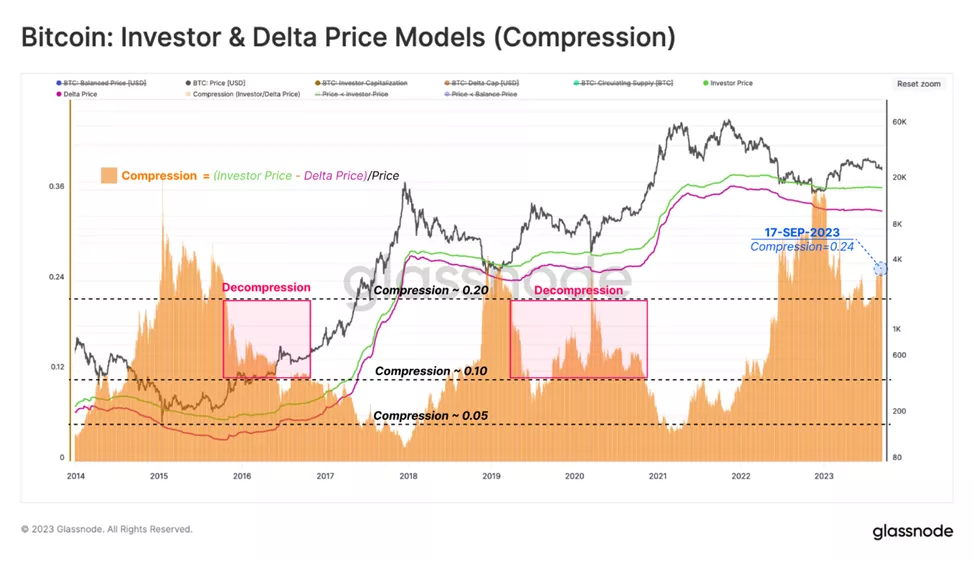
Investor price ($17,600). It reflects the average cost basis of all coins. Bitcoins held by miners are excluded from the sample.
Delta price ($11,100). It represents a combined on-chain and technical-analysis model, often used to model the basis of cycles.
The chart below shows how the quotes of the first cryptocurrency recovered from these levels in previous bear phases.
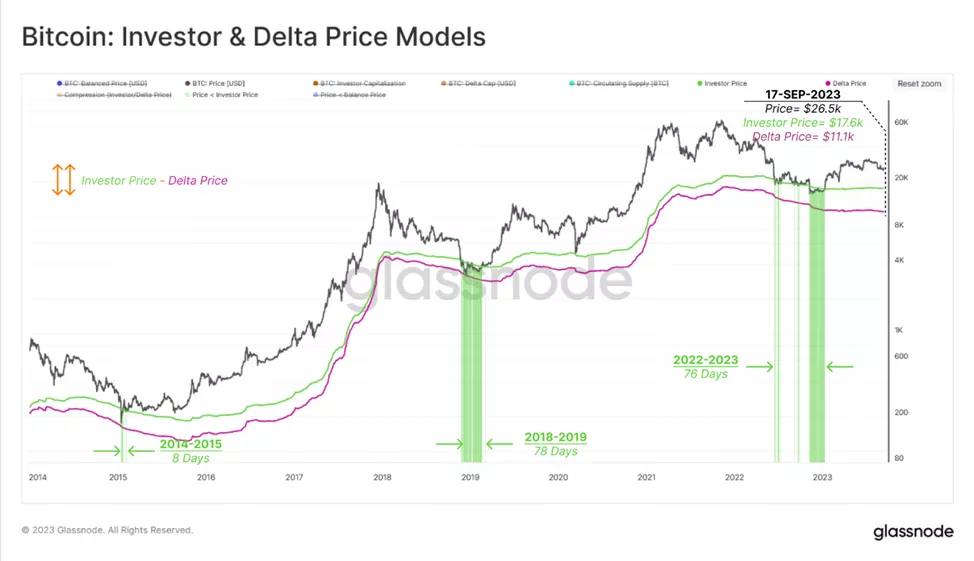
Additionally, as a measure of the recovery phase, analysts proposed using the compression and expansion between these price models.
The indicated spread will narrow near cycle peaks as a large volume of capital enters the market. Conversely, divergence signals a weakening of its inflow, when the driving factor becomes a decline in prices.
Compression = (Investor price — Delta price)/Spot price
The model can be used to track the transition from the bear market’s deepest phase back to its recovery. The chart below shows that the prevailing structure is similar in nature to the compression phase observed in 2016 and 2019, the experts stressed.
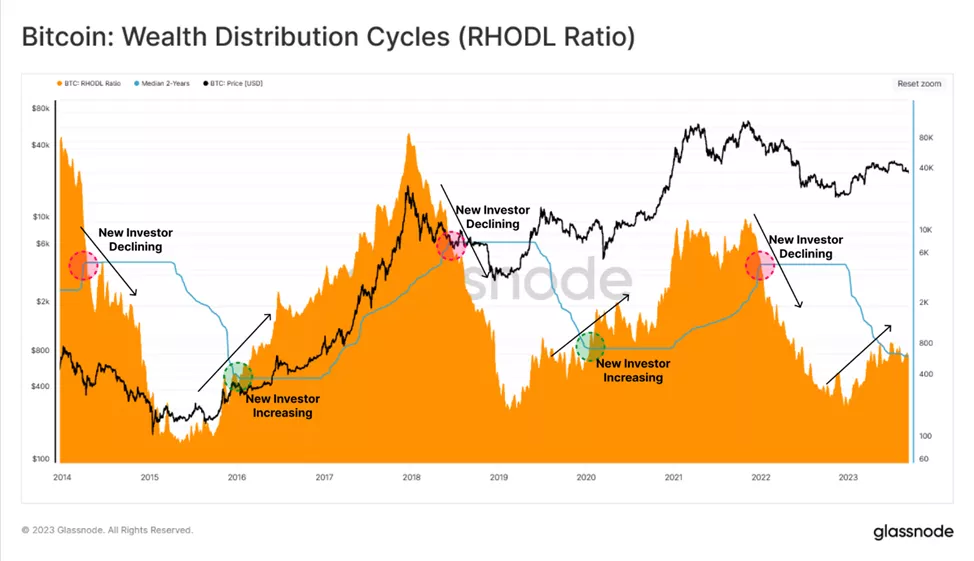
To assess capital flows, analysts also employed RHODL Ratio. They applied a two-year median (half-cycle) as a threshold value for periods when movement regimes shift from a bullish to a bearish market.
On this metric, 2023 saw a modest inflow of new investors. The indicator is only just approaching the two-year average. Inflow of participants is positive, but relatively weak in momentum, — explained the analysts.
Several metrics confirm persistent uncertainty. The latest is driven by the macroeconomic backdrop, regulatory pressure and limited liquidity across all markets, — the analysts summed up.
Earlier, BitMEX co-founder Arthur Hayes allowed for a possible brief dip of Bitcoin below $20,000 followed by a new bullish impulse. However in September he pointed to positive prospects for the first cryptocurrency despite the policy of the Fed.
The founder of Edelman Financial Engines, Rick Edelman, forecast that the price of digital gold to $150,000 by the summer of 2025.