


On May 11 the price of digital gold tested $82,000, yet derivatives data point to trader caution.


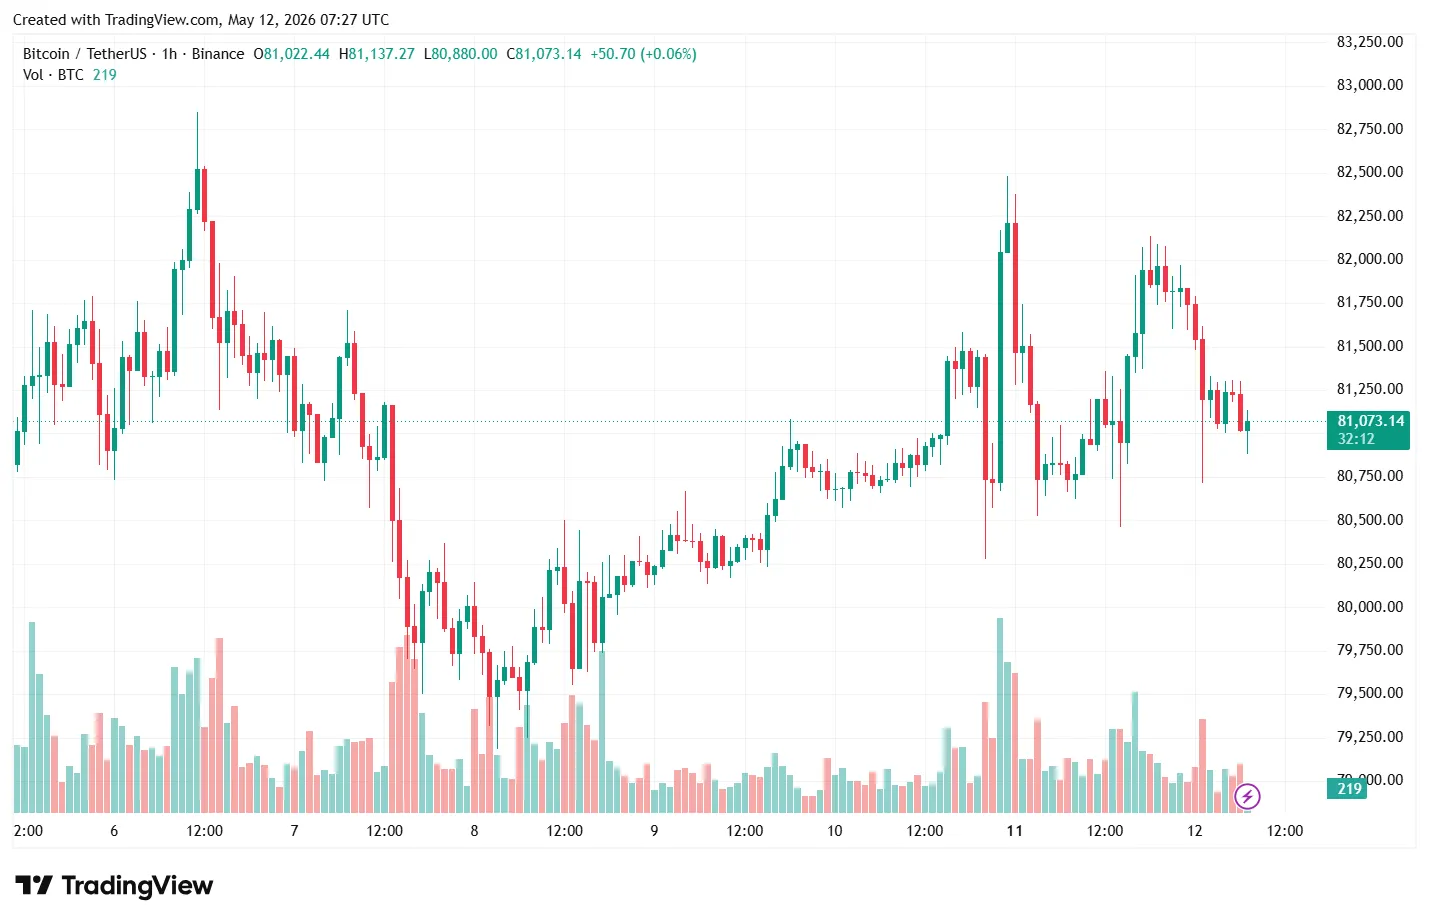
At the time of writing the leading cryptocurrency changes hands at $81,073 (+0.4% on the day).
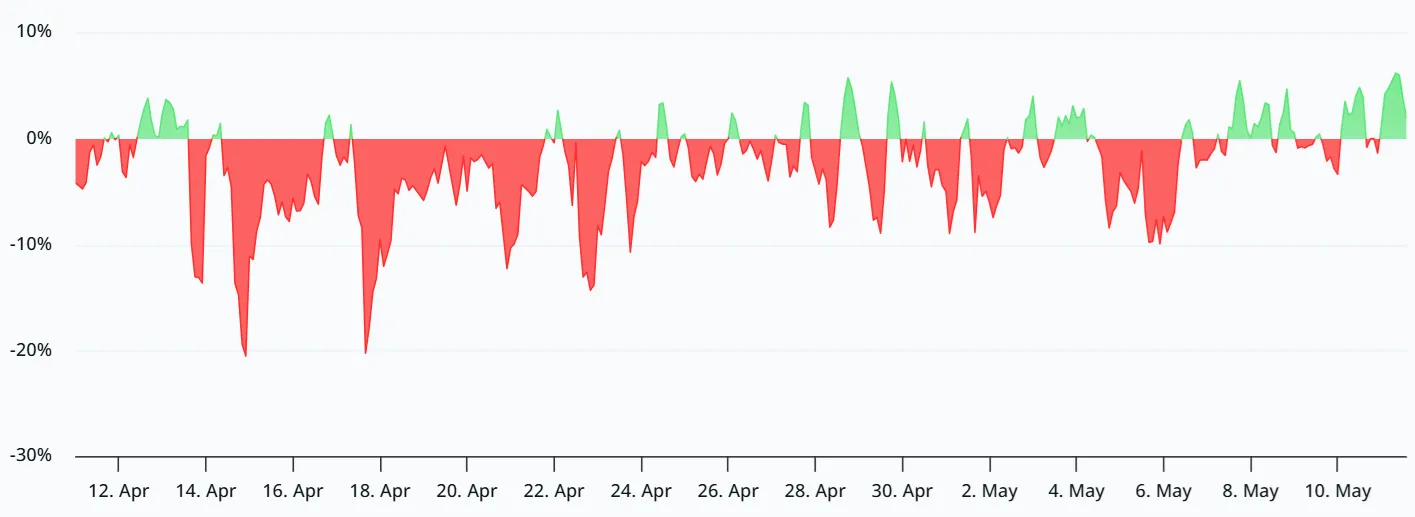
The annualised funding rate on bitcoin perpetual futures briefly jumped to 6%—its first move out of negative territory in more than a month.

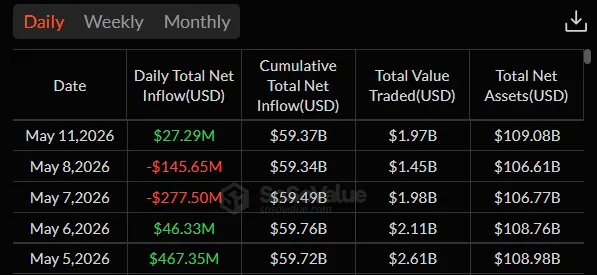
Spot bitcoin ETFs in the US add pressure. Outflows were recorded on May 7 and 8. Institutional interest weakened just as the coin failed several times to break $82,000.

Reasons to rally
Michaël van de Poppe, founder of MN Trading, says bitcoin has no clear reason to fall. In his words, the market has coalesced around the idea of a “bear flag” and a move to $50,000 by year-end; he disagrees.
There’s clearly no reason to expect #Bitcoin to fall, out of nowhere.
There’s the general consensus that we’re in a bear flag and that we must see $50K later this year.
How so?
Didn’t we have to see no new ATH before the halving either?
The recent shock in February has been… pic.twitter.com/S68oRHV5SF
— Michaël van de Poppe (@CryptoMichNL) May 11, 2026
Ahead of the halving, many likewise did not expect a new all-time high. Since the February pullback, the asset has held above the 21-day moving average, flipping former resistance into support and drawing steady demand. The Nasdaq, meanwhile, remains firm.
He puts the next resistance zone at $85,000–$88,000.
He notes that each breakout is met with calls for a reversal—whether the Nasdaq’s advance or bitcoin’s bounce from $60,000 to $70,000. In his view, participants are missing the main point: a shift in market regime.
Every time there’s a breakout upwards, the first response is that the markets must reverse back down.
‘The Nasdaq breaks upwards, we must crash!’
‘#Bitcoin bounces from $60K to $70K, we must go down!’People miss the bigger picture and that’s a complete regime switch.
The…
— Michaël van de Poppe (@CryptoMichNL) May 11, 2026
He suggested that cryptocurrencies could become the main payments infrastructure for AI. Buyers of spot ETFs are acquiring millions of bitcoins daily, and the number of holders has hit an all-time high. Altcoins are breaking resistance levels while still 80% below their peaks.
Van de Poppe suggested the market is exiting its bear phase and advised investors to stay calm.
Odds of a breakout
An analyst known as Darkfost said bitcoin has yet to reclaim the breakeven level of short-term holders (STH). Many market participants, he added, are misreading current charts.
❌ BTC REGAINING THE STH COST BASIS
I’m seeing posts saying that BTC managed to break above the STH cost basis.
In reality, BTC has still not closed above this level, contrary to what some charts suggest.—💡In this version of the indicator, I have removed as best as possible… pic.twitter.com/IGFa96ZhiL
— Darkfost (@Darkfost_Coc) May 12, 2026
A data distortion, he said, stemmed from the movement of 800,000 BTC on Coinbase. The coins had sat dormant, but after the transfer the system tagged them as new short-term purchases around $84,000, artificially lowering STHs’ average cost basis.
Darkfost presented an adjusted version of the indicator. By his estimate, the true STH cost basis stands at $81,800.
He argues that to resume the bull trend, price must close a daily or weekly candle above $81,800.
Institutions have altered bitcoin’s cycles
Falling volatility and institutional inflows have changed bitcoin’s market cycles, said CryptoQuant analyst Crypto Dan.
“지금 비트코인, 어떻게 봐야 할까”
시간이 지남에 따라 비트코인의 변동폭은 자연스럽게 줄어들게 되는데, 그로 인해 비트코인 MVRV의 변동폭도 줄어들고 있다.
그리고 현재는 현물 ETF와 미국이라는 거대 국가의 개입, 기관들의 유입으로 과거와 다른 움직임을 예상해야 한다.
그렇기 때문에… pic.twitter.com/jW5ZI2QDAL
— Crypto Dan (@DanCoinInvestor) May 12, 2026
He argues the range of the MVRV indicator is narrowing alongside price swings. Approval of spot bitcoin ETFs in the US and interest from large players have made the current cycle unique; price action now diverges from historical patterns.
Crypto Dan believes investors should not wait for classic bottom signals. What matters now is flexible analysis and swift adaptation.
“No one has encountered such a cycle before. Being ready to act now will be a condition for high returns in the future,” — the expert concluded.
On May 8, the price of the leading cryptocurrency fell below $80,000 amid ударов by the United States on targets in Iran.