


Analysts Warn of Further Bitcoin Losses After $80,000 Breach
Bitcoin drops below $80,000 as altcoins slide; liquidations hit $2.6bn.
On the evening of January 31, the leading cryptocurrency plunged below $80,000, shedding about 7% in 24 hours.
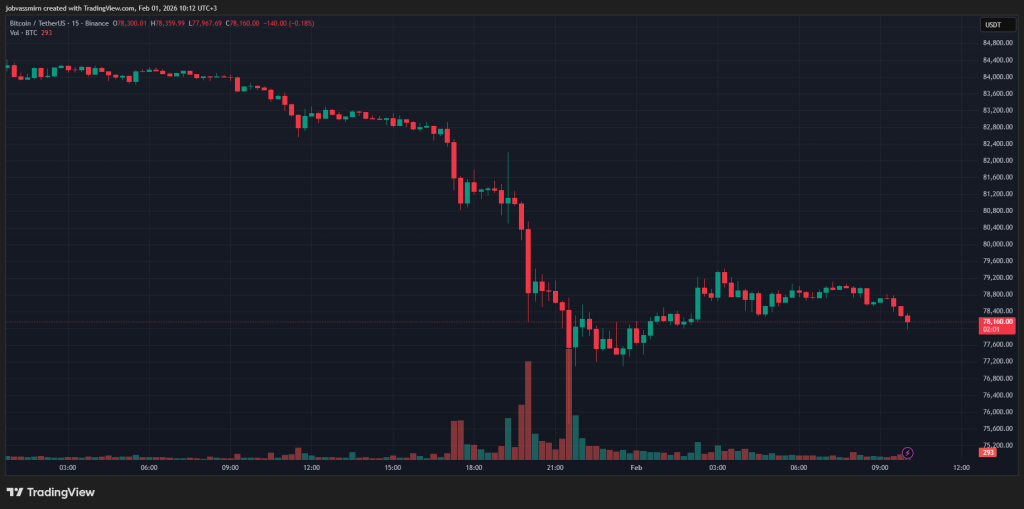
The local low was set just above $75,000—levels not seen since April 2025. At the time of writing the asset had recovered and was trading near $78,000.
The drop coincided with the end of January, leaving Bitcoin’s monthly chart with a red candle for the third consecutive month.
Other top‑ten cryptocurrencies also fell, some dropping more than the bellwether.
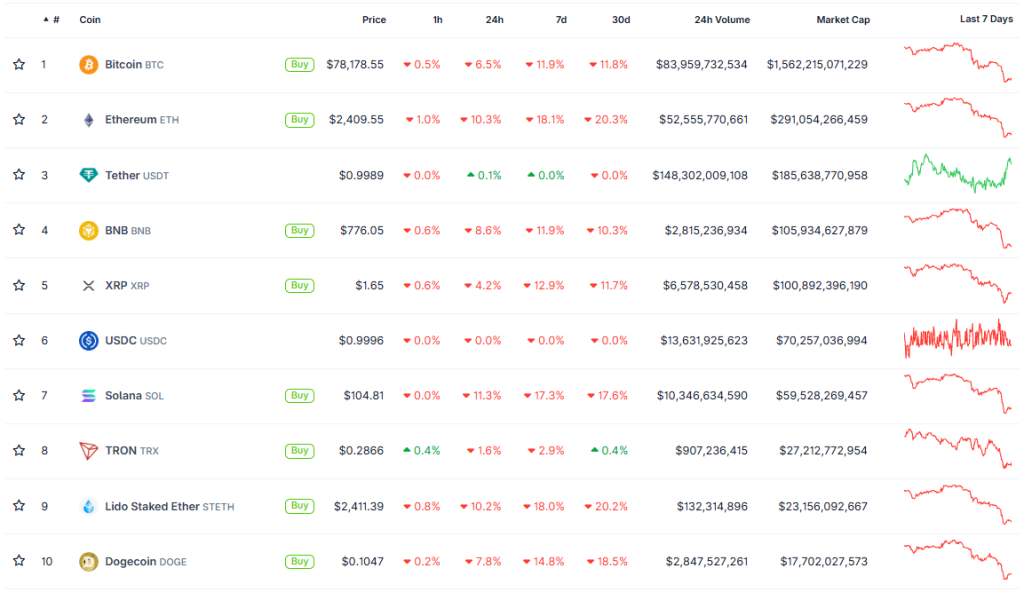
Ethereum slipped below $2,500, losing more than 10%. Solana fell under $100—down 11.5%.
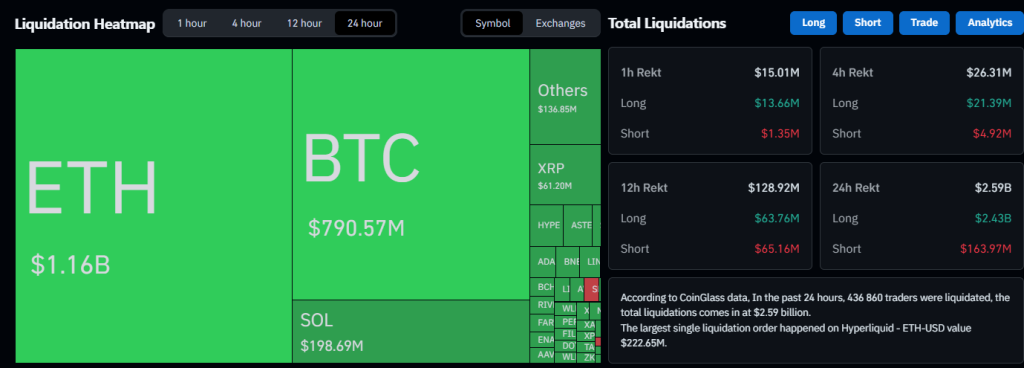
According to CoinGlass, liquidations over the past 24 hours totalled $2.6 billion. All but $163 million hit long positions.
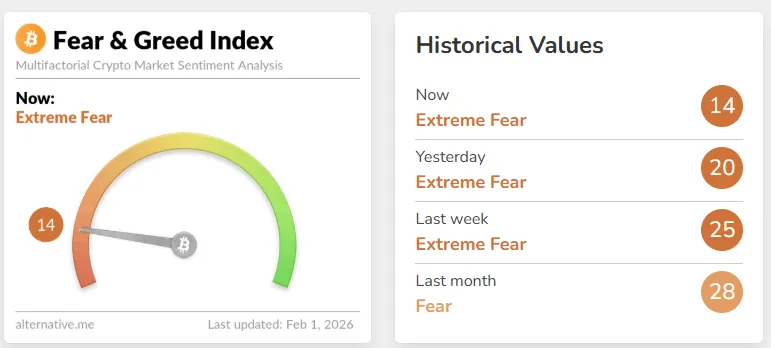
Crypto Fear and Greed Index dropped to 14 for the first time since mid‑December 2025.
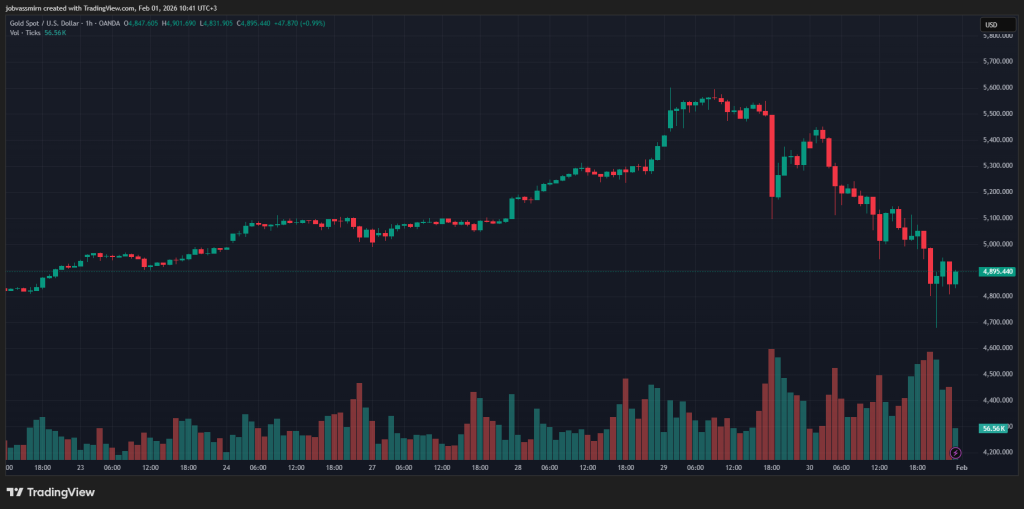
The sell‑off in digital assets unfolded alongside precious metals. Gold slid to $4,900 per ounce, and silver to $85. However, their pullbacks followed record highs, unlike cryptocurrencies, which have stagnated since late last year.
Outlook and forecasts
A trader under the pseudonym FrankAFetter pointed to the True Market Mean falling below spot for the first time in two and a half years. The metric shows the average purchase price of coins by investors, excluding miners.
Bitcoin falls below its True Market Mean price for the first time in 2.5 years. Last time this happened BTC was $29k. pic.twitter.com/rapIJ57ALx
— Frank (@FrankAFetter) February 1, 2026
“Put simply, this is unfavourable for Bitcoin’s price action in the short and medium term,” — added OnChainCollege.
Analyst Keith Alan allowed for a double bottom forming around $74,000. This area coincides with the support line from last April.
This is why I said, “Gotta trade the market we’ve got, not the one we want.”
Local Low at $80.5k was annihilated. If support at the 2025-04-07 Timescape Level doesn’t hold, there’s a potential double bottom opportunity around the Lower Low at, wait for it…….$74,420.69. https://t.co/4zRBCgKnOh pic.twitter.com/rbDPTdzfrz
— Keith Alan (@KAProductions) January 31, 2026
MN Trading founder Michaël van de Poppe noted that the RSI on Bitcoin’s weekly chart fell below 30 versus gold.
Historically, this is the area where the bear market of $BTC is about to end or ends.
Why?
RSI <30 vs. Gold is a trigger that has been hit during the bear market low in 2015, 2018 and 2022. It’s hitting again. pic.twitter.com/kDK4XWOH8H
— Michaël van de Poppe (@CryptoMichNL) January 31, 2026
“[…] this is a signal that was triggered at bear‑market lows in 2015, 2018 and 2022. And it is triggering again,” the expert added.
The analyst using the pseudonym Plan C noted that Bitcoin’s current decline represents an almost 40% deviation from the record $126,000.
$75,000–$80,000 is a 37% to 40% correction.
Decent chance this will be the deepest pullback opportunity this Bitcoin bull run.
This is my personal opinion, not financial advice.
— Plan C (@TheRealPlanC) January 31, 2026
“There’s a decent chance this will be the deepest pullback of this Bitcoin bull run,” he allowed.
Earlier, CryptoQuant experts saw signs of capitulation among Bitcoin investors.
Рассылки ForkLog: держите руку на пульсе биткоин-индустрии!