Key takeaways
- Leading cryptocurrencies closed the month in the red. Market capitalisation fell by 18%.
- Shares of public miners and related industry companies fell sharply.
- TerraUSD overtook Binance USD by market capitalisation.
- The NFT segment revived amid launches of new projects and infrastructure updates.
- The correlation of Bitcoin and Ethereum with the stock market strengthened amid expectations of tighter Federal Reserve policy.
- Total value locked in Avalanche smart contracts rose by 37%.
- Some on‑chain indicators signal Bitcoin is undervalued.
Dynamics of leading assets


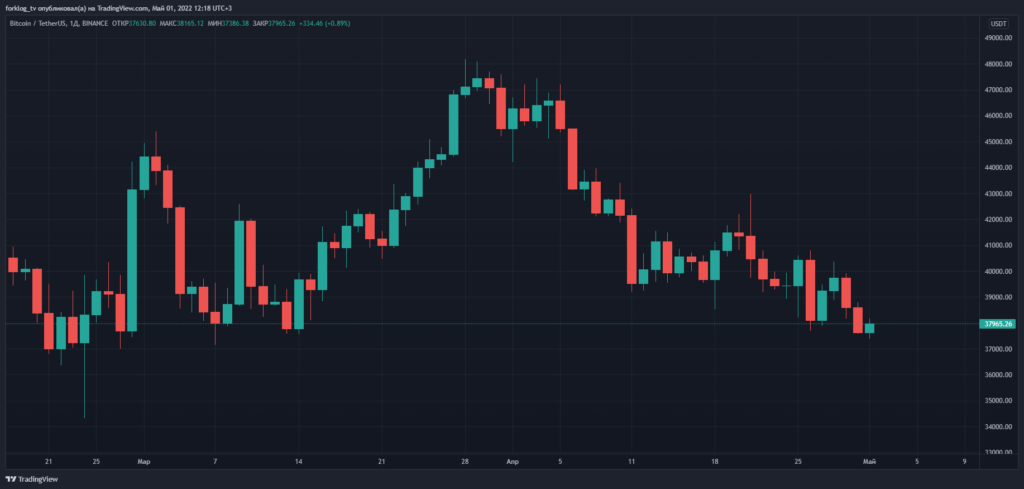
- Bitcoin ended March at a yearly high but could not hold the range of $47,000-$48,000.
- During April, Bitcoin set new lows, finishing the month below $38,000.
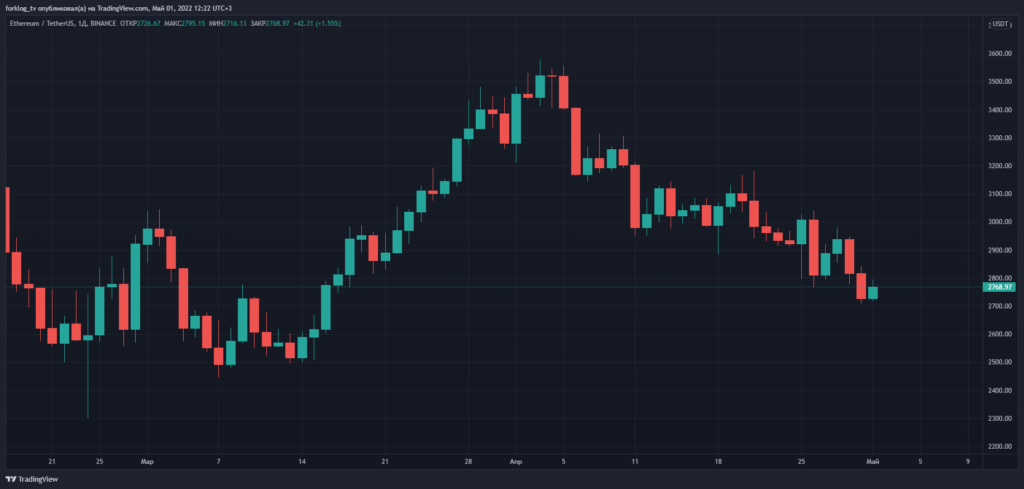
- In early April Ethereum failed to hold above $3,500, closing the month near $2,700.


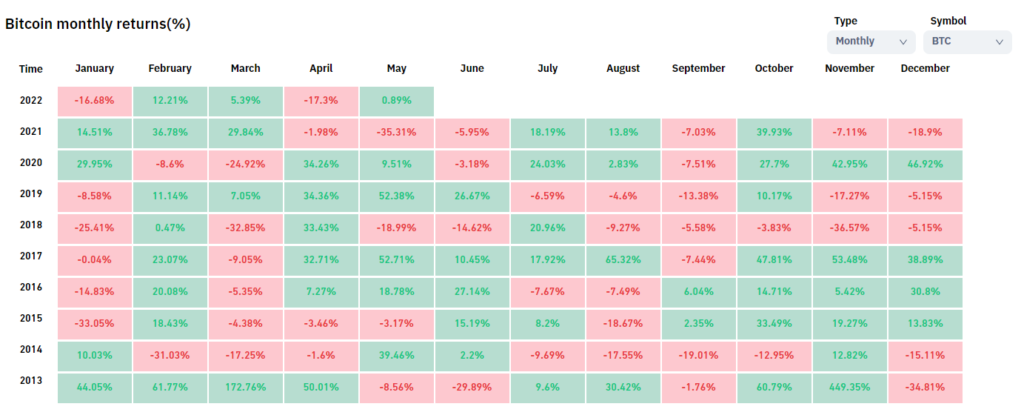


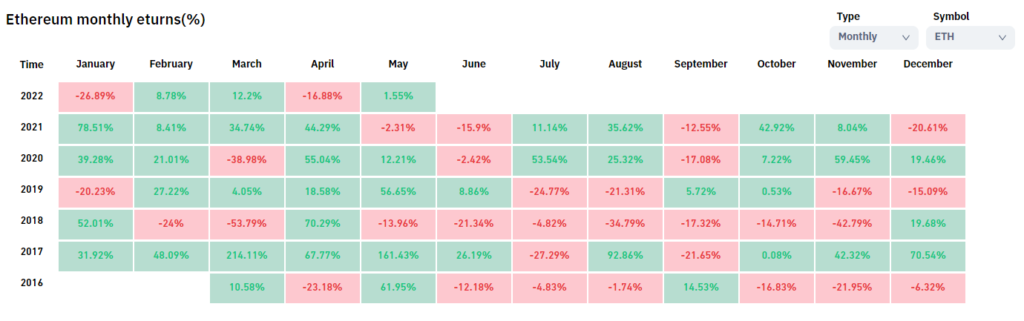
- Bitcoin fell 17.3% over the month, and Ethereum declined 16.9%. A historically positive start to Q2 proved negative this time.
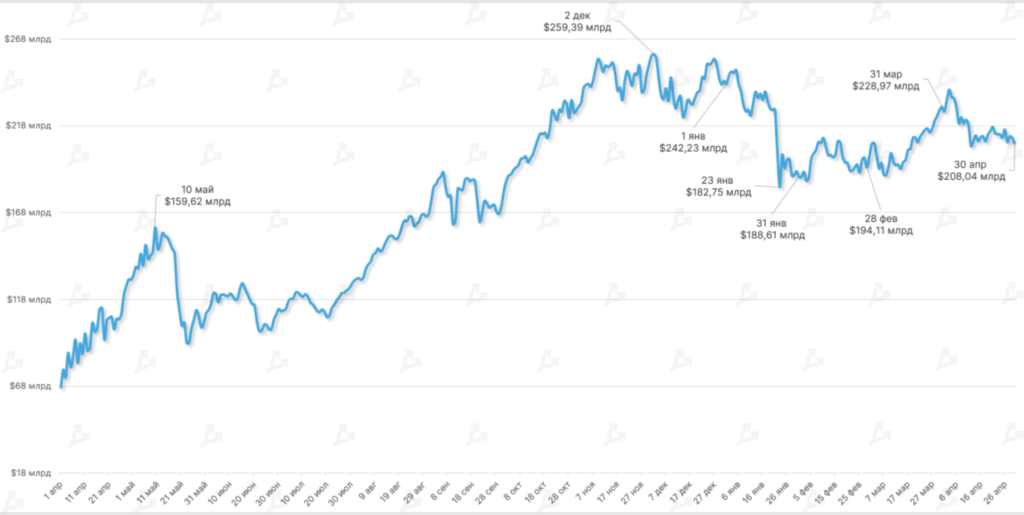
- Market capitalisation fell by 18% in April, from $2.05 trillion to $1.67 trillion.


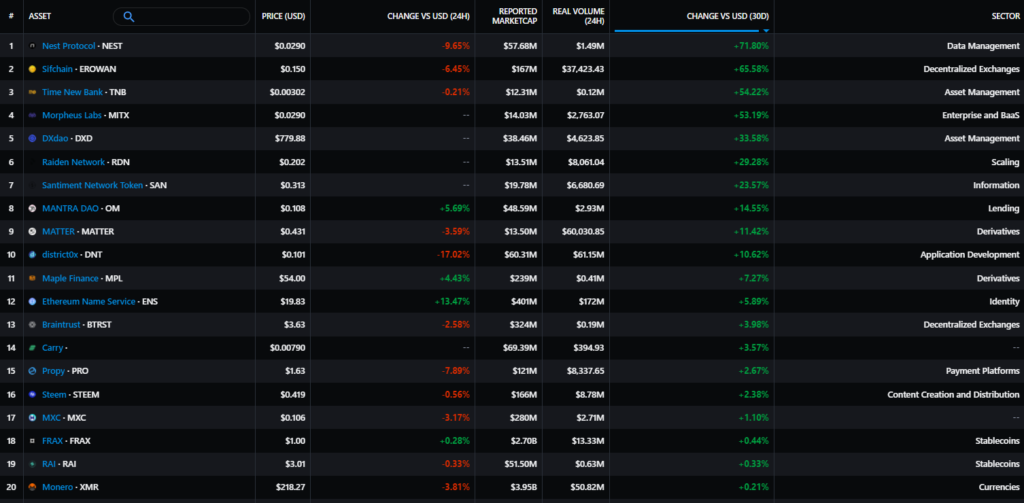


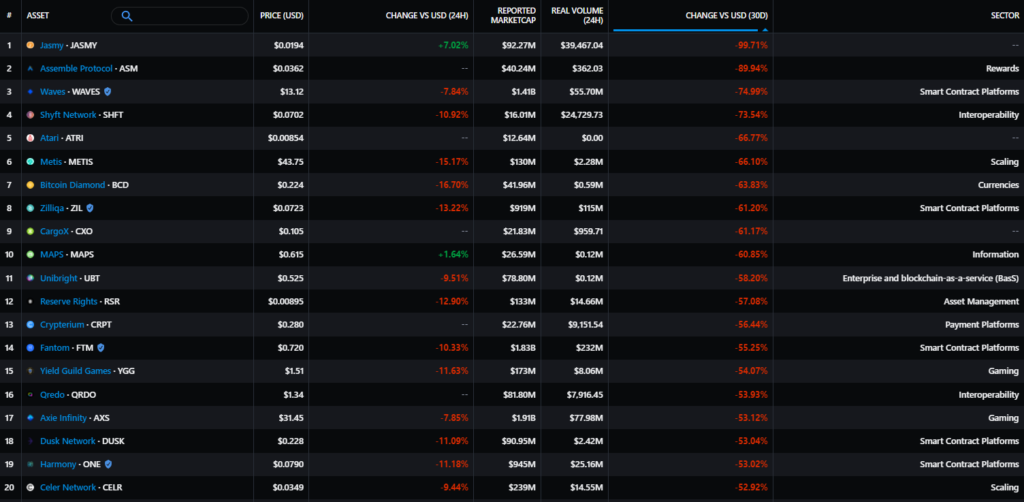
Against the backdrop of the broader correction, only low-capitalisation projects showed positive momentum. Waves (WAVES) was among the underperformers after in April the project’s founder accused Alameda Research of manipulating the token price with the opening of a large short position. Token prices for Zilliqa (ZIL), Fantom (FTM), Harmony (ONE), and Axie Infinity (AXS) fell by more than 50%.
Cryptocurrency-related companies (as of close 30.04)
Stock performance of mining companies (as of close 30.04)
Canaan (CAN):
-35%
Ebang International (EBON):
-21.2%
Riot Blockchain (RIOT):
-50.8%
Hut 8 (HUT):
-35.7%
Marathon Digital (MARA):
-45.3%
Public cryptocurrency companies and miners were not spared from two-digit losses.
Macroeconomic backdrop


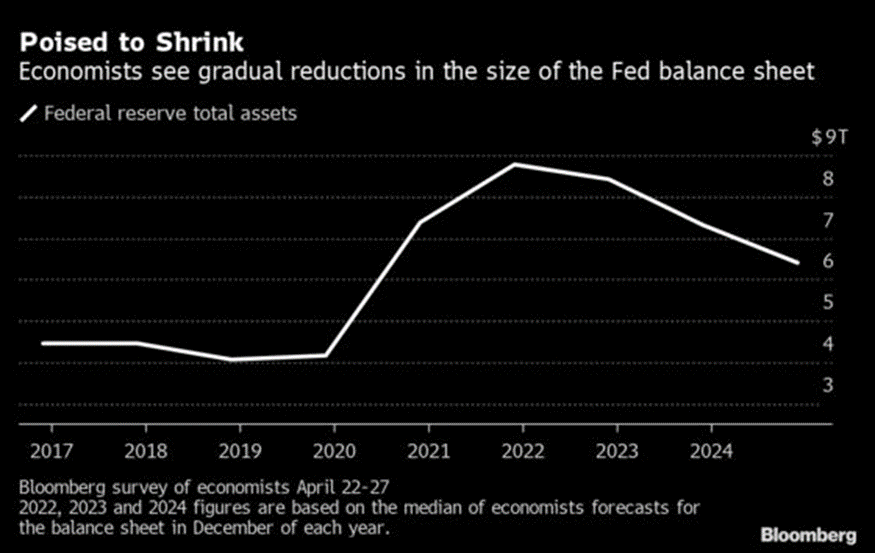
- In early May the Fed delivered the largest rate hike in more than 20 years — 50 basis points. By year-end the main scenario envisages the rate at 2.75%-3.25% versus 1.9% in the Fed projections Federal Reserve.
- The tightening of monetary policy could create the preconditions for a recession. By the end of Q1, GDP contracted by 1.4% against expectations. By the end of April, the consensus among experts was that the economy would decline over the next 24 months for about a third of analysts.


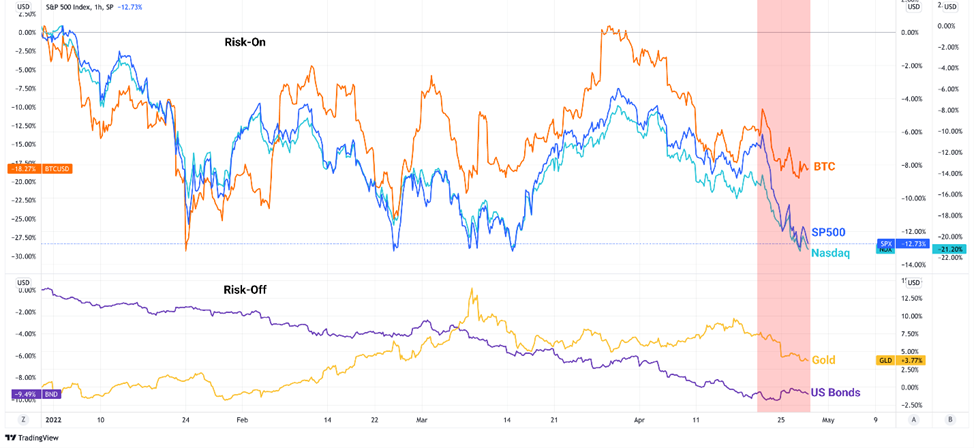
- In April the stock market resumed its downtrend. The Nasdaq Composite entered a bear phase, off its peak by 22.2%. The S&P 500 fell by 12.78%.
- In the last third of April, Bitcoin’s correlation with the stock market softened. Glassnode analysts noted a reduction in institutional outflows from crypto products and positive shifts in Bitcoin’s fundamentals.
- The key question for the crypto market will be the response to the expected tightening of dollar liquidity in the coming months. Some believe Bitcoin may not escape near-term shocks on traditional markets. For others, Bitcoin remains a hedge against further inflation pressures.
Market sentiment, correlations and volatility


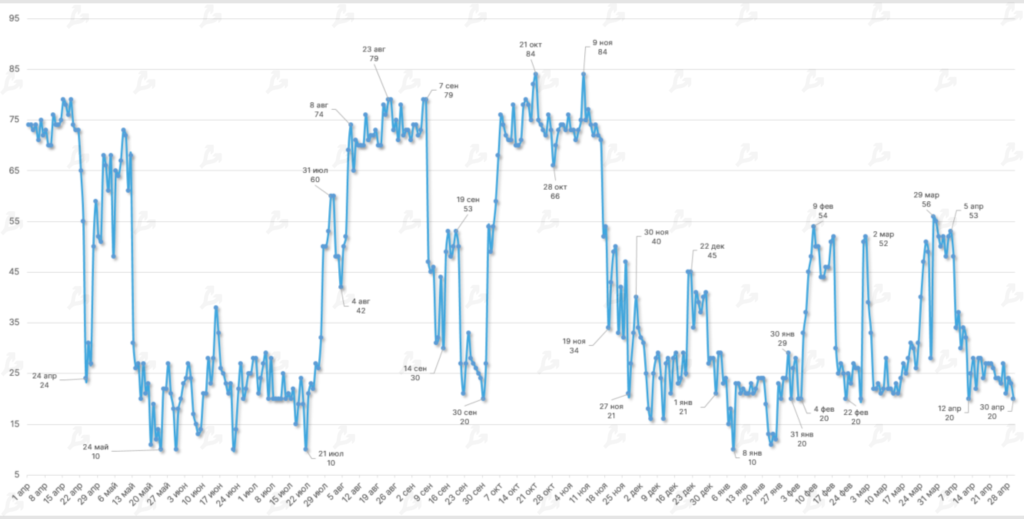


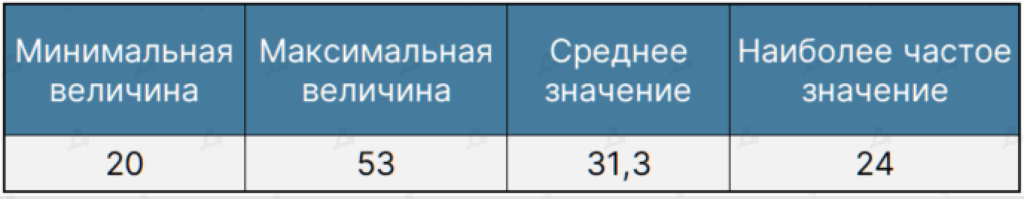
- In April market sentiment was predominantly bearish. The Fear and Greed Index did not exceed neutral territory, oscillating between 20 and 53.
- For most of the month the indicator lingered in the ‘extremes of fear’ zone. This trend intensified when Bitcoin prices breached a local low below $39,000.


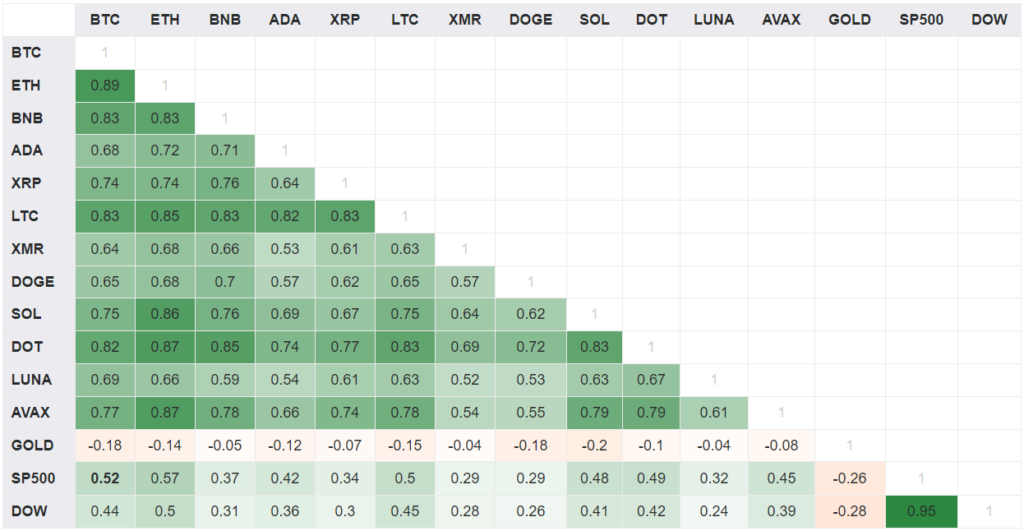
- Throughout April, the statistical correlation of Bitcoin with the US stock market strengthened. Correlation with the S&P 500 stood at 0.52, with the Dow at 0.44. In March the figures were 0.48 and 0.39 respectively. Arcane Research analysts attributed the situation to expectations of tighter monetary policy by the Fed.
- Ethereum’s linkage to the stock market was stronger (SPX 0.57; Dow 0.50).
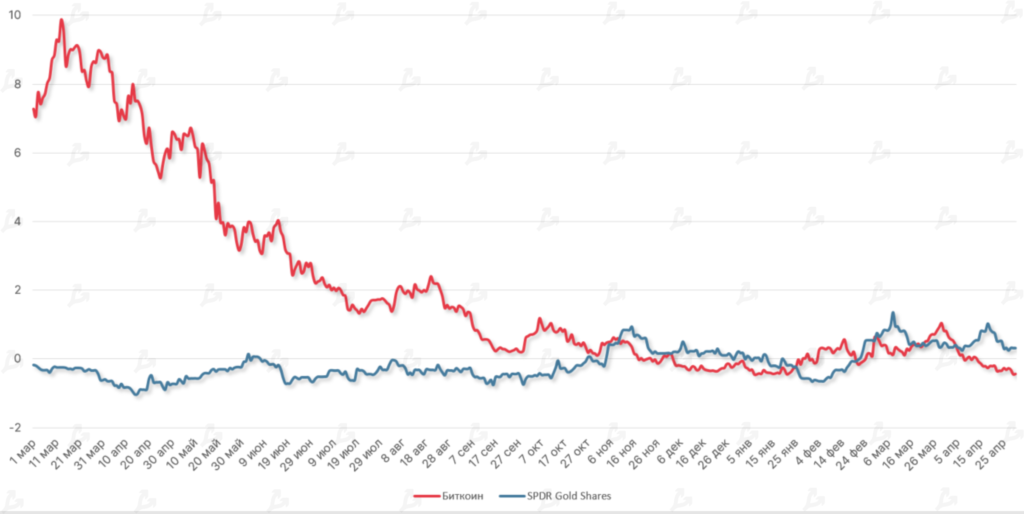
- Bitcoin and gold continued to move in opposite directions (-0.18). Compared with March’s -0.15, this trend intensified.


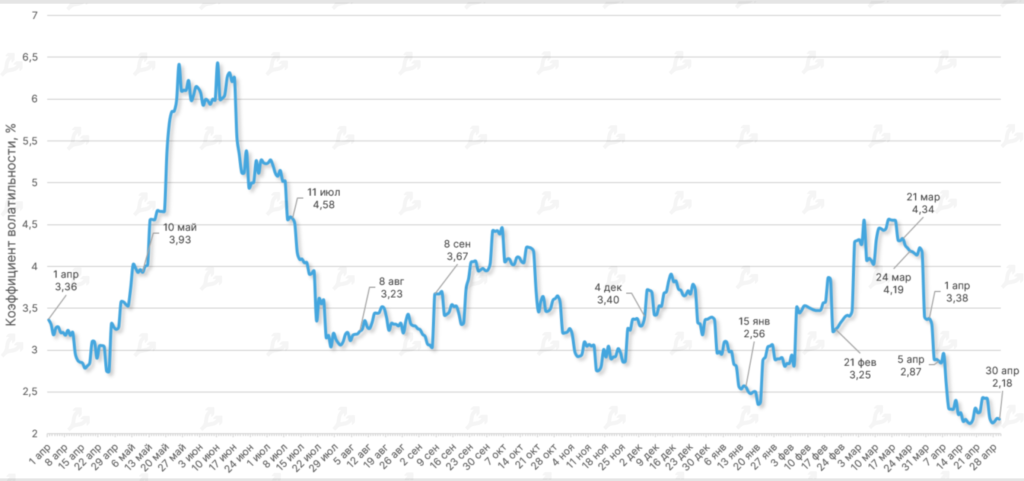


- In April, the average historical volatility value stood at 2.44%. Despite price swings, this was lower than in February (3.39%) and March (4.25%).
- The Sharpe ratio (using US two-year Treasuries as the risk-free asset) suggests relatively higher risk for Bitcoin investments. In April the asset again trailed gold ETFs on this measure.
On‑chain data


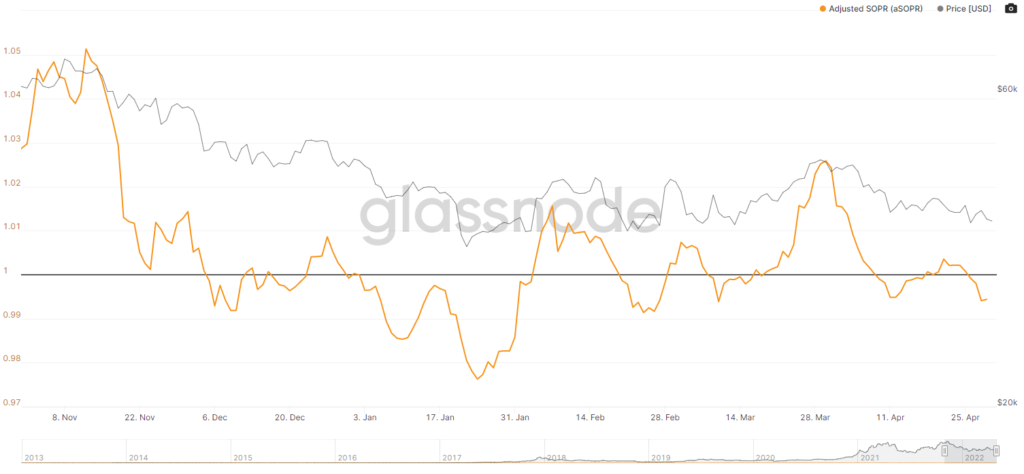


- Against Bitcoin’s correction in the first half of April, the aSOPR indicator (7 MA) fell below 1, remaining under that level for most of the month. This points to deteriorating market sentiment.
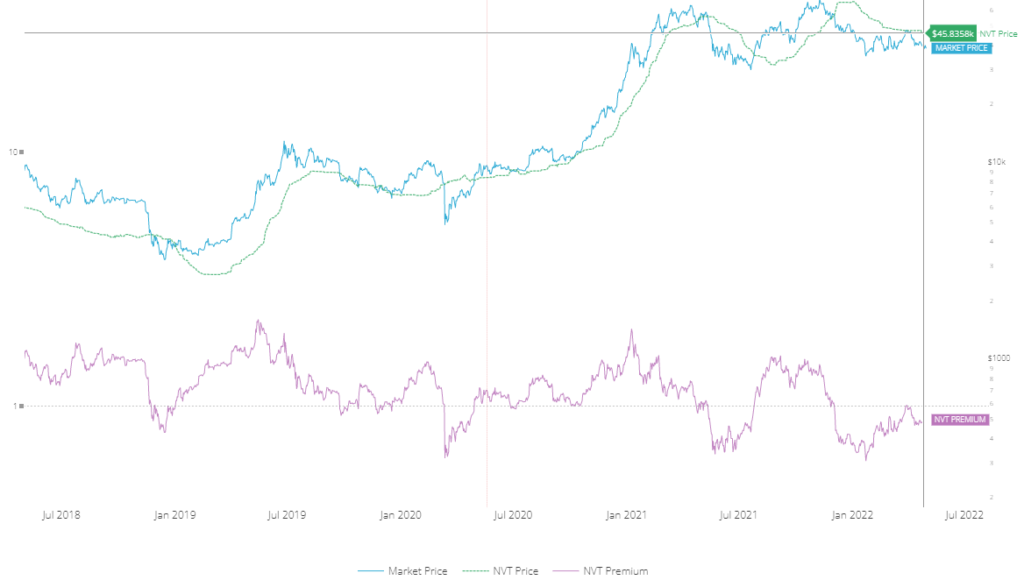
- Based on the NVT Price indicator, the fundamental price of Bitcoin sits around $45,000, about $7,000 above its market price. The first cryptocurrency is therefore undervalued at present.


- Since the activation of EIP-1559 in August 2021, Ethereum has burned over 2.2 million ETH. Of these, more than 137,000 were burned in April 2022.
- Compared with last month the burn rate accelerated — in March around 118,000 ETH were burned.
- On May 1, the Otherside metaverse by Yuga Labs launched. In the NFT sale‑related activity, the network burned more than 55,623 ETH in under 24 hours. For comparison: in the last 30 days the OpenSea marketplace burned about 21,790 ETH.
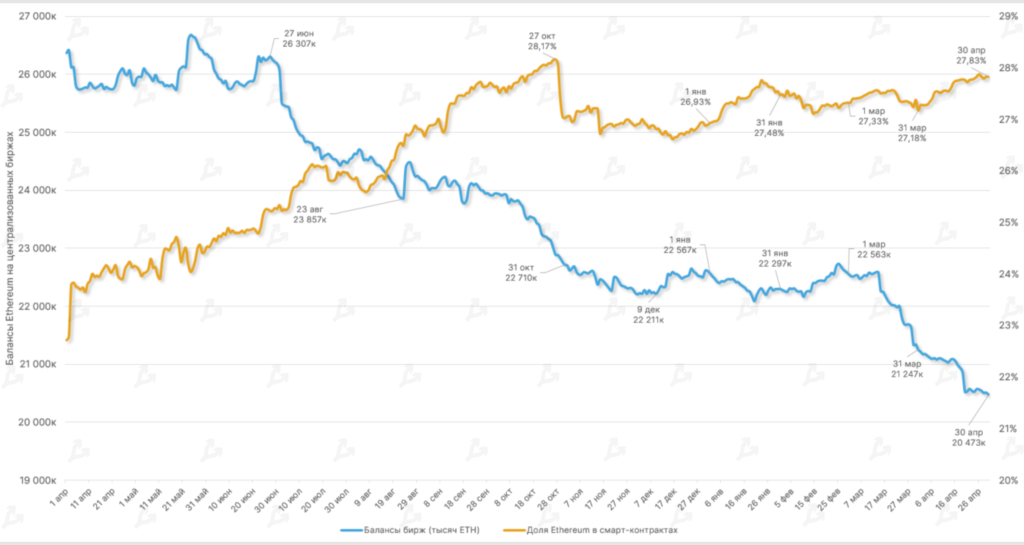
- In April Ethereum balances on centralised exchanges continued to decline — over 30 days the supply of ETH on such platforms fell by 774,000 coins.
- The share of ETH locked in smart contracts by DApps remained high. By month end it stood at 27.83% (27.18% in March).


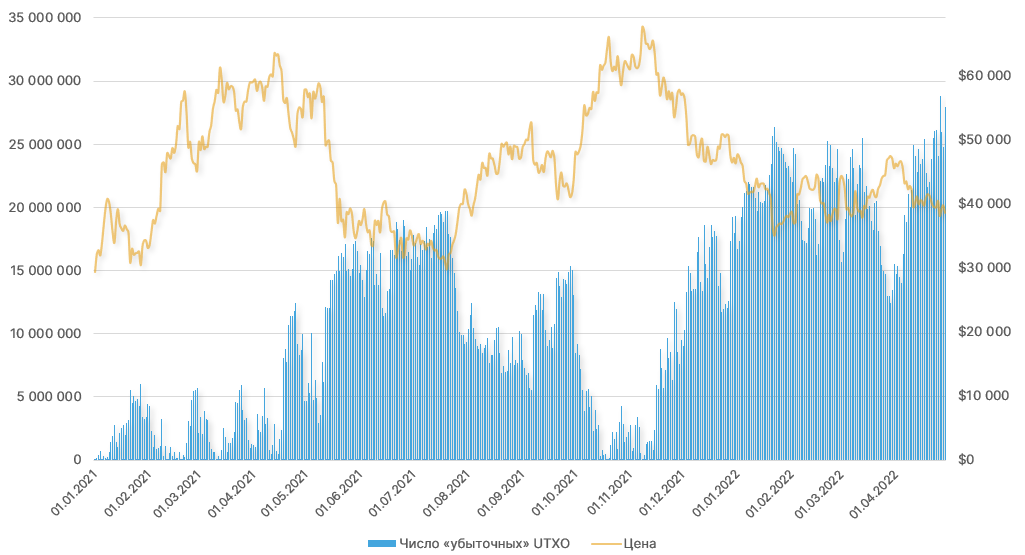
- Amid April’s price correction, the number of “unprofitable” UTXOs surged to levels last seen in July 2020. It appears many short-term investors are selling at a loss.
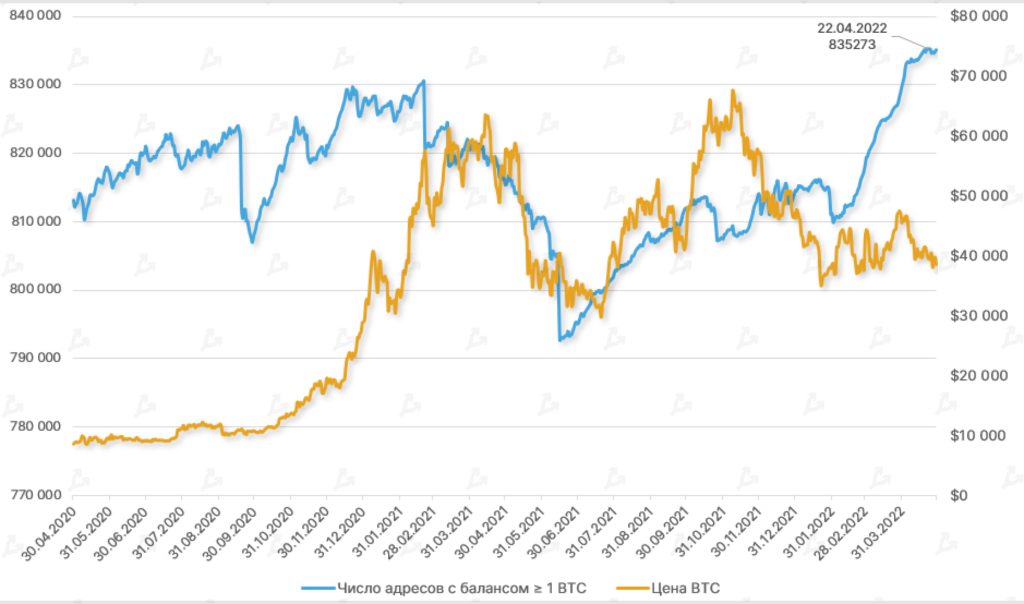
- In April the number of addresses with balance ≥ 1 BTC reached a new high. This may indicate ongoing mass adoption or capital flowing from sharply devaluing altcoins into the relatively stable Bitcoin.


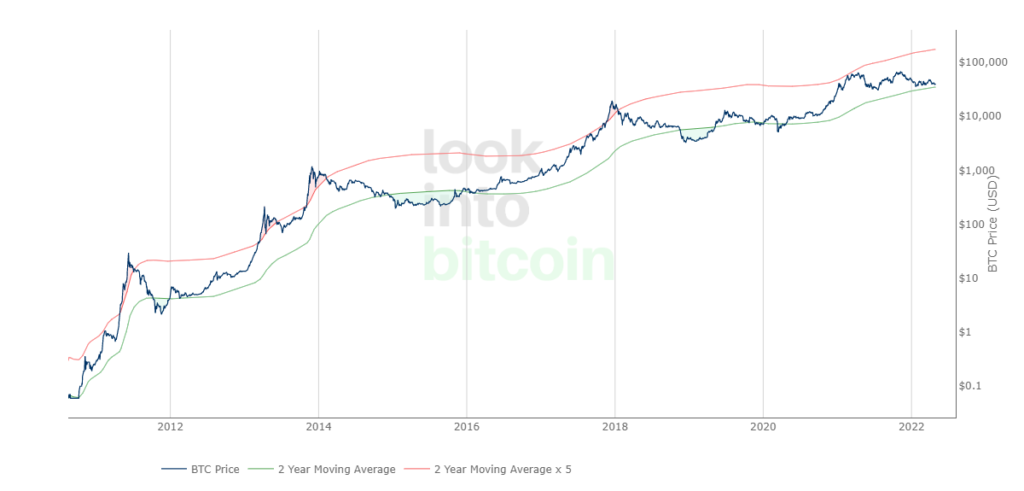


- The 2-Year MA Multiplier has inched toward the “green zone,” signalling an optimal period for long-term Bitcoin accumulation.
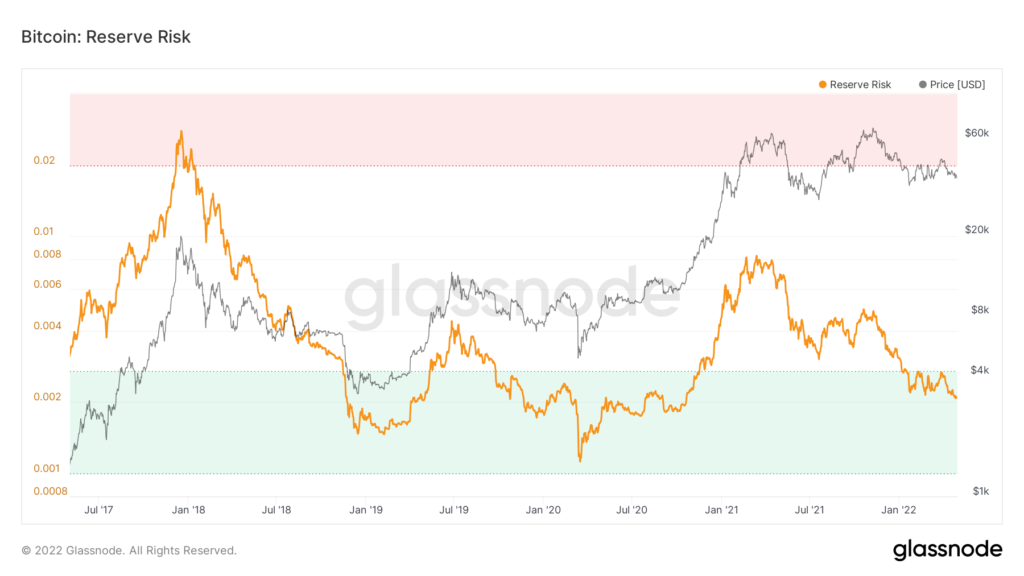
- Reserve Risk values in April continued their move deeper into the “green zone.” This indicates growing confidence among long-term investors in Bitcoin’s prospects and an increasingly attractive risk‑reward profile for them as a risk‑reward ratio.
Ethereum


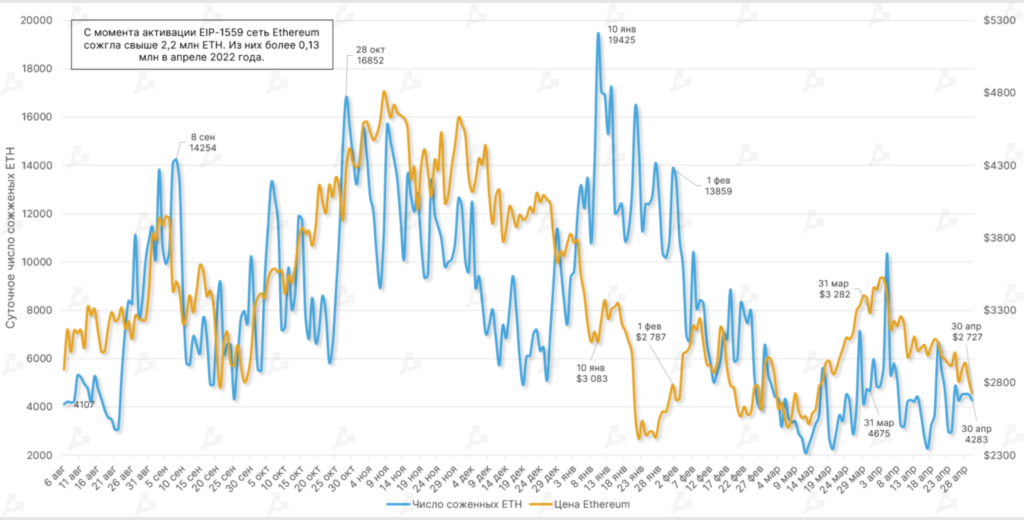


- Since activation of EIP-1559 in August 2021, the network has burned over 2.2 million ETH. Of these, more than 137,000 were burned in April 2022.
- Compared with March, the burn rate accelerated — in March roughly 118,000 ETH were burned.
- On May 1, the Otherside metaverse by Yuga Labs launched. In the NFT sales activity, the network burned over 55,623 ETH in under a day. By contrast, over the last 30 days the OpenSea marketplace burned about 21,790 ETH.
- In April Ethereum balances on centralised exchanges continued to fall — over 30 days the supply of ETH on such platforms declined by 774,000 tokens.
- The share of ETH locked in smart contracts of decentralized applications remained high. At month’s end it stood at 27.83% (27.18% in March).


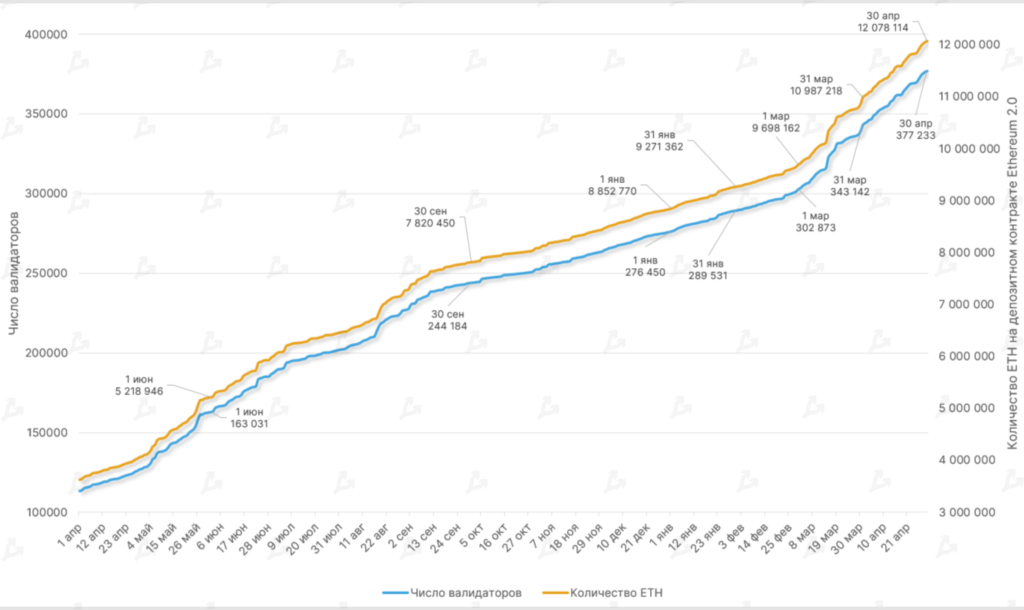

- By month’s end the ETH balance on the deposit contract surpassed 12 million ETH, rising by almost 10% over the month. For comparison, March’s growth was more than 13%.
- The number of validators on the Beacon Chain exceeded 377,000. In April, the number of participants interacting with Ethereum 2.0 rose by about 10%.
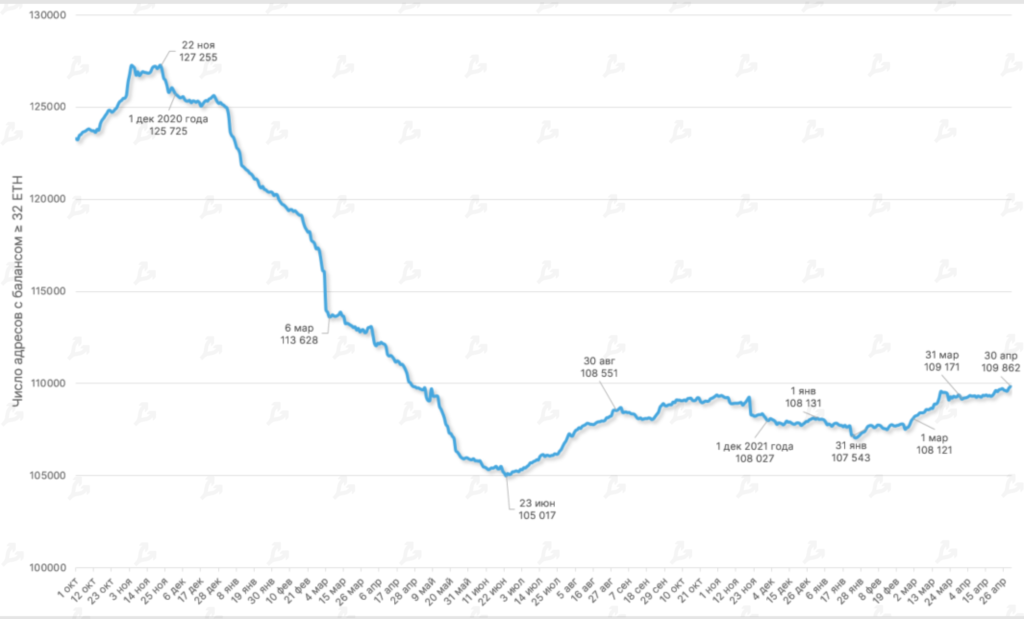
- The number of addresses with balance ≥ 32 ETH rose for the third month in a row. On 30 April the figure reached 109,862.
Lightning Network


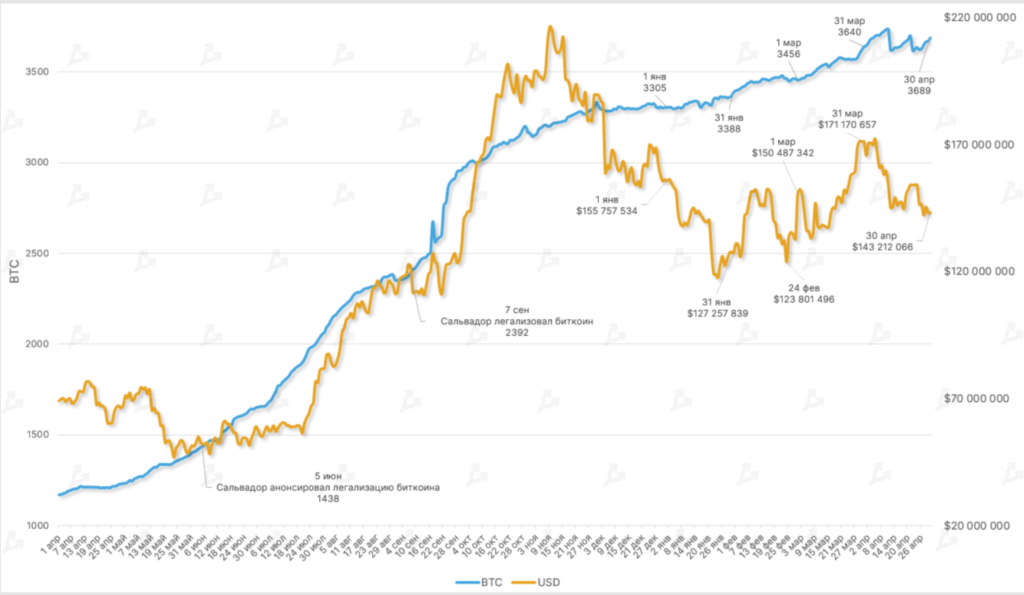


- In April the Lightning Network’s capacity showed modest growth, ending at 3,689 BTC (3,640 BTC at end-March).
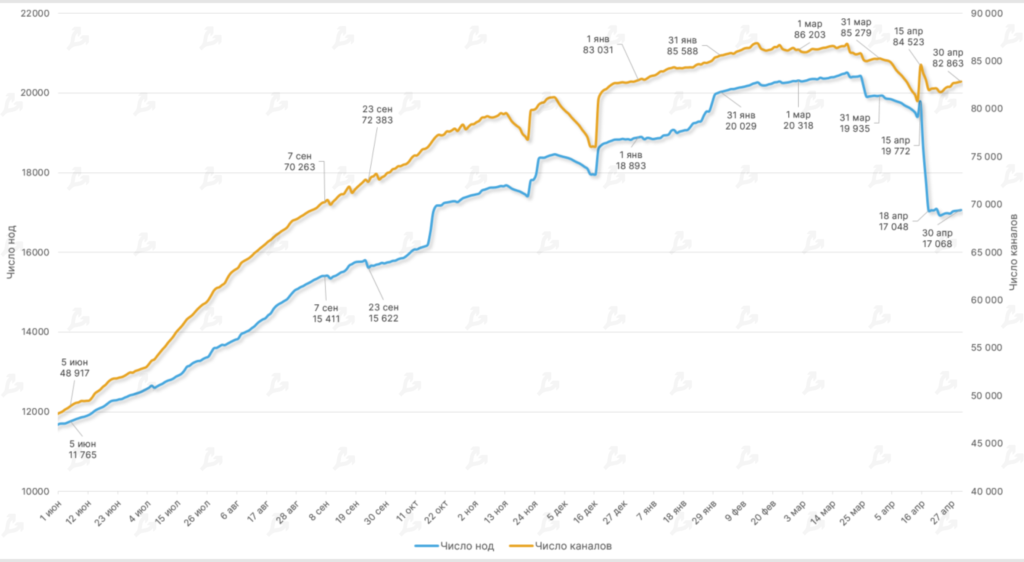
- The number of Lightning Network nodes and channels declined: nodes by 14% and channels by 3%. The negative trend persisted into April, aided in part by cloud hosting and by tools enabling channel reallocation among existing nodes, such as the Synonym solution from the Tether unit.
Mining, hash rate, fees


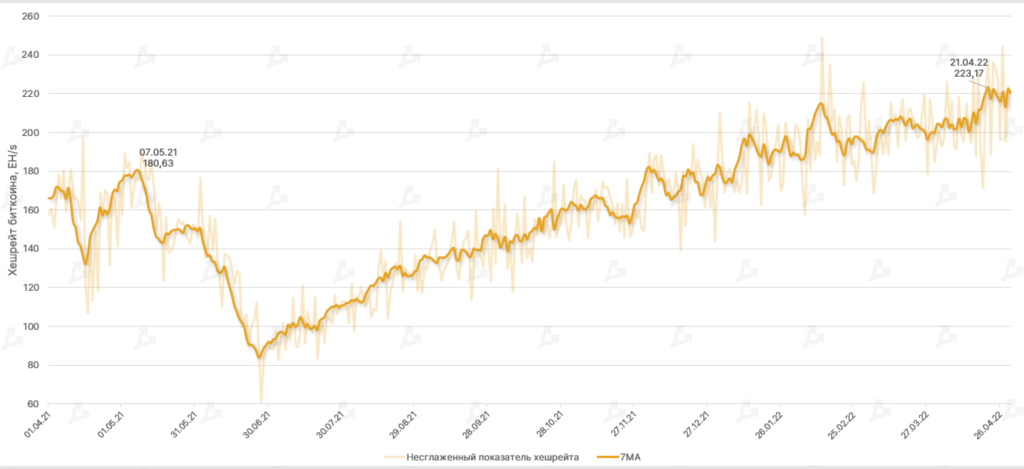


- In the second half of April the smoothed 7‑day moving average of Bitcoin’s hash rate reached a peak of 223.17 EH/s. The month saw a 10% rise.
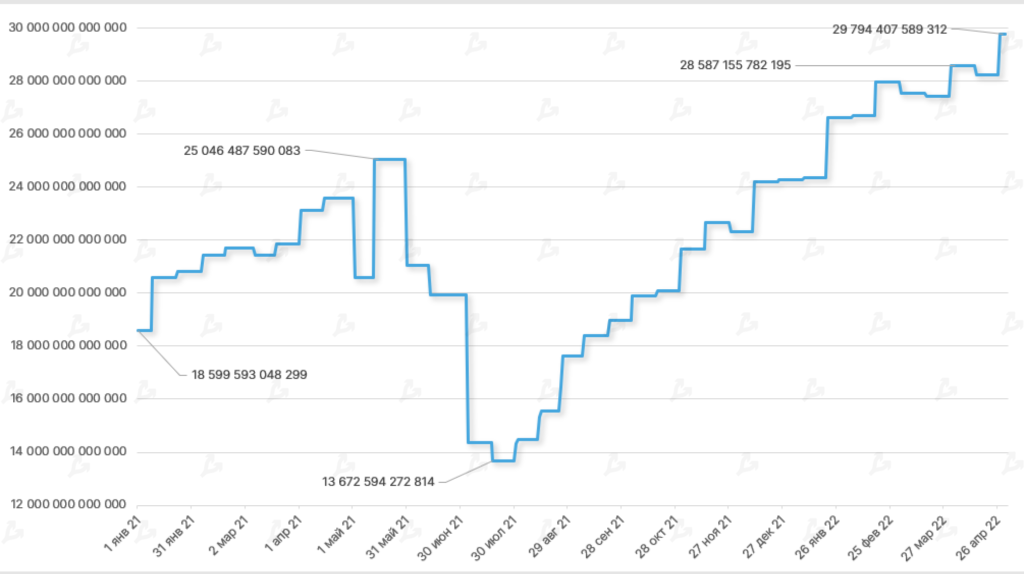
- Hash rate and mining difficulty for Bitcoin rose as well, with difficulty reaching a record 29.79 T.


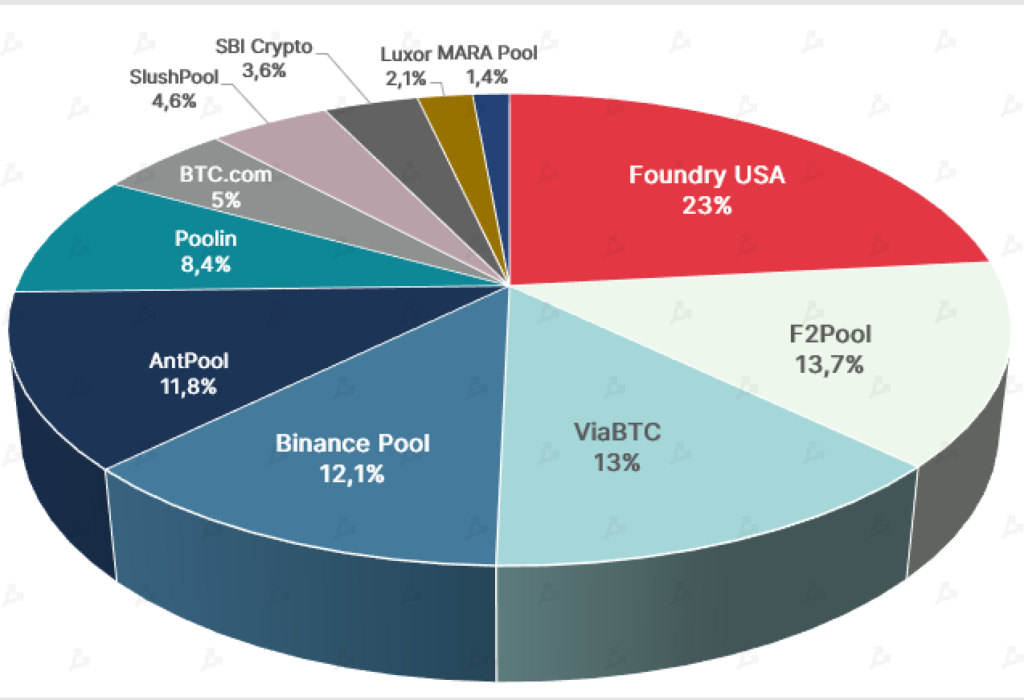


- In April improved the lead of mining pools. Foundry USA increased its share of total hash rate from 19.3% to 23%. During the same period AntPool fell from 14.3% to 11.8%.
- Arcane Research notes that public mining companies account for roughly a fifth of the total Bitcoin hash rate.
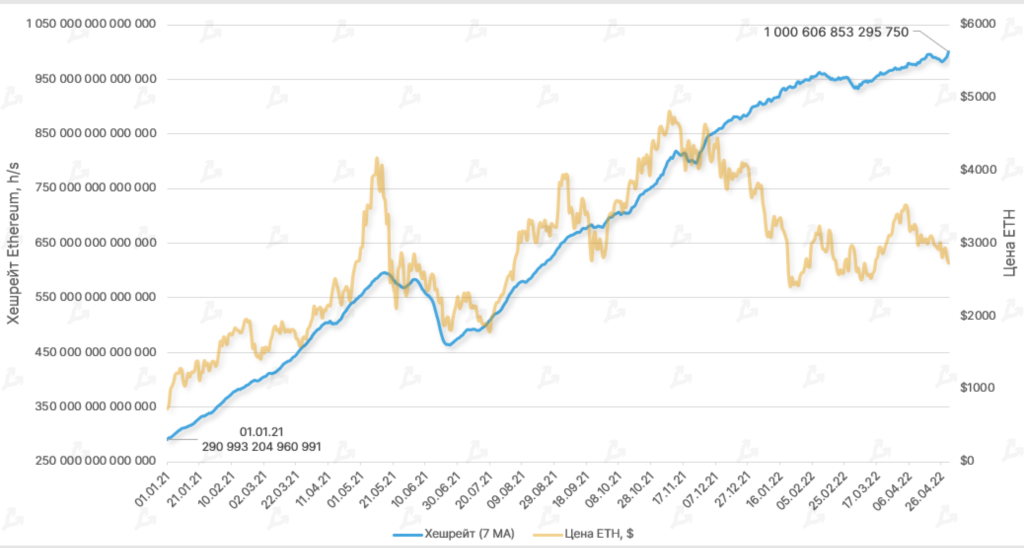
- Ethereum’s total hashrate also hit a historical high, exceeding 1000 TH/s. The rise in hash rate amid tumbling ETH price may signal market participants’ confidence in the long-term prospects of the second-largest cryptocurrency.


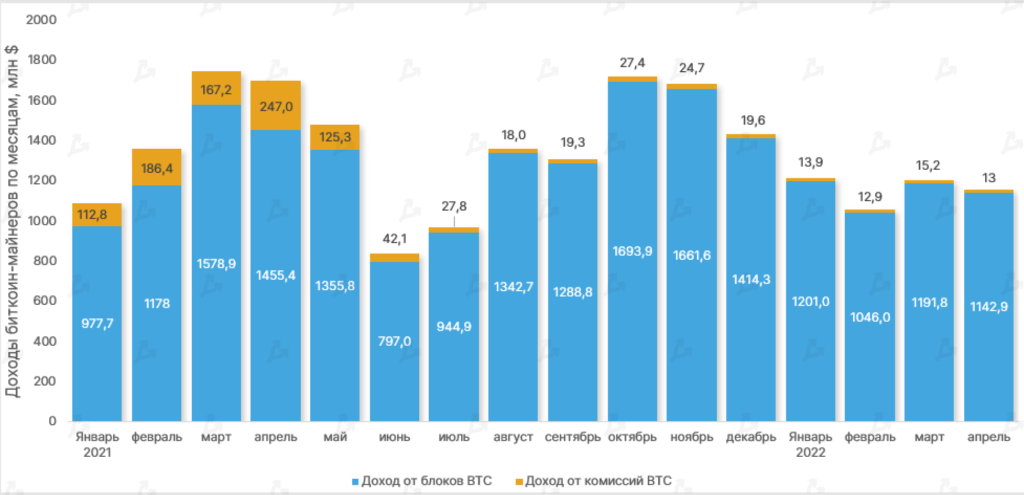


- In April Bitcoin miners’ total revenue declined by 4%, to $1.15 billion. The share of fees in revenue fell to 1.14%.
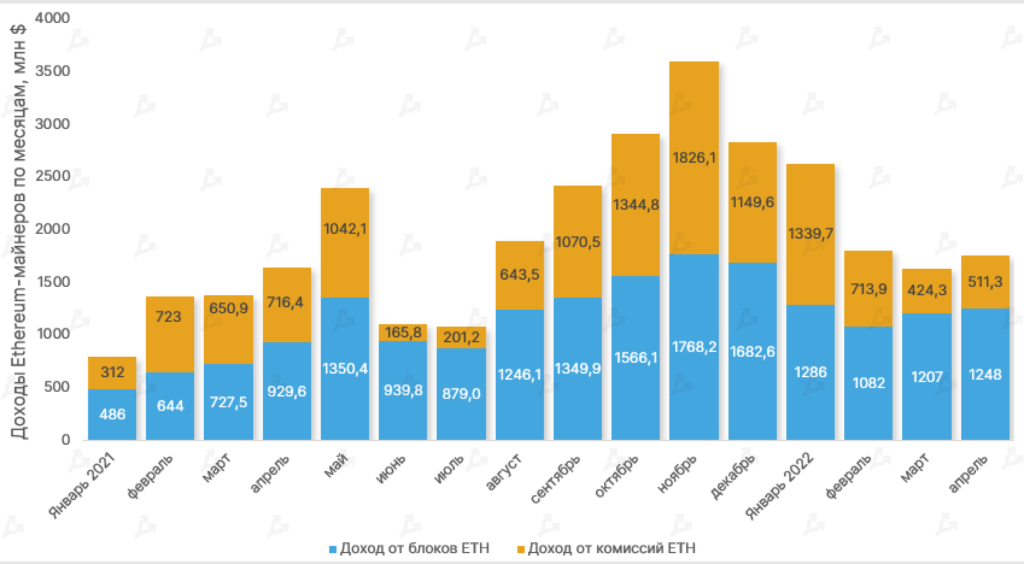
- In the same period Ethereum miners earned $1.75 billion — up 8% from March. Fees accounted for 41% of revenue.


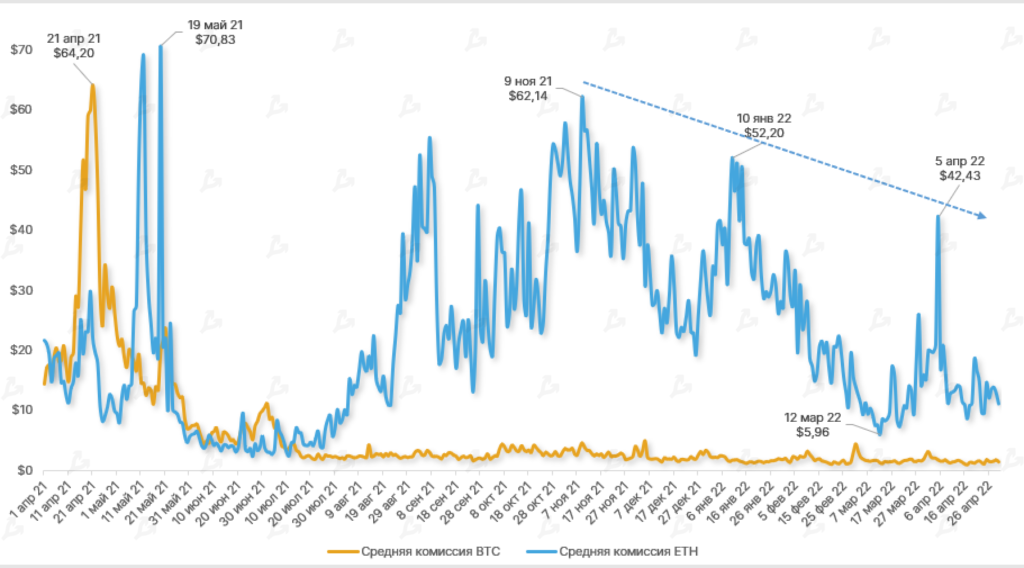
- The average fee per Ethereum transaction exceeded $40 at the start of April. Since last November, the trend has been downward.
- The average fee per Bitcoin transaction rarely exceeded $2 in the month. These low levels reflect low on-chain activity and rising use of the Lightning Network. The Taproot upgrade may also have contributed to greater efficiency and scalability.
Volume of trading


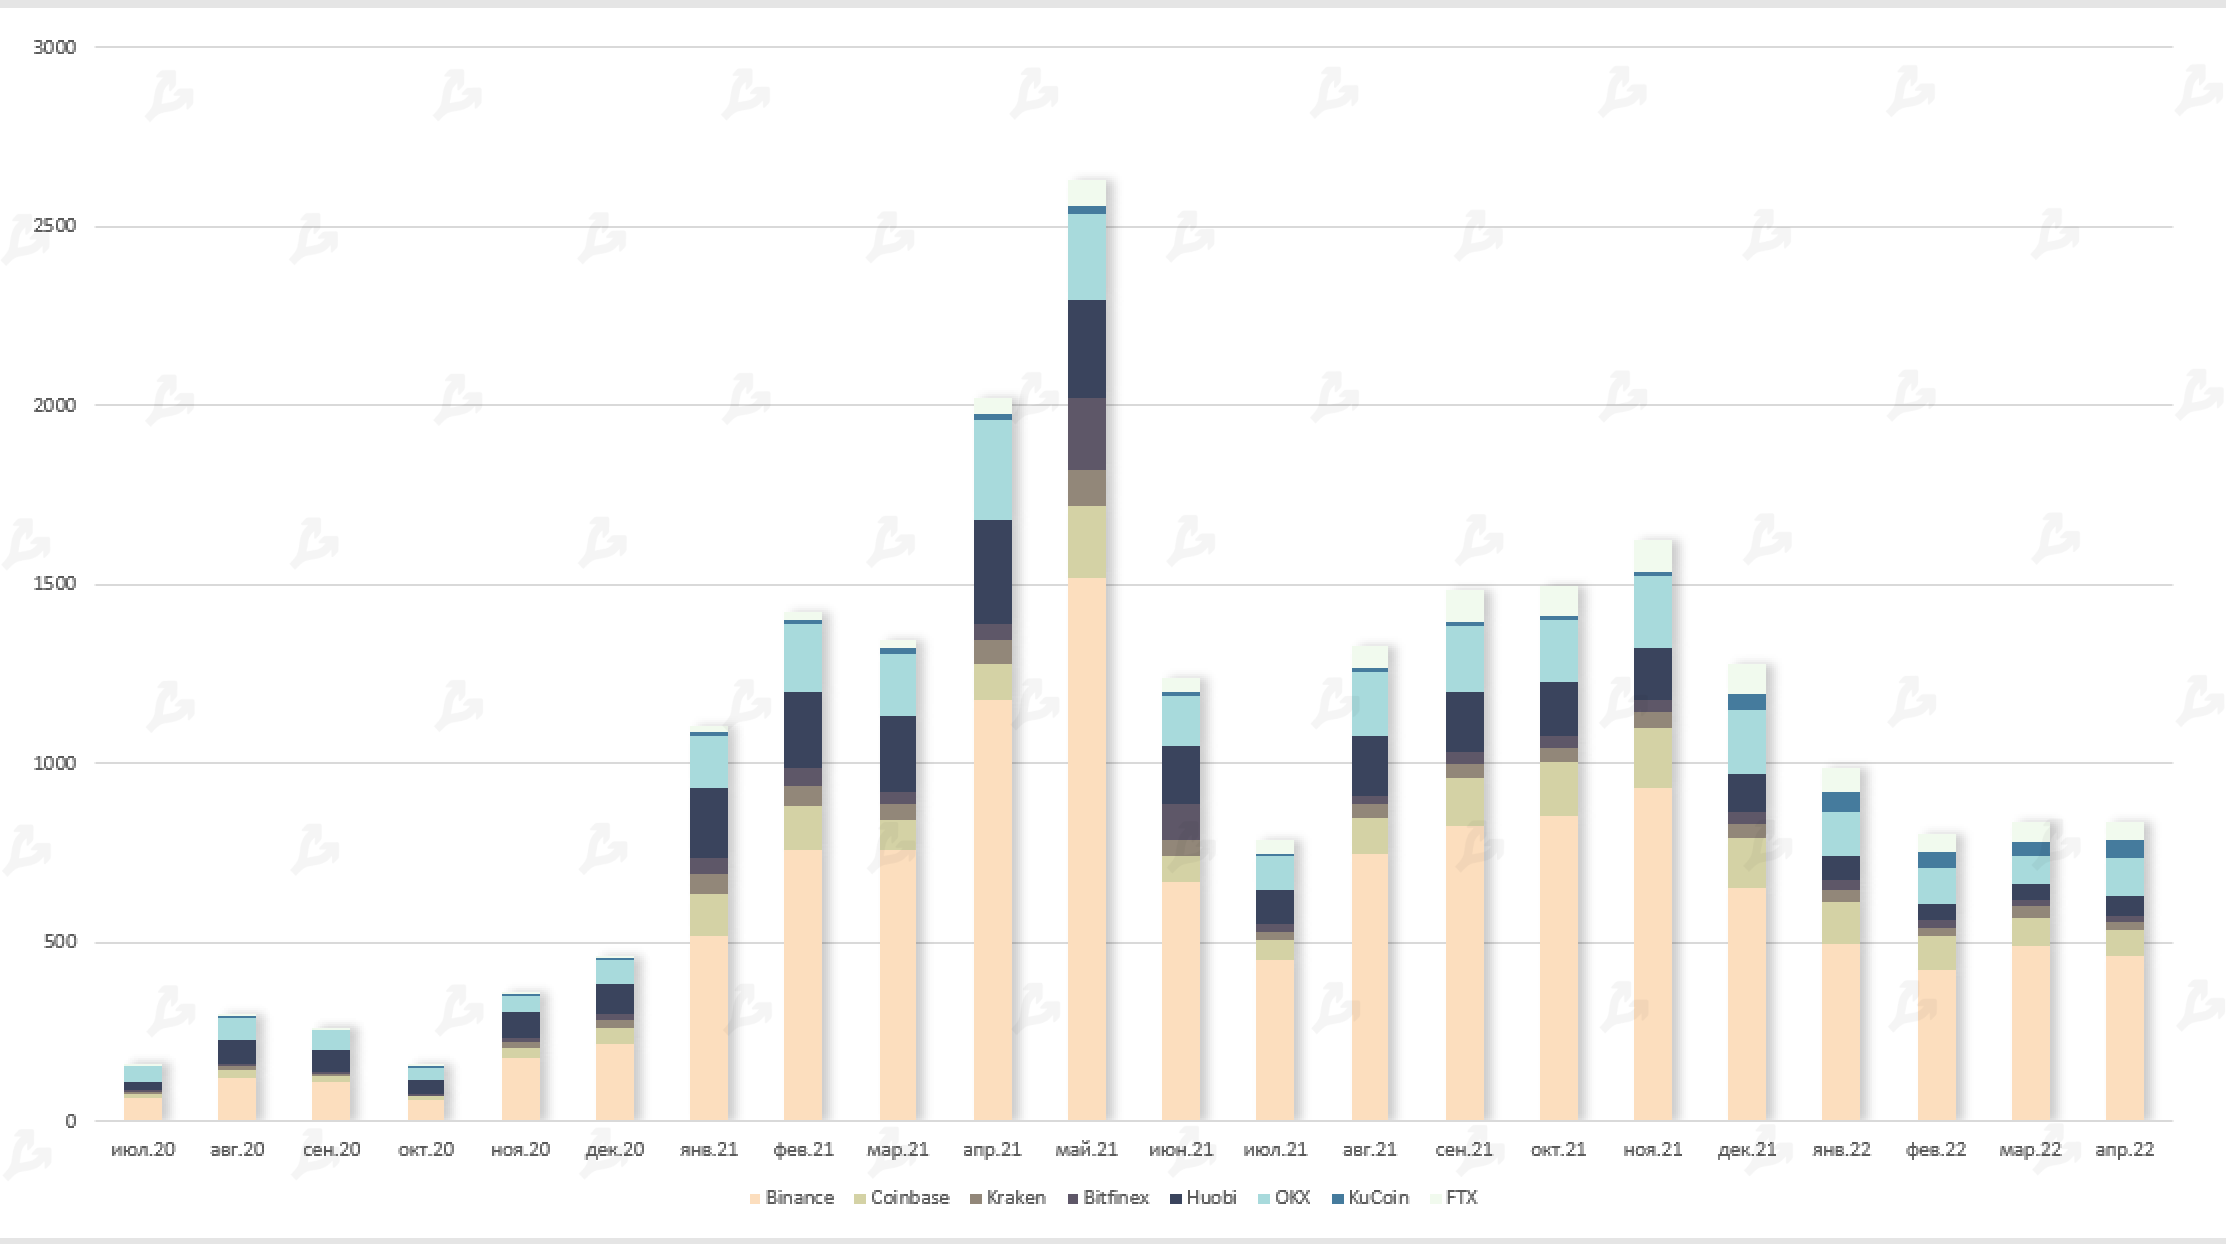
- In April trading volume on leading crypto exchanges stood at $835 billion, broadly in line with March.
- More than half of the total ($465 billion) was on Binance. OKX accounted for another $109 billion, while Coinbase handled $72 billion.
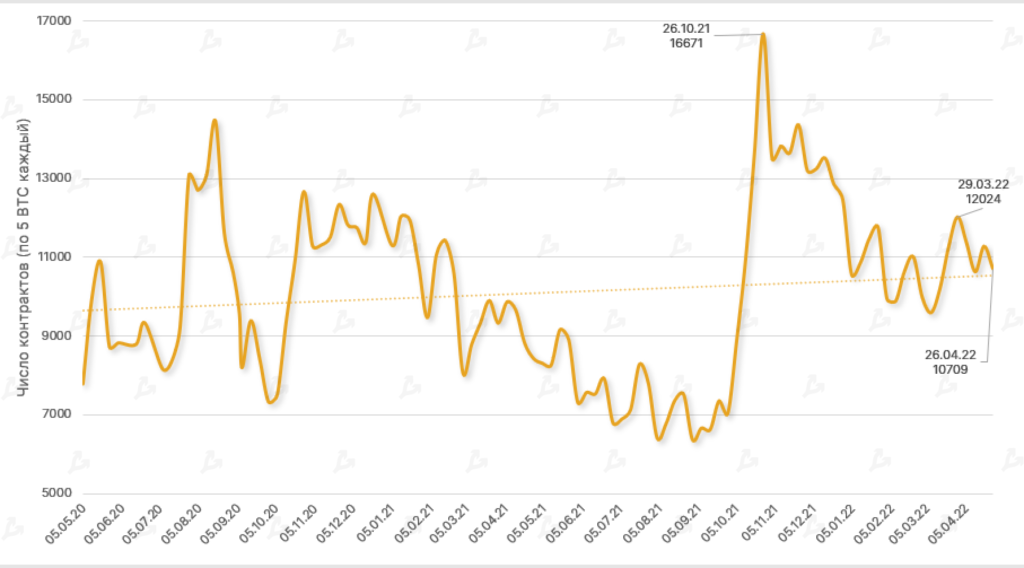
Futures and options


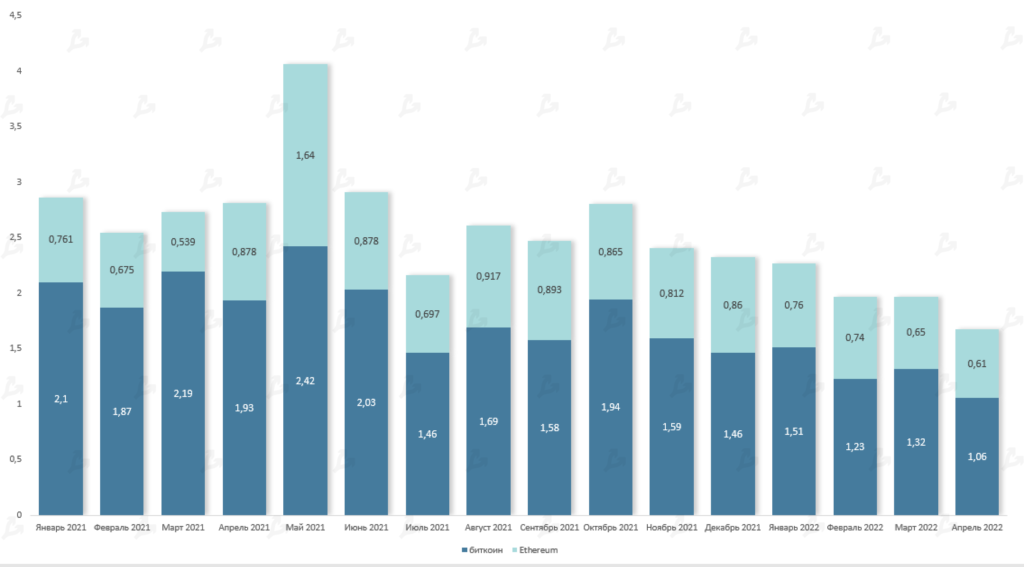


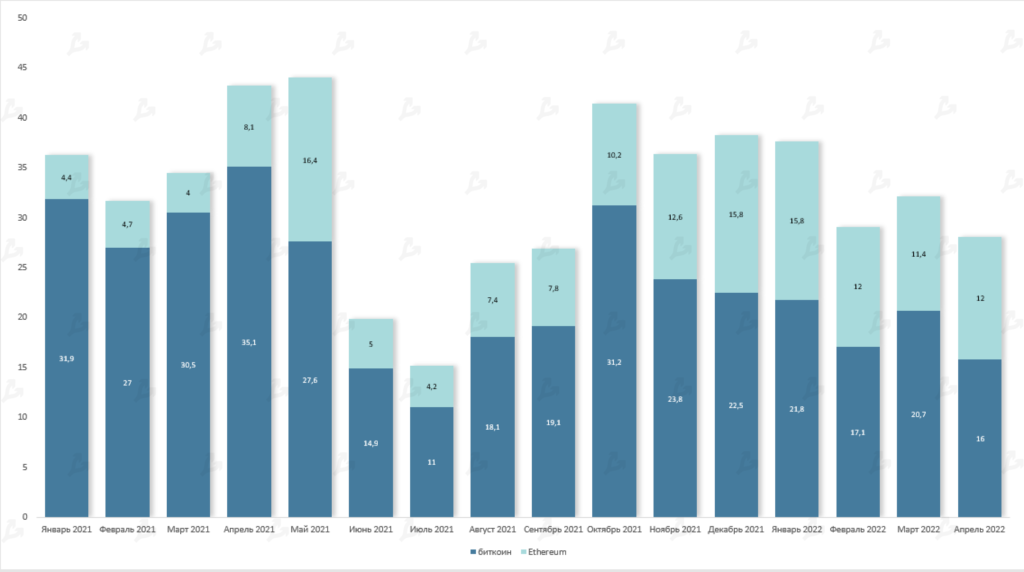
- From the end of last year the derivatives market has seen a decline in futures trading volumes for Bitcoin and Ethereum. In April volumes were $1.06 trillion and $0.61 trillion respectively.
- A similar pattern emerges in the options market. In the last month Bitcoin options turnover stood at $16 billion, Ethereum at $12 billion.
DeFi


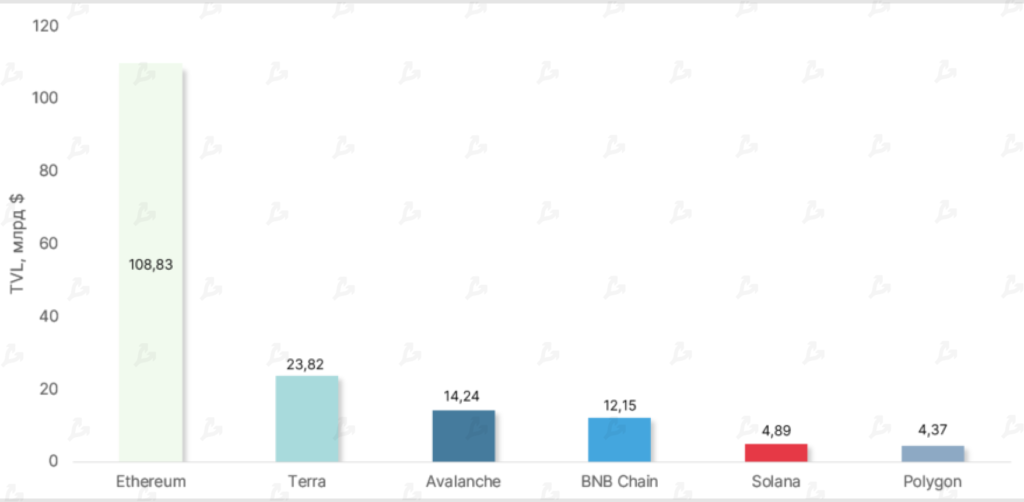
- In April the TVL in smart contracts of DeFi applications fell by 9%, to $208.04 billion. This reflects the ongoing market correction.
- All leading ecosystems posted declines. The exception was Avalanche, whose TVL rose by 37% during the month. One contributing factor was investments from Luna Foundation Guard and Terraform Labs of $200 million.
- The Ethereum ecosystem continues to dominate the sector’s total TVL. Even as dollar value fell, ETH-denominated liquidity on the network rose by 8.74% in April.


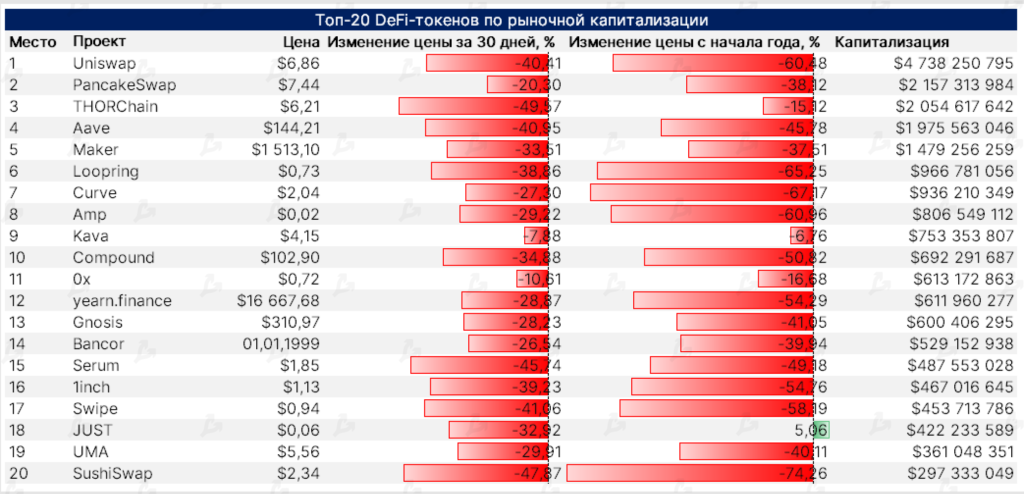


- Against the backdrop of a broad market correction, all top DeFi tokens were in the red.
- The worst performer was THORChain (RUNE), which rose by 118% last month but fell by nearly 50% in April.
- The SUSHI token, the native token of SushiSwap, dropped almost 48%. Since the start of the year the token has lost more than 74% of its value. Among other reasons was the departure of leading developers and executives after the Wonderland scandal. A restructuring was announced.
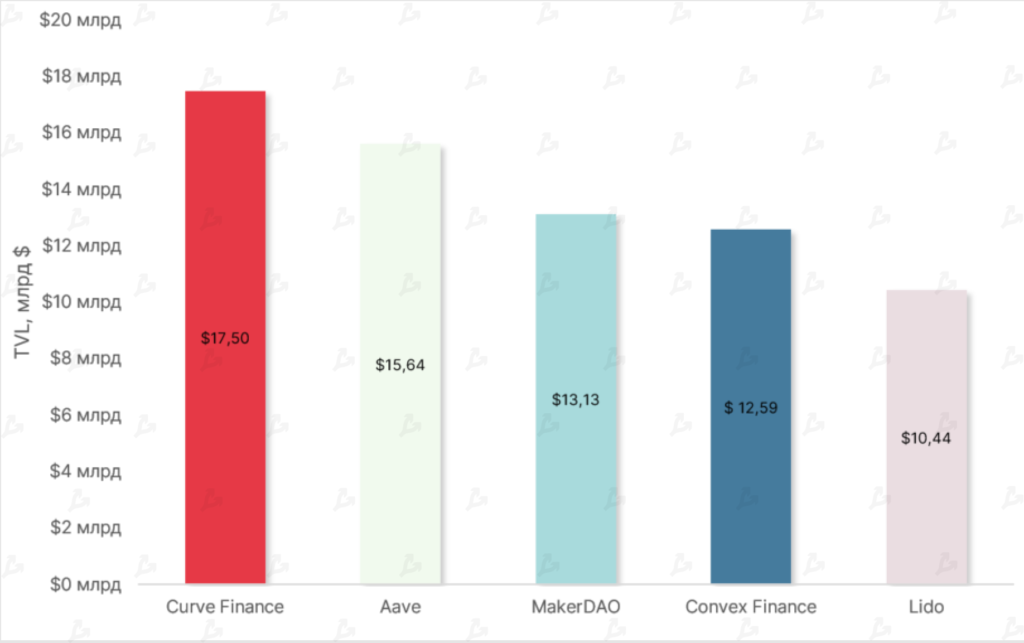
- Within Ethereum-based projects, Curve Finance retained leadership by TVL. In April Curve’s TVL declined by 5% to $17.50 billion. Aave ranked second with $15.64 billion locked in smart contracts.


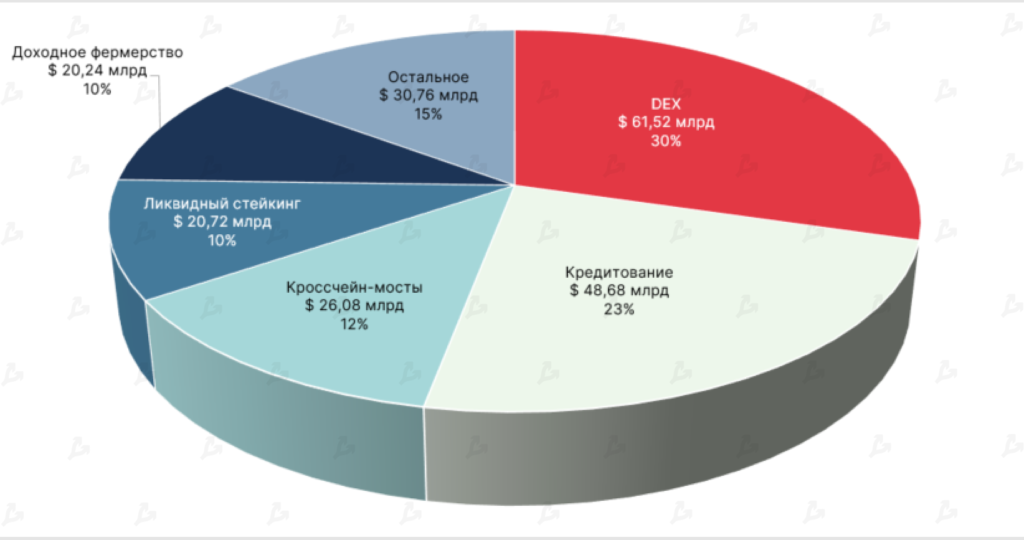
- The bulk of the TVL in DeFi is accounted for by decentralised exchanges — DEXes with smart contracts hold over $61 billion, about 30% of the total.
- Second place goes to lending services with TVL above $48 billion, and third are cross‑chain bridges ($26.08 billion).
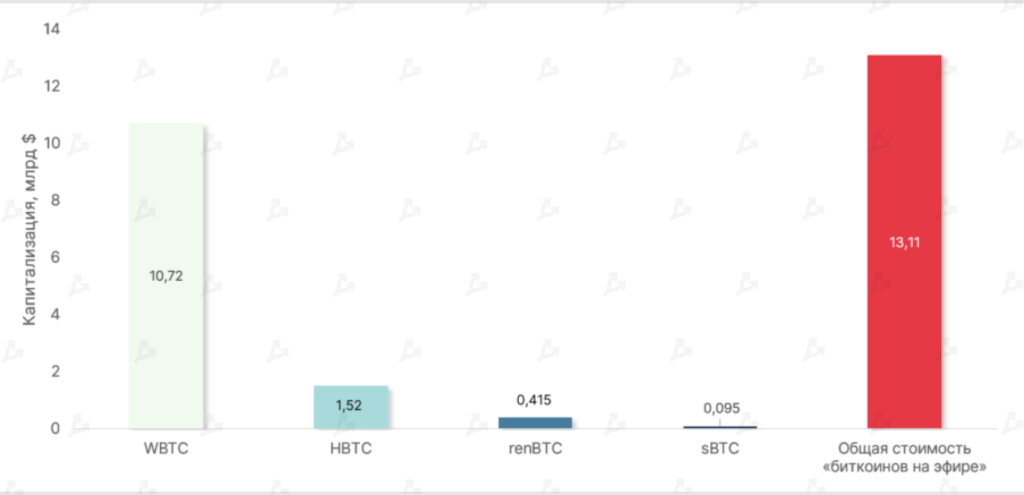
- In April the overall market capitalisation of “Bitcoin on Ethereum” reached $13.11 billion. WBTC remains the undisputed leader with a dominance index above 80%.
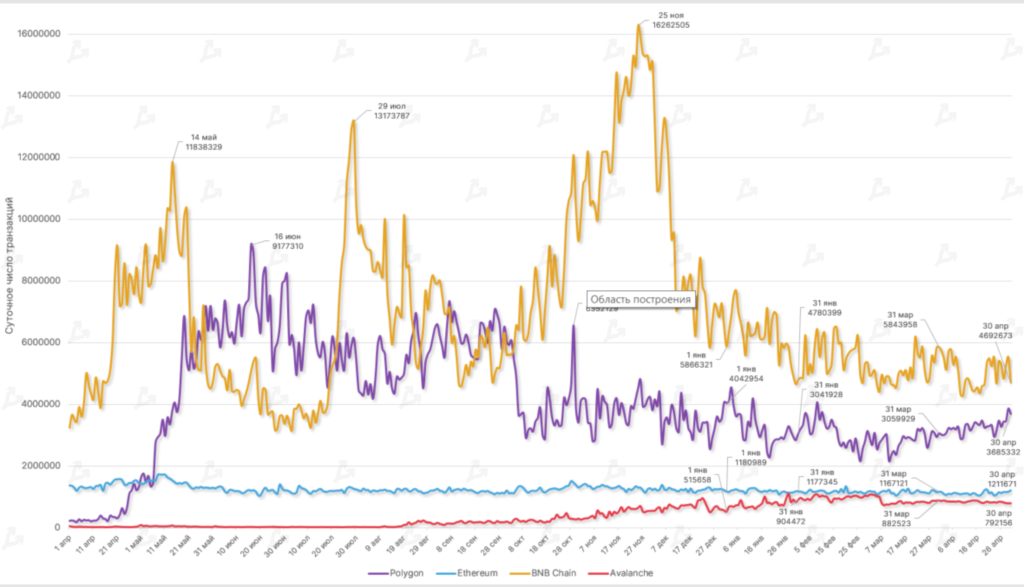
- In April cross‑chain in‑network activity declined in almost all networks considered. Avalanche activity fell 2.3%, Binance Smart Chain by 1.4%, Ethereum by 3.5%.
- In the Polygon network on‑chain activity rose by nearly 15%. On average the network processed about 3,269,011 transactions per day.
DEX and L2


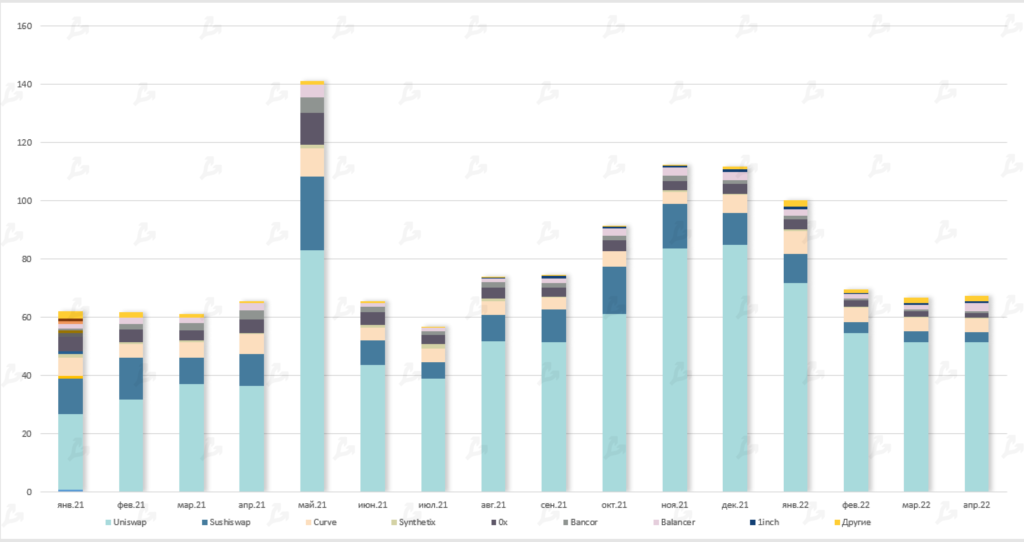
- Volume on decentralised platforms rose to $67.5 billion in April.
- Uniswap remained the leader with $51.4 billion.
- Amid declines in major protocols — SushiSwap, Synthetix, 0x — users turned to new platforms — DODO and ShibaSwap. A notable surge was recorded by Balancer (from $1.7 billion to $2.9 billion) after the launch of a new profitable farming program with the veBAL token.


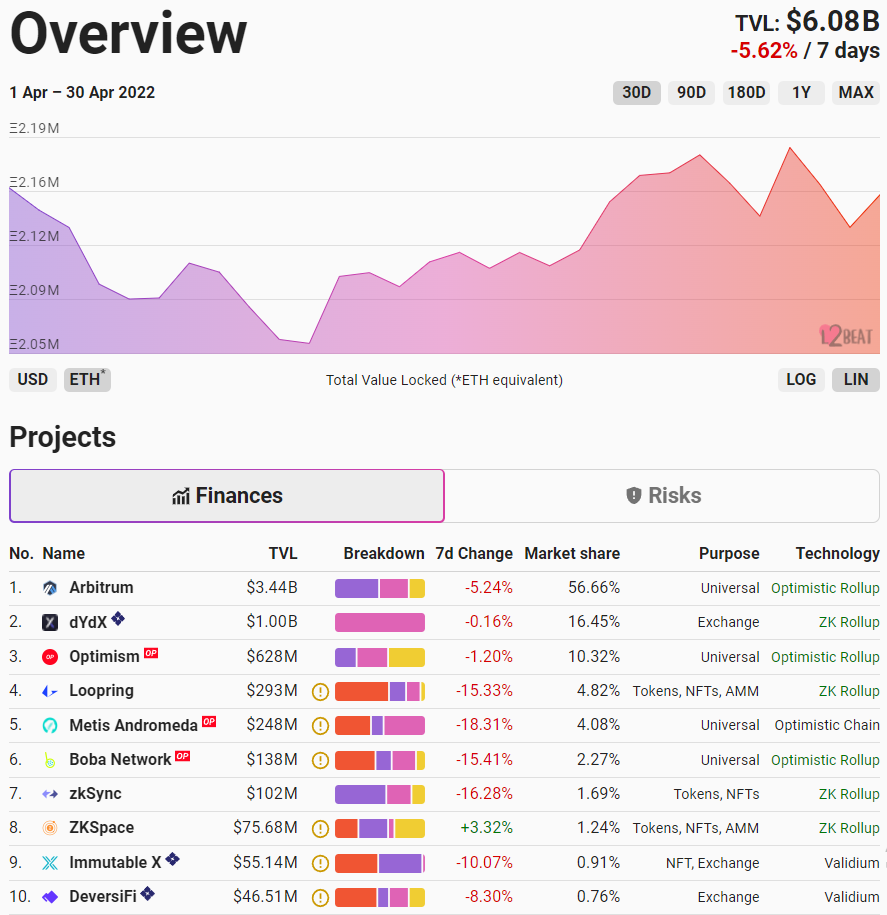


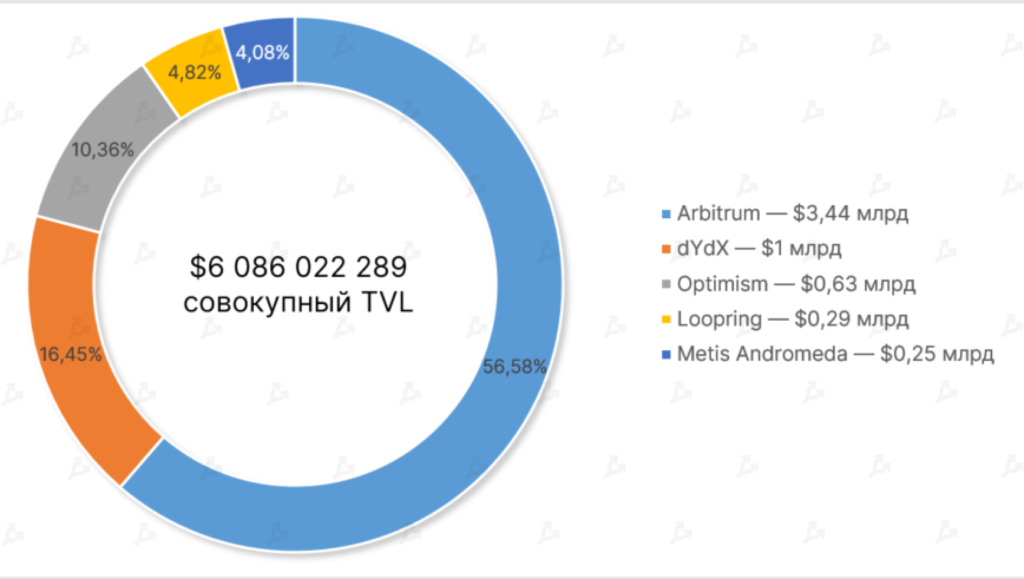
The volume of locked funds in L2 solutions remained flat in April, with the dollar value of TVL stabilising as Ethereum’s price fluctuated.
Stablecoins


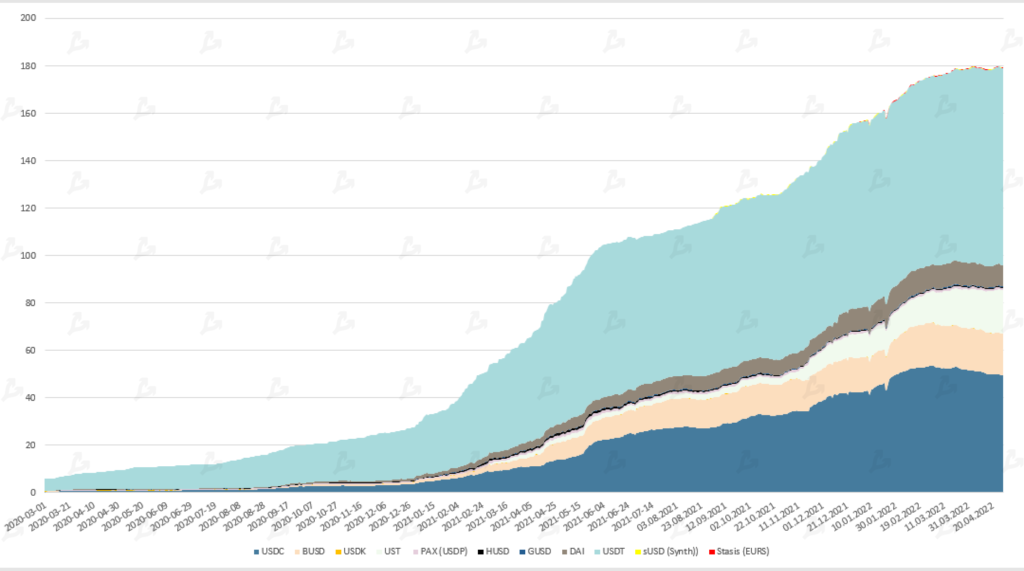
- Total stablecoins’ market capitalisation remained around $179 billion.
- Of those issued, only USDT (from Tether) and the algorithmic Terra stablecoin UST saw increases (from $82 to $83 bn and from $16 to $18 bn, respectively), allowing UST to overtake BUSD. For most other stablecoins, issuance declined, including BUSD and USDC.
- The trend toward algorithmic stablecoins gathered pace. In April Near protocol NEAR launched USN; Justin Sun announced a forthcoming USDD on Tron.
NFT and GameFi


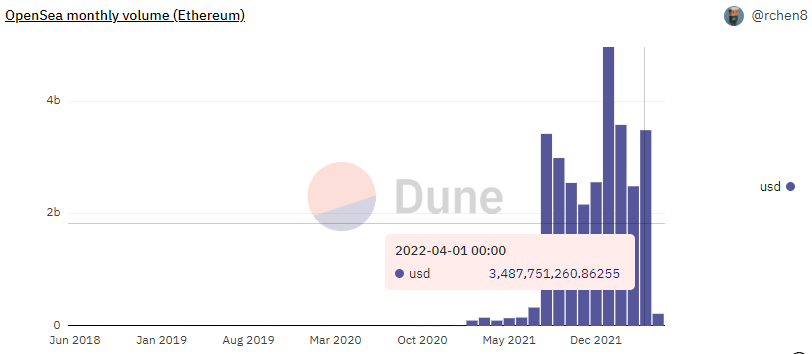


- In April interest in NFTs and Ethereum- and Solana-based collections revived. The drivers were launches of new projects and integrations in existing products.
- The OpenSea volume approached $3.5 billion. In April the leading project acquired NFT aggregator Gem, integrated MoonPay’s NFT purchase solution and added popular collections from STEPN and Moonbirds.
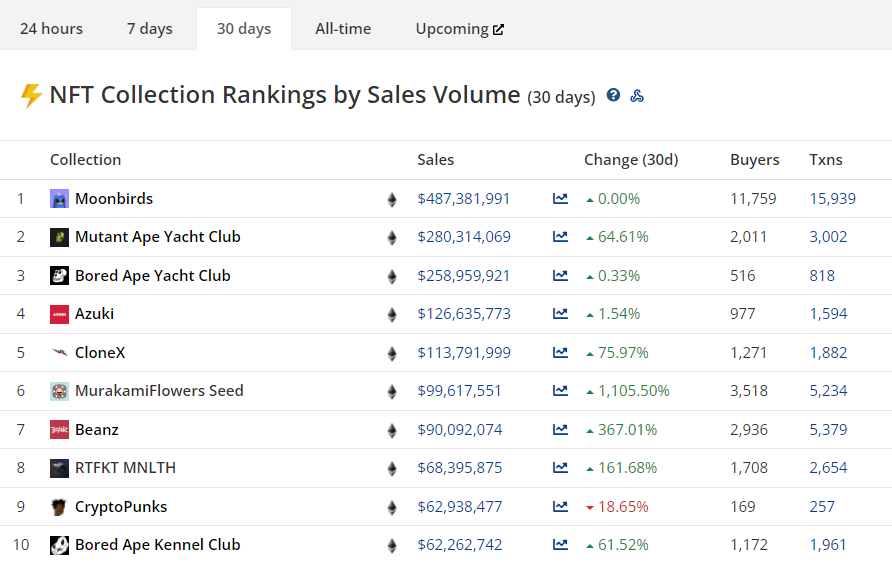
- Moonbirds quickly drew attention and ranked among the best-selling OpenSea collections; the collection’s floor price rose to 36 ETH, and total NFT volume neared $500 million.
- In April Coinbase launched a beta NFT marketplace using 0x technology. The launch boosted ZRX’s price by more than 50% on its first day.
- At month’s end the creators of the NFT collection Bored Ape Yacht Club again drew attention to the APE token, announcing the Otherside metaverse and selling 55,000 virtual land parcels for APE. APE peaked at $27 shortly before the sale. The sale on May 1 triggered network congestion on Ethereum. Afterward APE fell about 30%.
Activity of major players


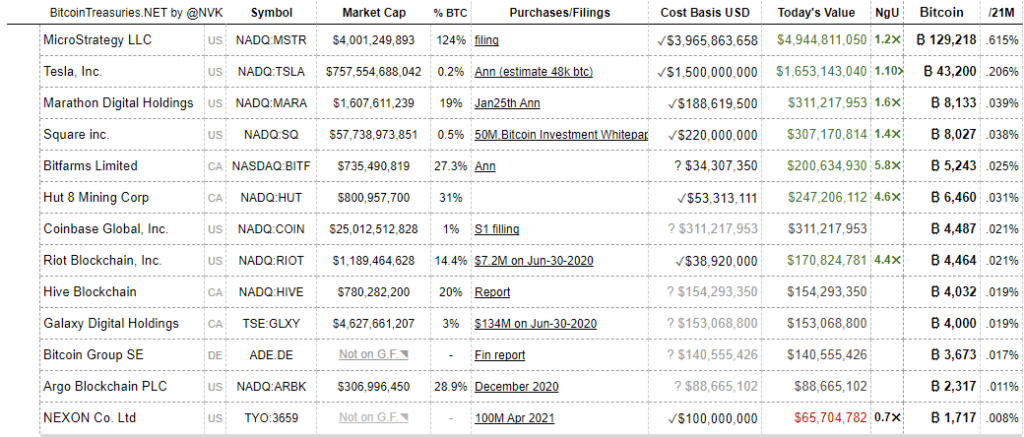
- MicroStrategy strengthened its leadership among public companies holding digital gold. It held 129,218 BTC (about $4.94 billion as of 1.05.2022).
- In early April MicroStrategy unit MacroStrategy acquired 4,167 BTC. CEO Michael Saylor described the strategy of buying and holding Bitcoin as successful. He said MicroStrategy would continue to invest aggressively in the first cryptocurrency.
- On Luna Foundation Guard (LFG) Bitcoin wallet there were 42,530.82 BTC — up 38.4% from a month ago. Total reserves of LFG (including USDC, LUNA and USDT) stood at $2.07 billion.