


Bitcoin chart forms a ‘death cross’
Peter Brandt forecast the cryptocurrency falling to $58,000
The price of digital gold failed to hold above a key level and slipped back into the range that has contained it for the past two months. Trading veteran Peter Brandt forecast a drop to $58,000.
58k to $62k is where I think it is going $BTC
If it does not go there I will NOT be ashamed, so I do not need to see you trolls screen shot this in the futurepic.twitter.com/NDOuSrqLwa — Peter Brandt (@PeterLBrandt) January 19, 2026
Meanwhile, Keith Alan, co-founder of Material Indicators, spotted a “death cross” on bitcoin’s chart.
If you were caught off guard by the Bitcoin selloff, you simply haven’t been paying attention to the right things.
This move had nothing to do with narratives. We’ve seen it developing in the charts, and have been talking about it for over a month.
Historically, a Death Cross… pic.twitter.com/xmO1Hl90qe
— Keith Alan (@KAProductions) January 19, 2026
He said the pattern formed when the 21‑week simple moving average (SMA) crossed below the 51‑week. Historically, that has signalled proximity to a macro bottom.
The next key support could be the 100‑week SMA near $86,900, he added.
On January 20th, before Wall Street opened, bitcoin tried to test $90,000 but failed as fears of a trade war between the US and the EU grew.
The trader known as Daan Crypto Trades said the “breakout failed”, shifting focus to the 2026 yearly open around $87,000 as potential support.
$BTC Now fully back into the ~$84K-$94K range it has spend the past 2 months in already.
Breakout failed and doesn’t make for a pretty look now.
Been talking about that yearly open likely being taken out at some point as it’s rare to see no wick below on the yearly candle.
So… pic.twitter.com/xn3HwnCMHr
— Daan Crypto Trades (@DaanCrypto) January 20, 2026
“I have already said that the yearly open will likely be taken out at some point: it’s rare to see a yearly candle without a lower wick. So, in my opinion, better to get it over with sooner rather than later. I’m still just watching, as I see no reason to trade this ‘chop’,” he wrote.
Other views and geopolitical risks
Traders on decentralised platform Derive.xyz and derivatives exchange Deribit put the odds of bitcoin falling below $80,000 by late June at 30%.
According to Sean Dawson, head of research at Derive.xyz, options positioning is skewed toward downside protection.
“Participants estimate a 30% chance of a drop below $80,000 by June 26, whereas the probability of a rise above $120,000 over the same period is just 19%,” he told CoinDesk.
The sell-off investors fear would push the price back to April’s lows. Then, digital gold fell to $75,000 after US president Donald Trump imposed tariffs on imports from other countries, roiling global markets.
Dawson sees geopolitics as paramount for assessing the next leg in cryptocurrencies. He said that risks to relations with Europe over the president’s plans to seize Greenland could lead to deeper losses.
“Rising geopolitical tensions between the US and Europe — especially around Greenland — raise the risk of a regime shift toward a higher‑volatility environment, which is not yet reflected in spot prices,” the expert explained.
Against the backdrop of Mr Trump’s threat to impose a 10% levy on imports from eight European countries from February 1st, the yield on ten‑year US Treasuries, considered the world’s safest asset, also jumped.
It rose to 4.28% — the highest since September 3rd.
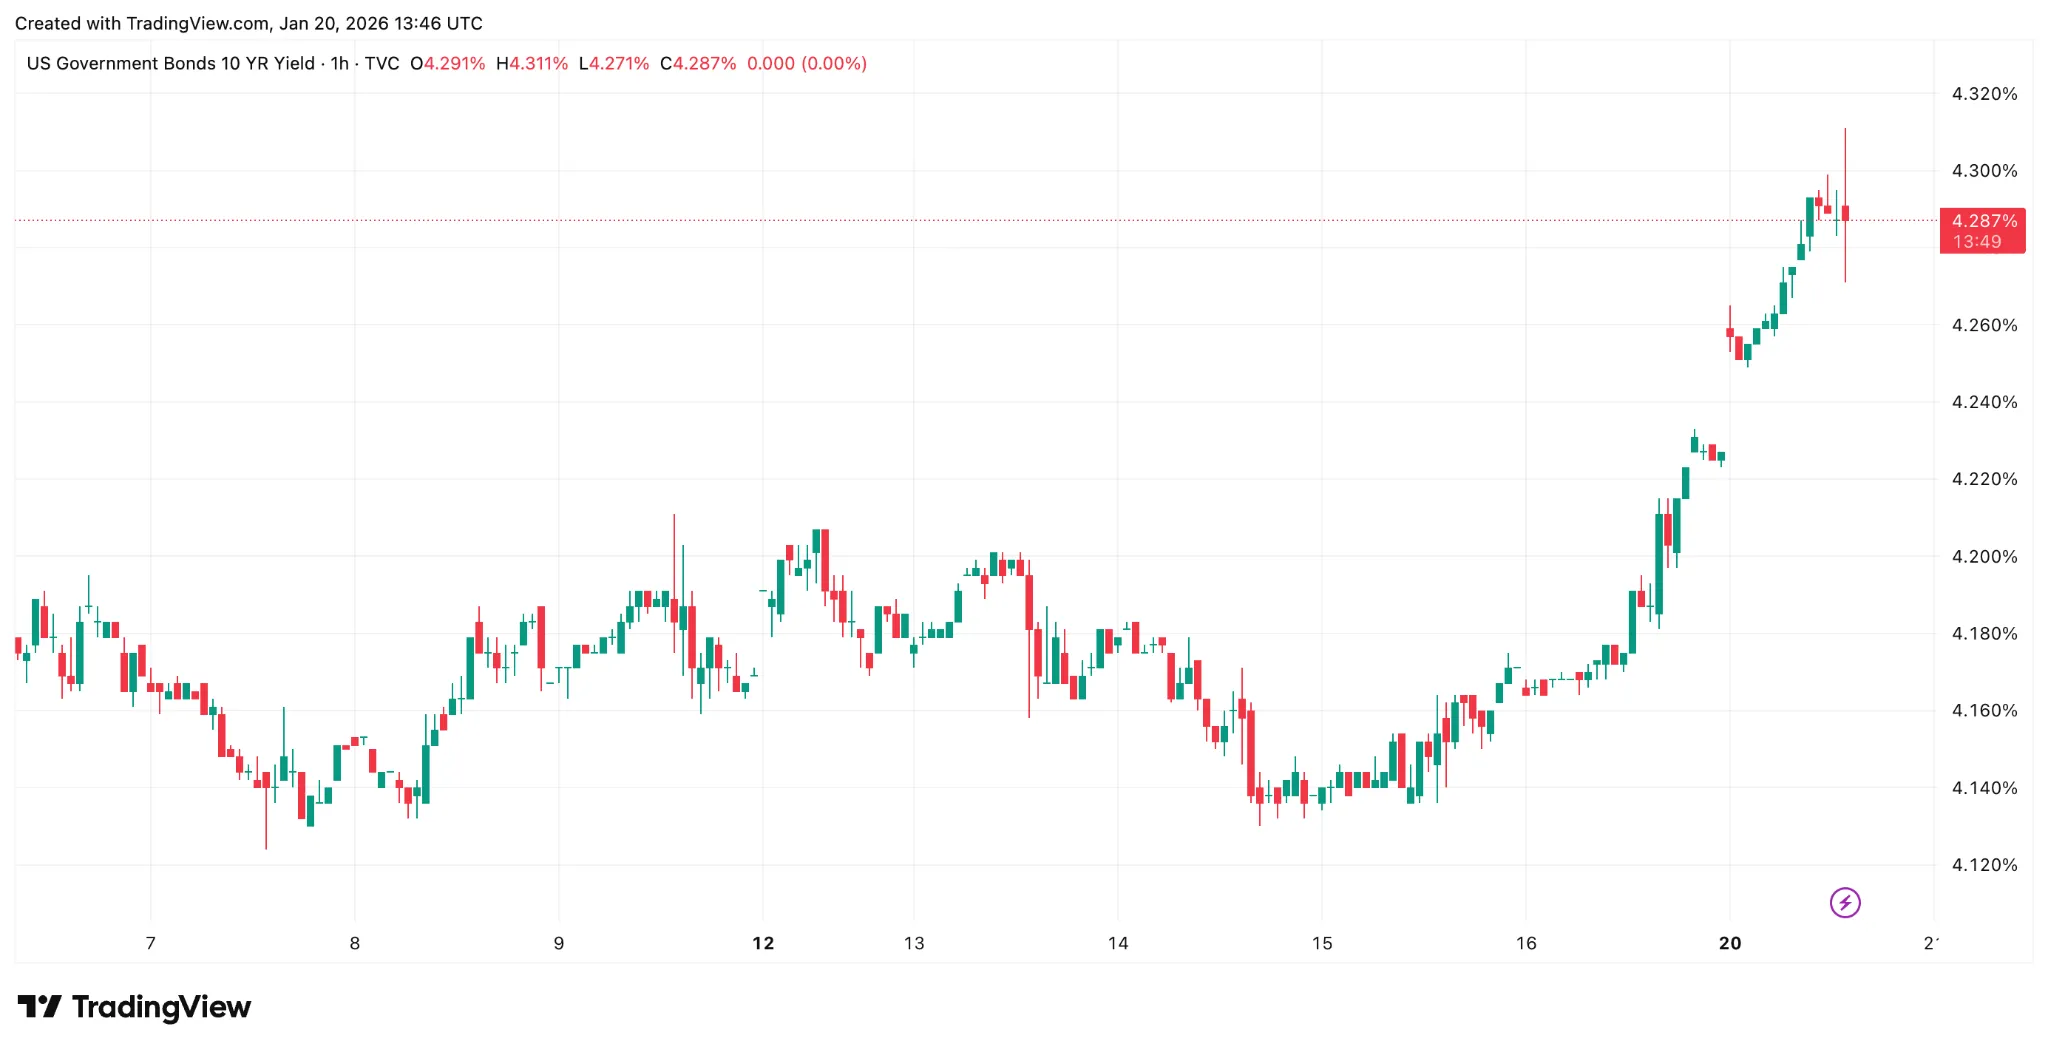
Sovereign yields underpin the global borrowing system. When they rise, lending rates increase worldwide as banks add their own risk premium to this “risk‑free” base.
For markets, higher US yields are a warning sign. Elevated rates make speculative investments less attractive.
Amid geopolitical uncertainty and the Treasury backdrop, bitcoin’s price fell 2.2% over the past day. At the time of writing it trades around $90,900.
Reasons for optimism
The Hash Ribbons indicator flashed a buy signal. It is triggered when the 30‑day moving average of hashrate drops below its 60‑day exponential moving average (EMA).
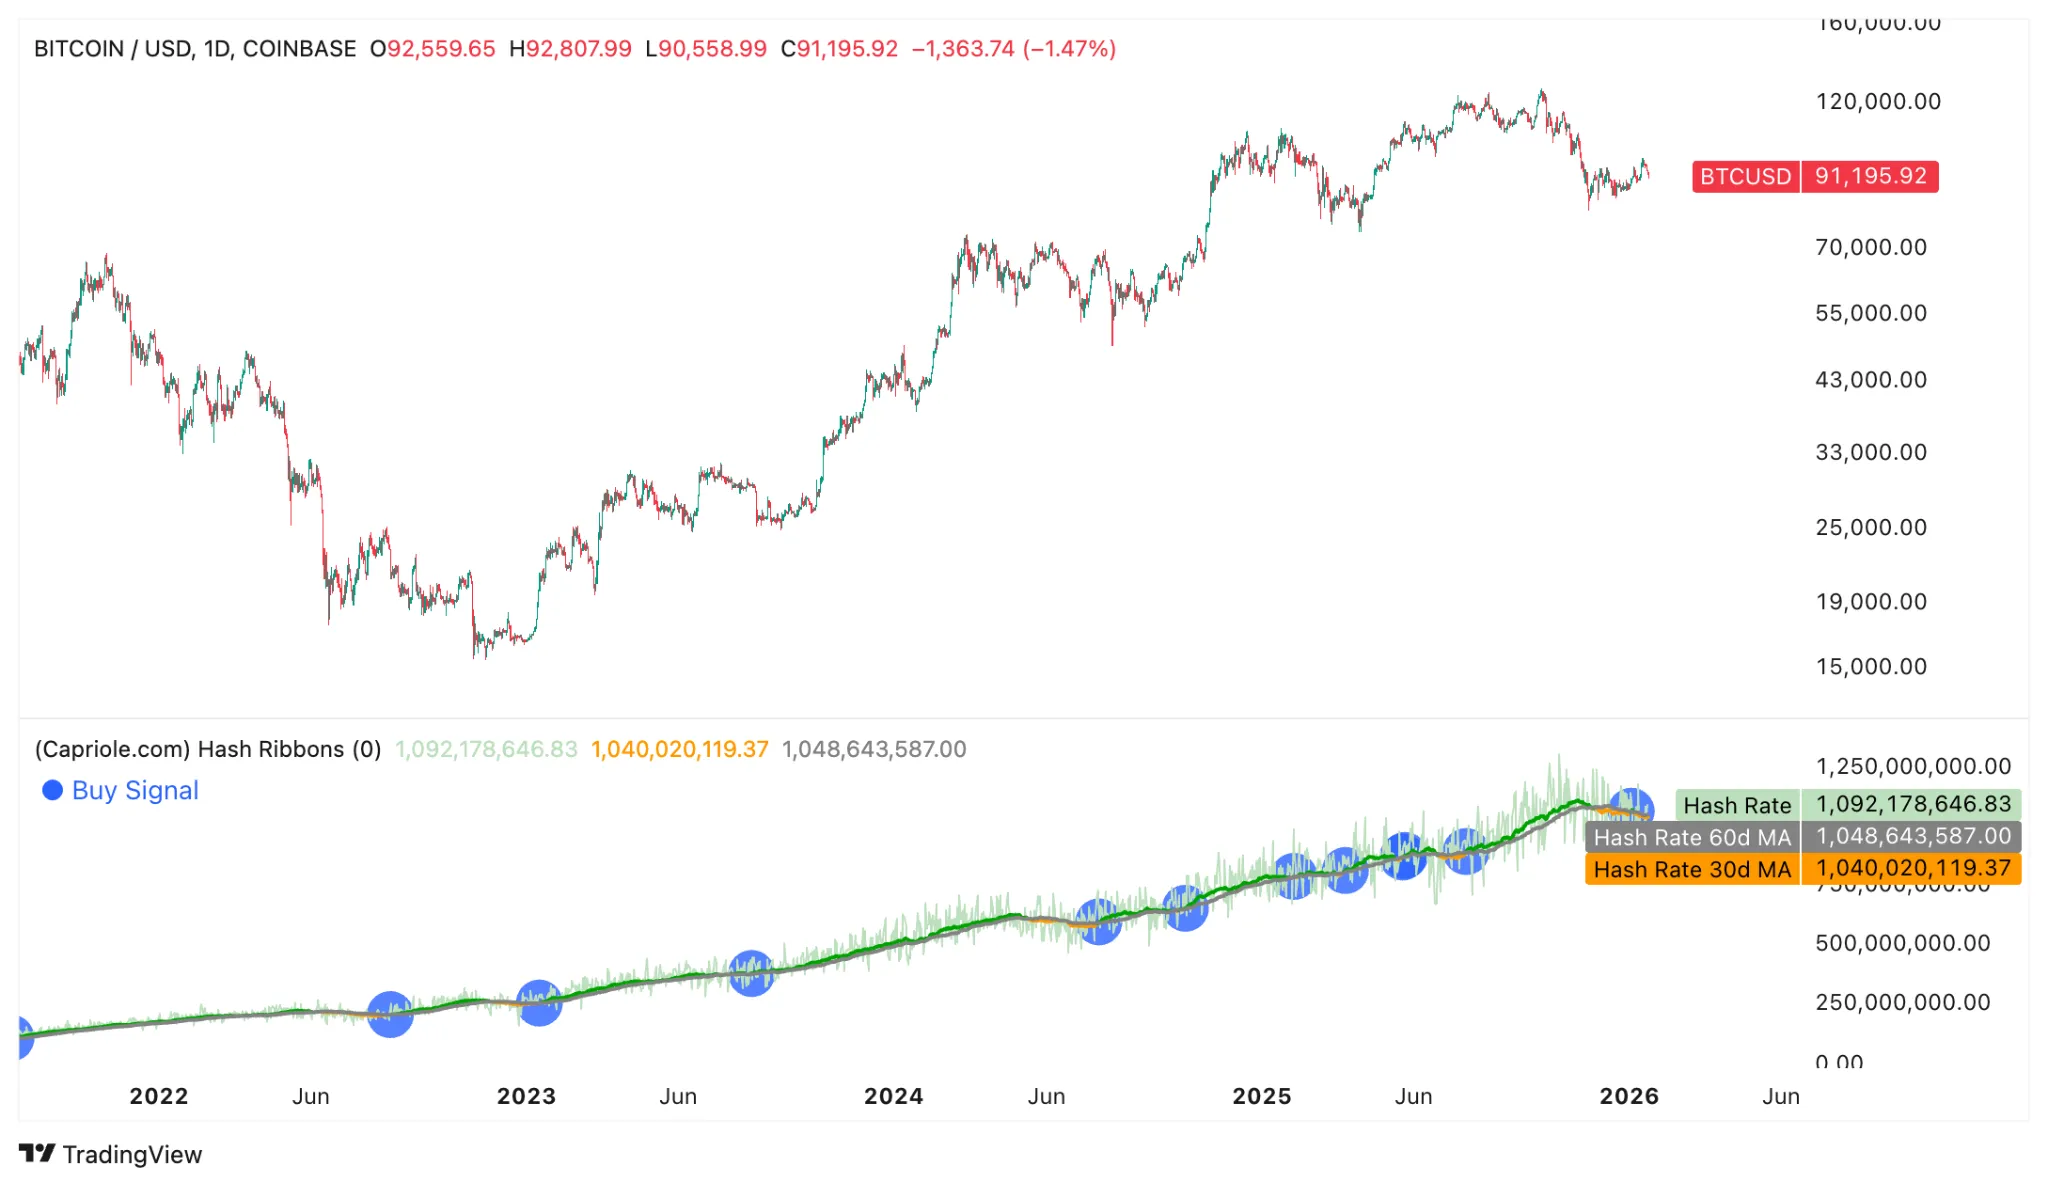
Such a cross typically marks miner capitulation phases, when less efficient operators are forced to shut down.
Analysts at On‑Chain Mind offered a similar observation.
We’re currently seeing one of the largest Hash Ribbons signals on record.
Hash Ribbons track miner stress by comparing short- and long-term hash rate trends. When miners capitulate and then recover, it often marks the end of forced selling.
Historically, once this phase… pic.twitter.com/uEzmS0LboC
— On-Chain Mind (@OnChainMind) January 19, 2026
The previous buy signal came in July 2025, after which bitcoin rose 25% — from $98,000 to $123,200.
Another bullish signal comes from the Fear and Greed Index. CryptoQuant analyst Julio Moreno noted the formation of a “golden cross” on its chart, which traditionally foreshadows potential upside.
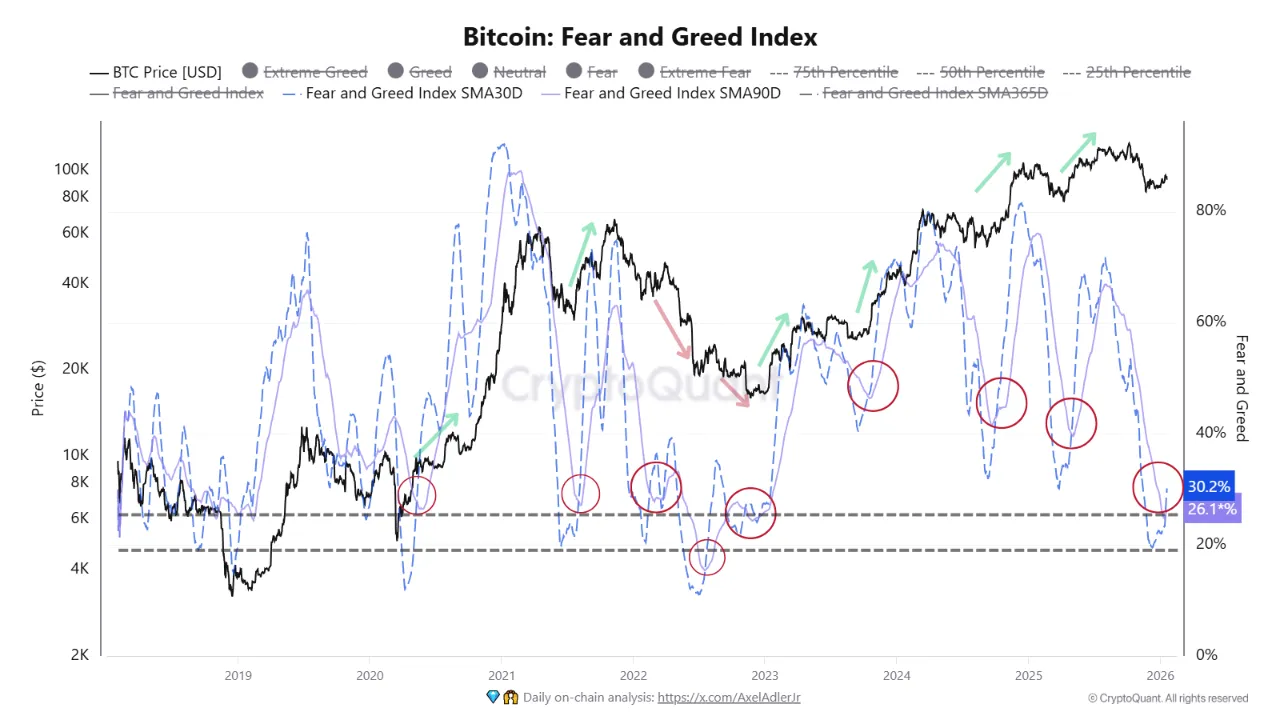
“Such crosses usually occur after prolonged periods of fear and often appear in zones of local price compression rather than at global highs. As the chart shows, in most of the highlighted cases the price displayed positive performance in the following weeks,” he stressed.
The key threshold for bitcoin is $90,000 — a critical psychological and technical support that bulls must defend, says the analyst known as Crypto Solutions.
He says that as long as price holds above that level, buyers retain the initiative and keep open the chance of a new rally.
Technically, the level aligns with two important markers:
- the 200‑period moving average on the four‑hour chart;
- the lower boundary of a “bear flag” on the weekly timeframe.
Losing $90,000 could change the picture dramatically, Crypto Solutions noted.
“If the level is broken and the weekly candle closes below, market dynamics may shift into a negative phase. In that case, the next likely target will be the $80,000–$85,000 zone — an important area of demand on the daily chart,” he added.
If it falls below $80,000, key supports will be $74,500 (April 2025 low) and $68,000 (200‑week moving average).
The most pessimistic scenario implied by the “bear flag” points to a potential target around $57,050. That level could become a reversal point if a full‑blown bear trend develops.
The analyst known as Rekt Capital highlighted the importance of the 2025 open at $93,500.
Bitcoin has indeed rejected from the cluster of Bull Market EMAs, forcing a post-breakout retest of the $93500 level
In fact, Bitcoin has marginally Weekly Closed above $93500, therefore resembling more the April 2025 Weekly Close above $93500 than the November 2024 one… https://t.co/yaEE3QcJRK pic.twitter.com/DHhhEZKLJp
— Rekt Capital (@rektcapital) January 19, 2026
“In fact, bitcoin closed the week slightly above $93,500, which resembles April 2025’s weekly close above that level (green circles) more than November 2024’s,” he said.
To confirm a bullish trend, the asset needs to hold above that mark for a week, he argued.
Earlier, Glassnode analysts noted an improvement in the spot market for the leading cryptocurrency. Trading volumes are rising and selling pressure is easing.
Рассылки ForkLog: держите руку на пульсе биткоин-индустрии!