


Bitcoin ETFs See $91.5 Million Inflows After $1.45 Billion Outflows
Funds have started flowing back into spot exchange-traded funds (ETFs) based on the leading cryptocurrency after four days of net outflows.
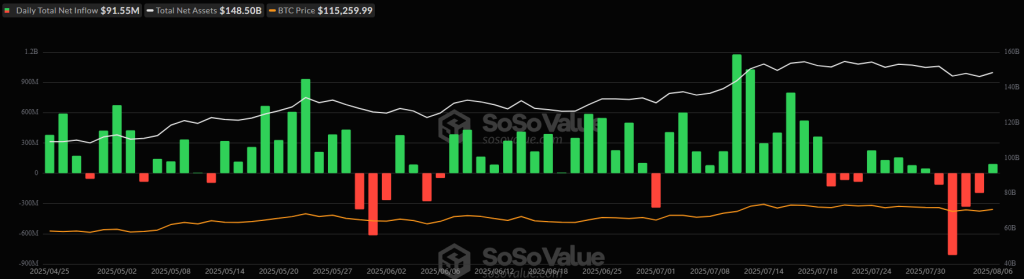
In the past 24 hours, the total AUM of these instruments increased by $91.5 million.
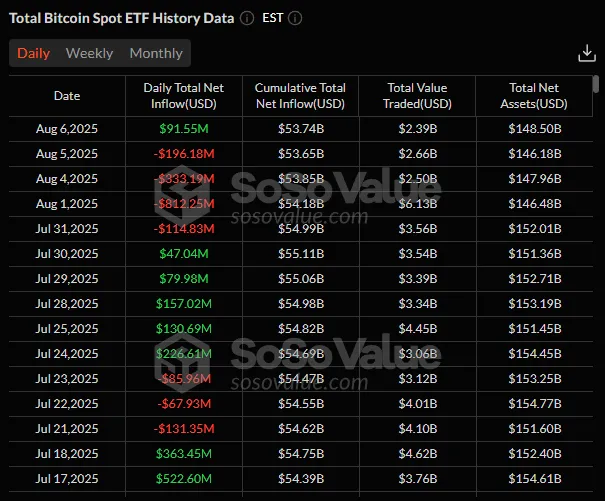
The cumulative capital outflow over the previous four days amounted to $1.45 billion.
“The return to net inflows in spot Bitcoin ETFs indicates a restoration of investor confidence and suggests that the recent consolidation may be attracting buying at current levels,” said Nick Rak, director at LVRG, in a conversation with The Block.
The expert added that inflows into exchange-traded funds are a “key barometer” of institutional sentiment. These investors consider the policy of the Fed, risk appetite among various market participants, and “align short-term volatility with long-term adoption trends.”
Spot ETFs based on Ethereum saw inflows of $35.12 million over the past day. Net inflows have continued for the second consecutive day.

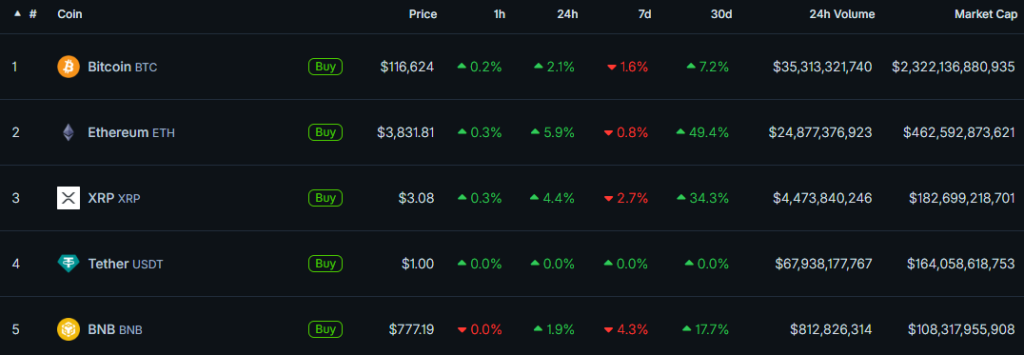
At the time of writing, digital gold is trading around $116,624, while Ethereum is at $3,831. Over the past day, the assets have appreciated by 2.2% and 5.9%, respectively.
Long-term Support for Bitcoin Price
According to Glassnode, the realized price for short-term holders of the leading cryptocurrency is at $106,000.
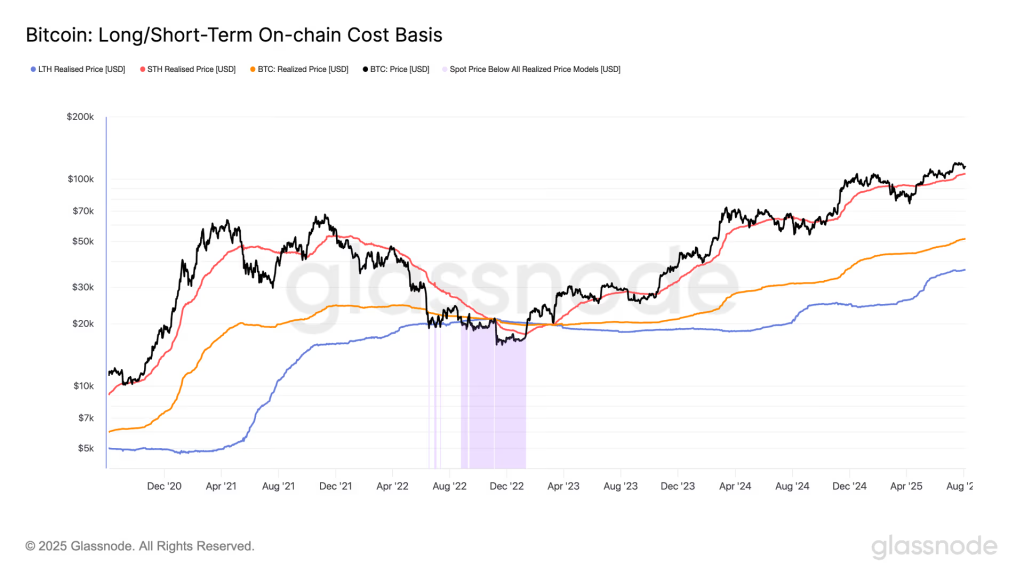
In a bullish market phase, this metric often acts as a dynamic support. For long-term investors, the metric stands at $36,500, while the overall market value is $51,348. The latter approximately corresponds to the 200-week moving average price.
Bitcoin’s 200 week moving average is now above $50k and climbing. pic.twitter.com/zojTSmcQnv
— Philip Swift (@PositiveCrypto) August 7, 2025
The realized price is a key on-chain indicator reflecting the average cost at which coins last changed hands. This metric is typically divided into two “age” categories: short-term and long-term holders.
Coins moved in the last 155 days fall into the first category—they are most frequently spent. The second category includes older assets, which are less likely to be spent.
In the context of technical analysis, an expert known as Galaxy identified a recurring “Triangle” pattern, previously formed in 2024.
$BTC in an interesting spot.
Last time it looked like this it was before the run from $70k to $100k. pic.twitter.com/U4GXOH2FUP
— Galaxy (@galaxyBTC) August 7, 2025
In November–December, the buy signal coincided with a new all-time high above $74,000.
Analyst Mitchell Askew from Blockware predicted the end of Bitcoin’s “parabolic” rallies or “devastating” bear cycles. In his view, institutions have altered market dynamics and reduced volatility.
Рассылки ForkLog: держите руку на пульсе биткоин-индустрии!