


Bitcoin Records First Monthly Loss as Ethereum Falls to $3000
The price of the leading cryptocurrency has shown negative monthly dynamics for the first time since August 2023, decreasing by 12% in April—from $70,000 to $61,000.
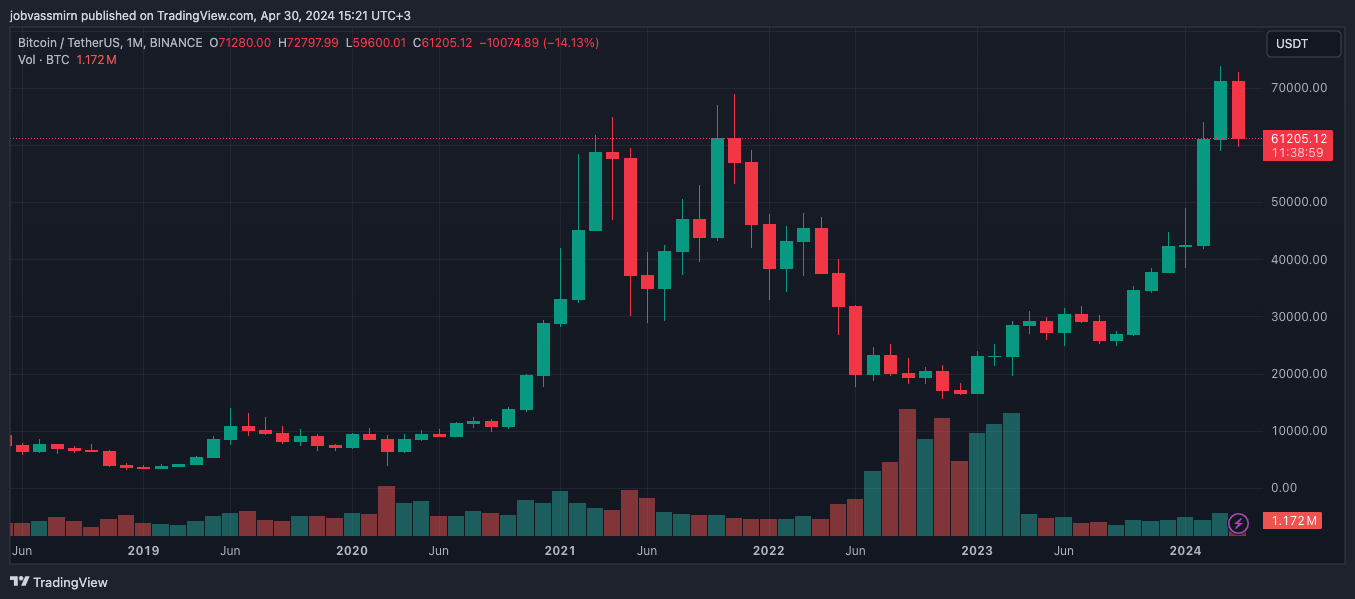
The correction over the past 30 days has been the largest since June 2022, when Bitcoin opened the month at around $31,000 and closed at $21,000.
MN Trading founder Michaël van de Poppe highlighted several factors indicating that digital gold is approaching a local bottom.
Multiple arguments for a potential bottom to be happening on #Bitcoin.
— FOMC
— Unemployment data
— CZ trialI think we’re close and #Altcoin pairs to be bouncing strongly. pic.twitter.com/KFPUC8uEA7
— Michaël van de Poppe (@CryptoMichNL) April 30, 2024
Among the negative signals, he mentioned the upcoming FOMC meeting on the key rate, unemployment data, and the trial of former CEO Changpeng Zhao. The expert added that altcoins paired with Bitcoin “could bounce strongly.”
Crypto analyst Willy Woo noted a weakening of market sell-offs according to the Cumulative Volume Delta (CVD). This indicates a local decline in bearish sentiment.
Finally urgent market sells (CVD) is subsiding, i.e. local bearish regime subsiding.
That dotted line is $59.6k which historically is the line between bullish and bearish regimes. #Bitcoin needs to stay above this. pic.twitter.com/0CKMtwsPTc
— Willy Woo (@woonomic) April 29, 2024
In his view, the boundary between bullish and bearish markets is at the short-term holder support level of around $59,600.
Among the positive aspects, Woo noted that “bulls will like” the reduction of the first cryptocurrency’s reserves on exchanges. He also pointed to a decrease in risk signals.
“It’s a decisive time. Bitcoin needs to make a decision. Technical indicators point to a bearish trend. Most of my fundamental indicators show a bullish nature. Macro liquidity will likely decide the issue,” the analyst concluded.
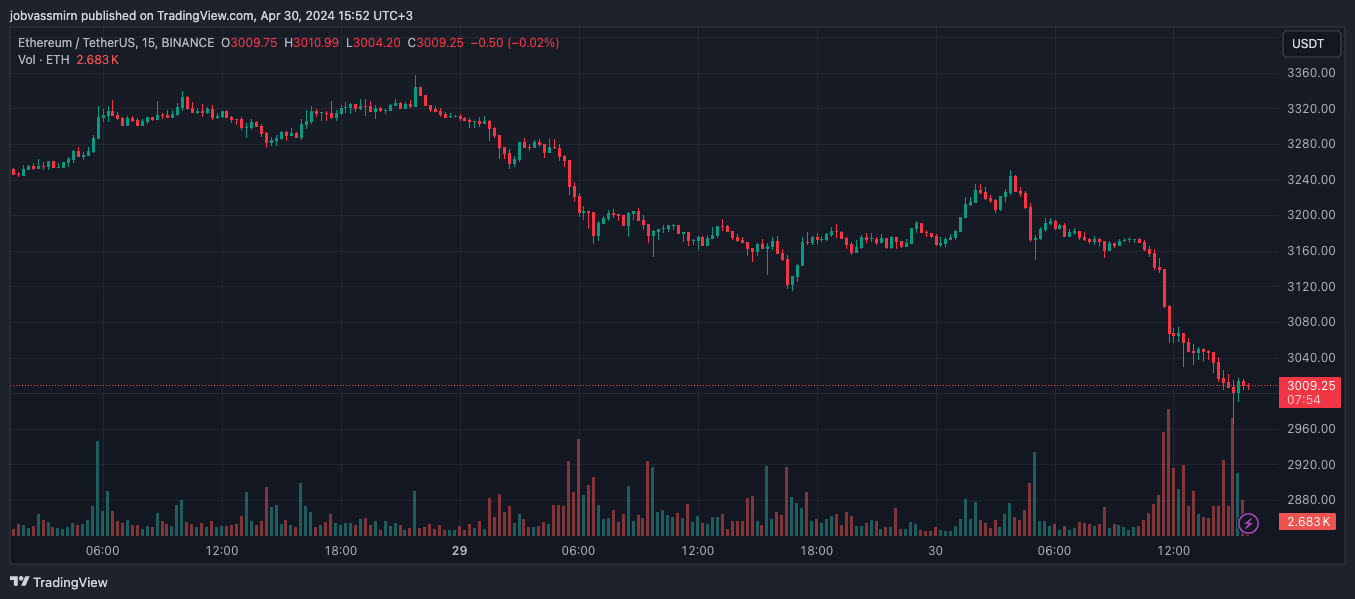
The second-largest cryptocurrency by market capitalization fell more sharply than Bitcoin over the past day—a decline of 5.1% compared to 2.3%.
At the time of writing, Ethereum is trading at $3010. The asset briefly dipped to $2950.
A trader under the pseudonym Into The Degenverse highlighted the RSI indicator in the ETH/BTC pair. It showed a reversal of the downward trend that began in November 2021.
#ETH/#BTC weekly RSI seem to have broken out of a long downward trend line that started in May, 2021. This breakout is combined with a bullish divergence.
This has similarities to late 2019. Right now prices don’t reflect these moves under the hood. Not yet. pic.twitter.com/mg7IAlTcu5
— Into The Degenverse (@Tony_100x) April 30, 2024
“This breakout is combined with a bullish divergence. It resembles the situation in late 2019. So far, prices do not reflect these underlying moves,” the user added.
On April 30, trading of six spot ETFs based on Bitcoin and Ethereum officially began on the Hong Kong Stock Exchange. According to Bloomberg analyst Rebecca Sin, inflows into this category of products could reach $1 billion within two years.
Earlier, experts at Santiment concluded that the reduction of transaction fees in the Ethereum network to a six-month low ($1.12) could indicate the approach of altseason.
Рассылки ForkLog: держите руку на пульсе биткоин-индустрии!