


Bitcoin has entered a broad distribution phase after reaching a new ATH above $73,000. According to Glassnode, a price floor is currently forming between $60,000 and $66,700.
Experts have concluded that the euphoria following the correction has weakened but is not yet exhausted.
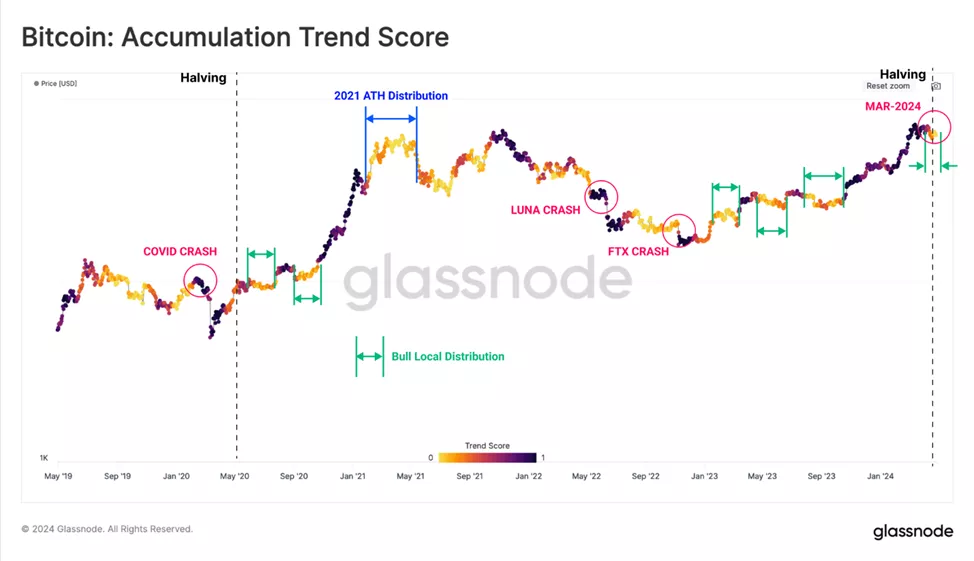
The Accumulation Trend Score metric illustrates how investor accumulation patterns relate to local peaks and troughs since the FTX collapse.
In the early stages of the bull markets of 2020-21 and 2023-24, local distribution phases (light colors) coincided with price declines.
As prices reach new highs, selling pressure intensifies as investors bring dormant supply back to the market to meet growing demand.
In mid-March, when the price reached ATH, a similar pattern was observed. News of the Middle East conflict intensified the correction to $60,300. The indicator’s structure showed a uniform outflow of coins across all wallet categories.


A unique characteristic of the prevailing bull market has been the positive impact of BTC-ETF on price dynamics. This effect can be explained using the Net Unrealized Profit/Loss (NUPL) indicator, which is based on the last movement of coins.
A sign of entering the euphoria phase is when the metric exceeds 0.5. In the 2020-21 cycle, this phase occurred 8.5 months after the halving, followed by a steady rise over the next 10.5 months.
In the current cycle, NUPL reached 0.5 six and a half months before the halving. This shift underscores the significance of ETFs.

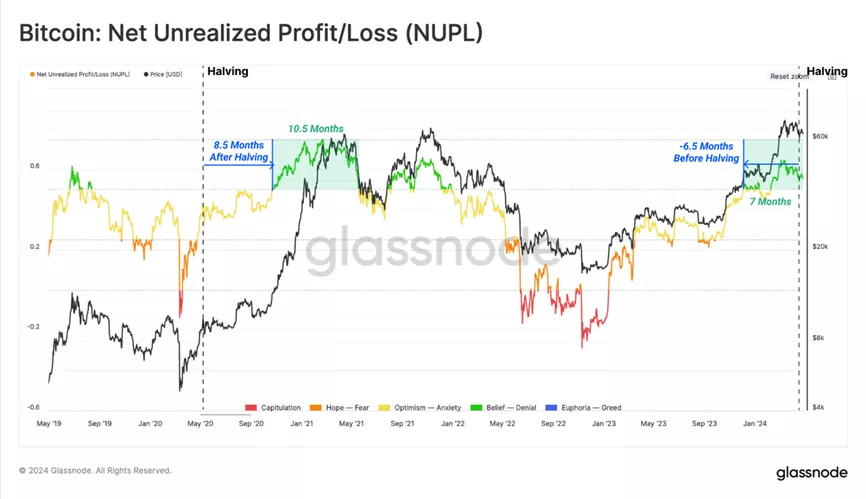
The euphoria phase has now lasted seven months.
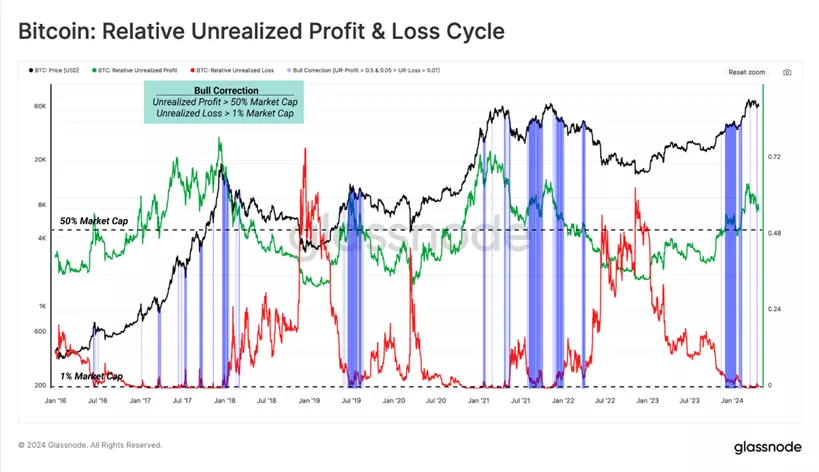
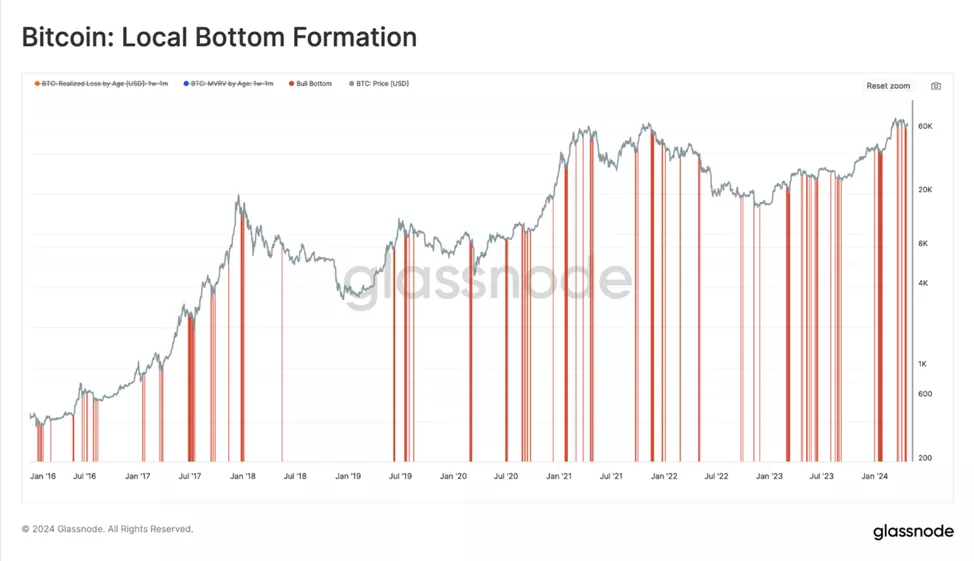
Even the strongest upward trends experience corrections. These events provide valuable insights into investor positioning and sentiment, experts noted. Their analysis relied on two conditions:
- Relative unrealized profit (?> 0.5) indicates a large volume of “paper” profits has accumulated in the market;
- Relative unrealized loss (?> 0.01) suggests investors face significant financial pressure, incurring large “paper” losses during downturns.
The charts below demonstrate that corrections are a normal and expected occurrence in all bull markets. Since reaching ATH, this structure has manifested in three separate pullbacks to the ~$60,000 zone.

Experts identified that the main selling pressure currently comes from recent buyers realizing “paper” losses.
In this category, coin holders aged one to three months and three to six months are valuable tools for identifying bull and bear market structures.
The week-to-month group corresponds to trend inflection points, helping to identify potential local bottoms (in bulls) and local tops (in bears).

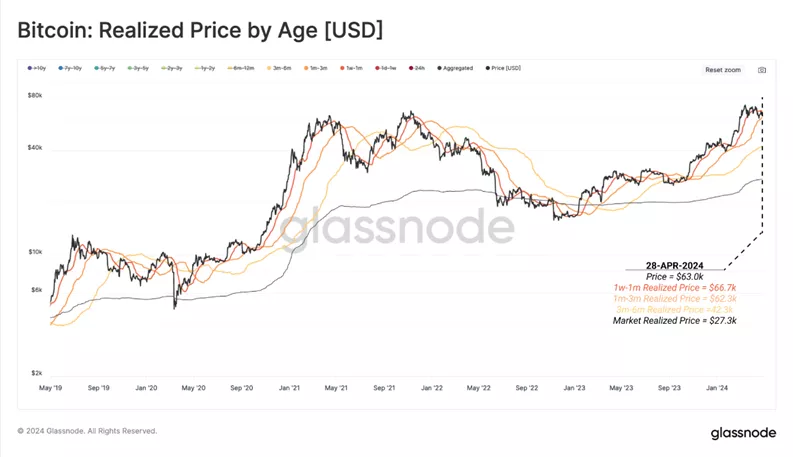
Analysts concluded that Bitcoin’s price often reacts to the “cost” of purchases over a week-to-month horizon. This is because recent buyers are more price-sensitive and more likely to offload Bitcoin in the short term.
In other words, during a bull market correction, short-term holders tend to increase spending. As the price approaches the acquisition cost of coins by each subgroup, their spending rates are expected to slow (a phenomenon known as “seller exhaustion“).

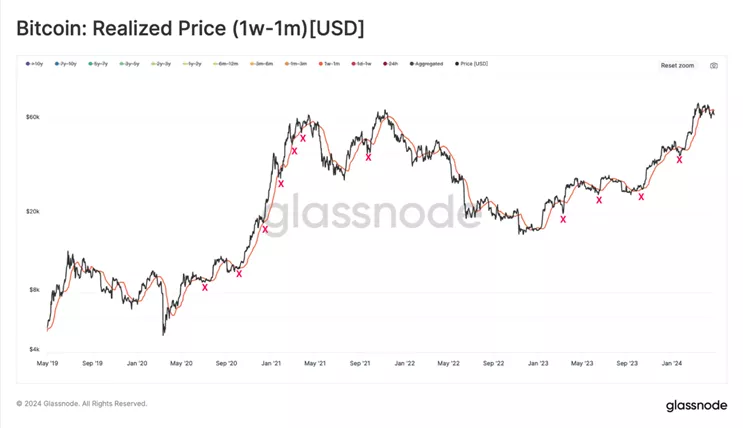
Experts have developed a set of tools to identify potential local inflection points for week-to-month old Bitcoins:
- MVRV in the range of 0.9-1;
- 60DMA realized loss exceeds one standard deviation.
According to analysts, the price typically falls a maximum of 10% below the average acquisition cost of coins by investors with a week-to-month horizon. Price extremes often coincide with peak panic among this market participant category, when their realized losses exceed one standard deviation.
At the time of writing, the “cost” of week-to-month old Bitcoins is $66,700. Since mid-March, the realized loss of their holders has exceeded the significant level mentioned above several times.
“As the price is in the range of $60,000 to $66,700, the MVRV condition is met, and it can be argued that the market is forming a local bottom. A sustained break below the metric level could trigger a panic cascade, prompting a quest to establish a new equilibrium,” concluded the experts.
Earlier, analyst Peter Brandt suggested a 25% likelihood of the bull market ending despite the halving.
Previously, in comments to ForkLog, experts explained post-halving dynamics and forecasted future developments.