

Bollinger Bands: using the indicator in crypto trading
Key points
- Bollinger Bands (BB) are a volatility indicator comprising a three-line band built on a simple moving average (SMA). The middle line is the SMA; the upper and lower lines reflect deviations from that average.
- BB are used to identify relative lows and highs on price charts of stocks and cryptocurrencies, indices, commodities, options and futures. The tool is also applied to trading volumes, market momentum and statistical data.
- The indicator assumes that price near the upper band indicates overbought conditions, while price near the lower band indicates oversold conditions. Bollinger Bands do not generate buy or sell signals; they help infer direction and the potential impulse of future moves.
Who created the indicator and when
Today, BB is one of the most popular indicators for technical analysis. The author of Bollinger Bands is John Bollinger, an American analyst, president and founder of Bollinger Capital Management.
The BB concept was developed in the 1980s, drawing on the work of Wilfrid Led and on Chester Keltner’s trading bands. The indicator gained broader recognition with the book “Bollinger on Bollinger Bands,” published in 2001.
Bollinger also developed two additional indicators: “%b” and “BandWidth”. %b shows where the BB sits relative to the SMA and is used for pattern building and trend identification. BandWidth shows the distance between the upper and lower Bollinger Bands.
How Bollinger Bands work
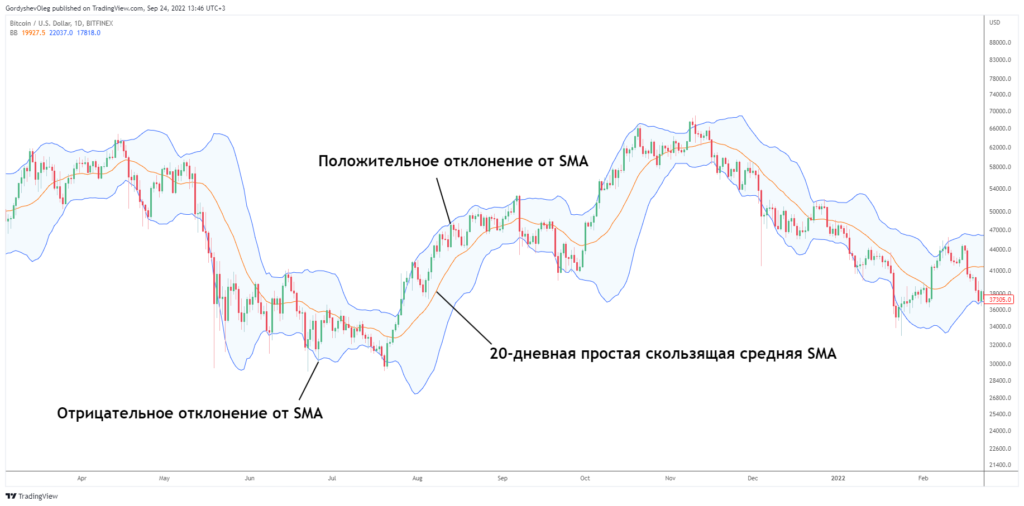
On a chart, Bollinger Bands form a channel that tracks an asset’s price line and consist of three lines: middle, upper and lower. The basis is the middle band, which is a simple moving average (SMA). The other two lines represent positive and negative standard deviations.
The author recommends standard BB settings of a 20 period and a deviation of 2. For a daily bitcoin chart, for example, that means a 20‑period SMA with a deviation of 2.
Bear in mind that the higher the period, the lower the indicator’s sensitivity. In practice, with proper BB settings, as Bollinger noted, the price should spend about 90% of the time between the lower and upper bands.
How to use Bollinger Bands in trading
Bollinger compiled a set of short rules that underpin how to read BB. The full list is available on the Bollinger Capital Management website. Some of them:
- A mere touch of a band by price is not, by itself, a buy or sell signal; the indicator complements other trading tools.
- A close beyond the bands more often points to continuation in the direction of the breakout.
Bollinger Bands can be used for many assets, including cryptocurrencies. The indicator suits any timeframe, including five‑minute, hourly, daily, weekly and monthly. The chosen period should have sufficient volatility for BB to make sense.
Benefits and risks of using Bollinger Bands
Bollinger Bands help determine average volatility for a given asset. Using BB can help identify a potential price maximum or minimum based on standard data over a past period. The author also noted that the indicator suits the identification of price patterns including “double top” or “double bottom”. There are risks, too. Among them:
- Low volatility. Using Bollinger Bands requires sufficient volatility to form a channel. A lack of activity makes applying BB pointless.
- Trading risks. Using Bollinger Bands without additional tools and indicators when making trading decisions entails risks. The BB indicator by itself does not provide buy or sell signals.
- Channel breakouts. A breakout of the Bollinger Bands boundaries most often means the trend will continue in the direction of the breakout. Holding above the channel boundaries does not, by itself, generate buy or sell signals.
- Using “similar” indicators. Bollinger Bands should not be applied alongside indicators based on moving averages. For example, do not use EMA together with Bollinger Bands. Under Bollinger’s rules, indicators should not be directly related.
- Excessively long periods. Using BB over very long periods makes the indicator less sensitive to change. Setting the period above 20 creates undesirable “stability” for analysis.
Further reading
What is MEV in Ethereum and how will it change after the move to PoS
The SOPR indicator: finding price lows and highs for bitcoin
Where to track cryptocurrency prices?
Why does price slippage occur when trading cryptocurrencies?
Рассылки ForkLog: держите руку на пульсе биткоин-индустрии!