


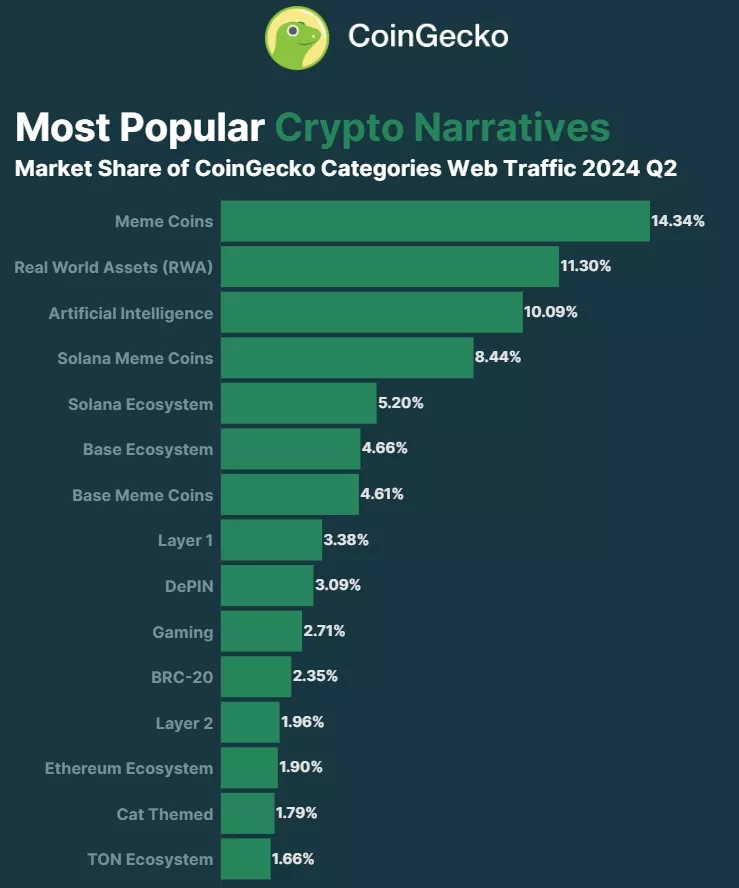
- In Q2, meme tokens emerged as the most popular narrative in the crypto industry.
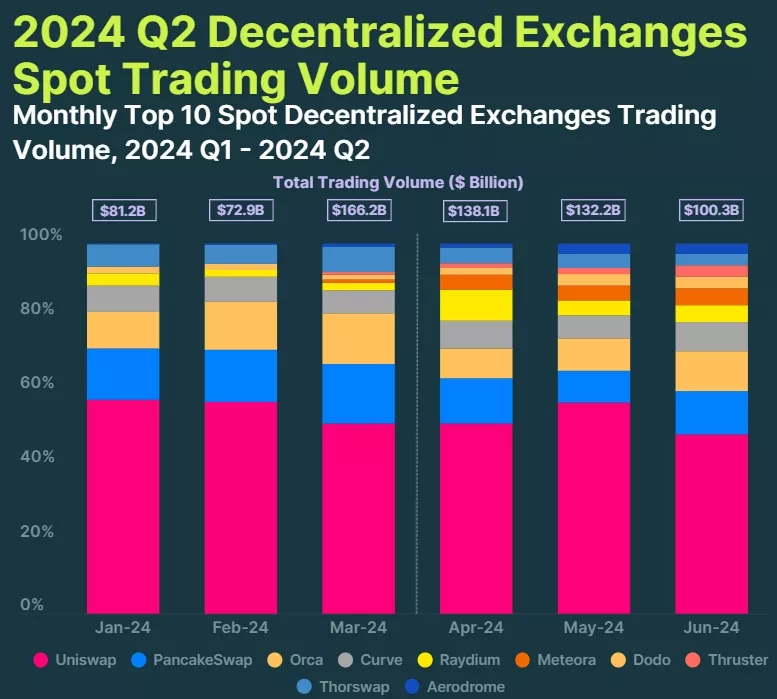
- Spot trading volumes on CEX decreased, while they rose on DEX.
- The market supply of Ethereum increased by 120,000 ETH from April to June.
By the end of Q2, meme tokens had become the most popular narrative in the cryptocurrency ecosystem, capturing a 14.34% share. These findings were reported by CoinGecko experts.
CoinGecko 2024 Q2 Crypto Industry Report is now LIVE ?
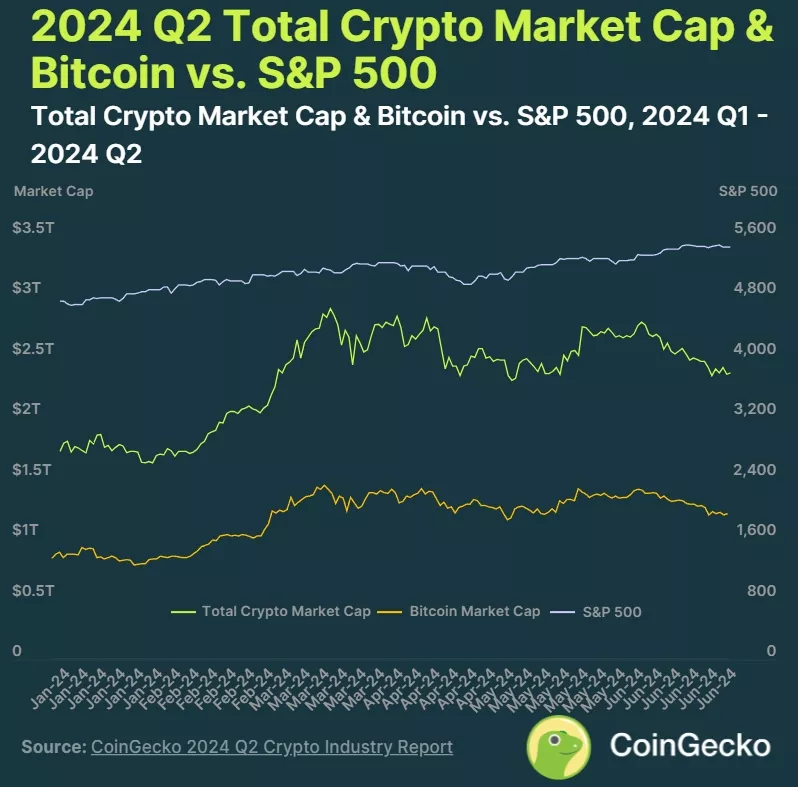
After nearly breaching all-time highs in 2024 Q1, the total crypto market cap returned some of those gains in Q2, dropping 14.4%, closing at $2.43T in June.
Here are 7 key highlights you shouldn’t miss ⬇️ pic.twitter.com/A8zz42RtGo
— CoinGecko (@coingecko) July 16, 2024
Following meme tokens, tokenized real-world assets (RWA) ranked with an 11.3% share, and artificial intelligence at 10.09%.
Together, these three leading categories accounted for 35.7% of the market share.
Meme tokens also topped the charts in relation to specific networks like Solana and the L2 solution Base. These protocols dominated the blockchain segment alongside Ethereum and TON, which made it to the top 15 of the overall list.


Analysts also noted several other noteworthy points from April to June.
Bitcoin’s Price and Hashrate Decline
The leading cryptocurrency ended Q2 at $62,734, a decline of 11.9%. The average daily trading volume of digital gold also fell to $26.6 billion, down 21.6% from the previous period.
“The quarter ended with market participants alarmed by news of Mt.Gox beginning to move its reserves of 140,000 BTC, while the German government was selling off confiscated bitcoins,” noted CoinGecko specialists.
Amidst this, the total crypto market capitalization shrank by 14.4% ($408.8 billion), reaching $2.43 trillion by the end of June. In contrast, the S&P 500 continued to rise, ending the quarter up 3.9%. This led to a sharp drop in the correlation between the two metrics from 0.84 to 0.16.
Cryptocurrency volatility remained high, analysts highlighted. The overall market showed a volatility of 48.2% compared to 46.7% for Bitcoin and 12.7% for the S&P 500.

The hashrate of the digital gold network reached an all-time high of 721 EH/s on April 23. However, by the end of the three-month period, the blockchain’s computational power had decreased by 18.8%. This marks the first quarterly decline in two years.
“Despite the drop in hashrate, the industry saw a flurry of activity. Companies like Bit Digital, Hive, Hut 8, TeraWulf, and Core Scientific expanded into the AI sector or plan to do so. Meanwhile, Tether announced a $500 million investment in the mining sector, and Block completed the development of its 3-nm chip for bitcoin mining,” the report states.
In early July, it was revealed that Core Scientific would be the first buyer of Jack Dorsey’s company’s mining processors. The parties disclosed the deal’s volume only in terms of hashrate — 15 EH/s. Analysts at Bernstein estimate the monetary value at $300 million.
Is Activity Shifting to DEX?
Spot trading volumes on centralized exchanges in Q2 amounted to $3.4 trillion, down 12.2% from January to March. The reduction roughly corresponds to the decline in the total cryptocurrency market capitalization.
Binance remained the largest spot CEX, ending June 2024 with a 45% market share. Bybit moved to the second position, increasing trading volumes by 12.6% and surpassing Upbit.

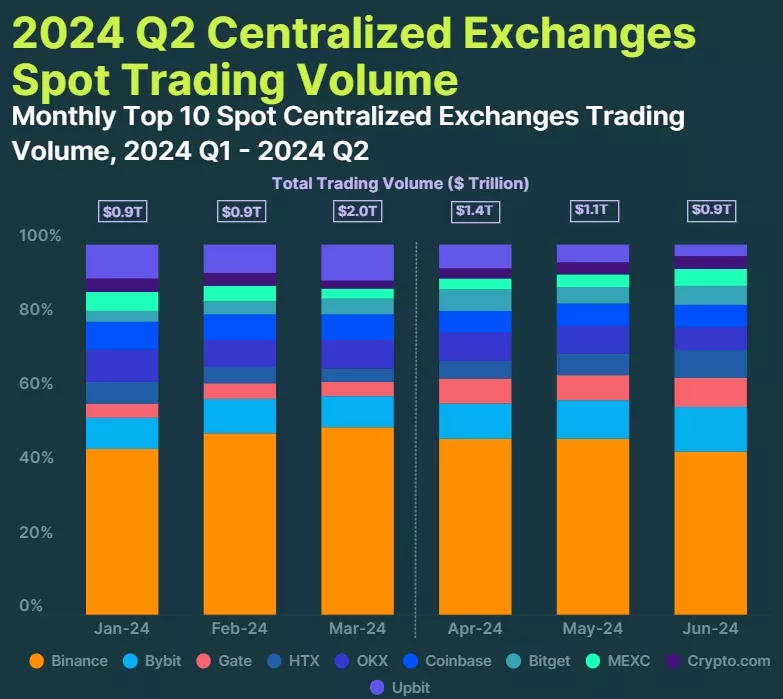
Of the top 10 platforms, only four showed growth: besides Bybit, these were Gate, Bitget, and HTX.
On decentralized exchanges, spot trading volumes increased by 15.7% over the quarter, reaching $370.7 billion. According to CoinGecko experts, this was driven by a boom in the meme token segment and numerous airdrops.
Among DEX, Uniswap continues to dominate with a 48% share. However, the lower ranks of the top ten face pressure from rapidly growing platforms like Thruster on Blast and Aerodrome on Base. Having entered the top 10, these exchanges continued to increase volumes: +464.4% and +297.4% for the period, respectively.

Among notable trends in Q2, CoinGecko specialists highlighted Ethereum’s inflation. During the period, the market supply of the cryptocurrency increased by approximately 120,000 coins. While 228,543 ETH were issued, the burn mechanism destroyed only 107,725 ETH.
Throughout the quarter, there were only seven days when the amount of the asset in circulation decreased.
Back in May, CoinGecko experts compared blockchains by speed.