


A correction in the crypto market has pushed many professional investors into liquid assets or higher cash allocations, Bloomberg reports.
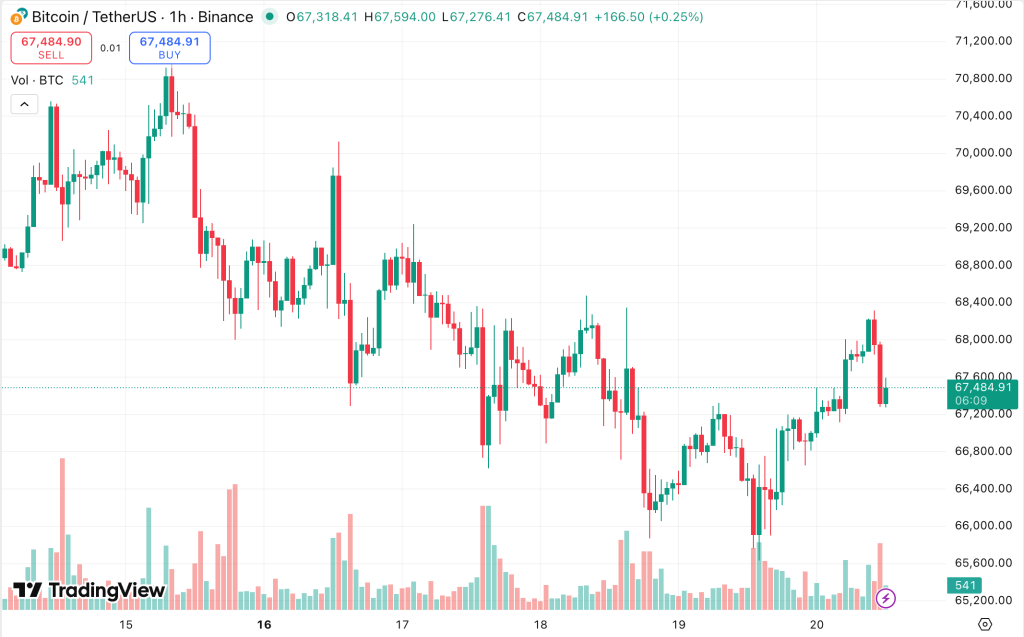
“Bitcoin has found a new range around $60,000 and is drifting there without the slightest directional conviction,” said Bohan Jiang, senior derivatives trader at FalconX.
At the time of writing, the leading cryptocurrency changes hands around $67,400—almost 50% below the all-time high near $126,000.


Defensive stance
Surveys by Crypto Insights Group indicate many managers cut risk in the fourth quarter.
Sigil Fund said it had, for the first time, reduced its exposure to bitcoin and Ethereum to zero, trimming risky positions to 40% of the portfolio amid a worsening risk–reward profile.
Basis trades suffered in particular, in which funds bought bitcoin on spot (or via ETF) and sold longer-dated futures to capture the spread. After the slump, the strategy stopped paying.
Crypto Insights Group noted managers now prioritise capital preservation and flexibility, widening mandates to include crypto-adjacent equities.
“The growth of cash buffers suggests most are waiting for clear macro signals, regulatory triggers, or a durable return of liquidity before re-entering higher-beta, riskier tokens,” the analysts concluded.
‘Unprecedented’ outflow
Over 100 days, the total value of the digital-assets sector shrank by $730.6 billion, noted CryptoQuant specialist GugaOnChain. He called it “an unprecedented short-term capital flight” that is accelerating the contraction of the crypto market.
100 Days in the Red
“In just 100 days, the crypto market has erased more than $730 billion in value. What we are witnessing is an unprecedented short-term capital flight, deepening the contraction of the crypto economy.” – By @GugaOnChain pic.twitter.com/SaSUGUBBgu
— CryptoQuant.com (@cryptoquant_com) February 20, 2026
Bitcoin shed $347.9 billion in market capitalisation—down from $1.697 trillion to $1.349 trillion (a 21.62% drop). The metric for the top 20 cryptocurrencies, excluding the bellwether and stablecoins, fell by $259.94 billion.
The most vulnerable cohort—mid- and small-cap altcoins—declined by $122.75 billion, losing more than 20% of their value.
“This is not just a correction — this is a classic investor exodus within a ‘flight from risk’,” emphasised GugaOnChain.
What next?
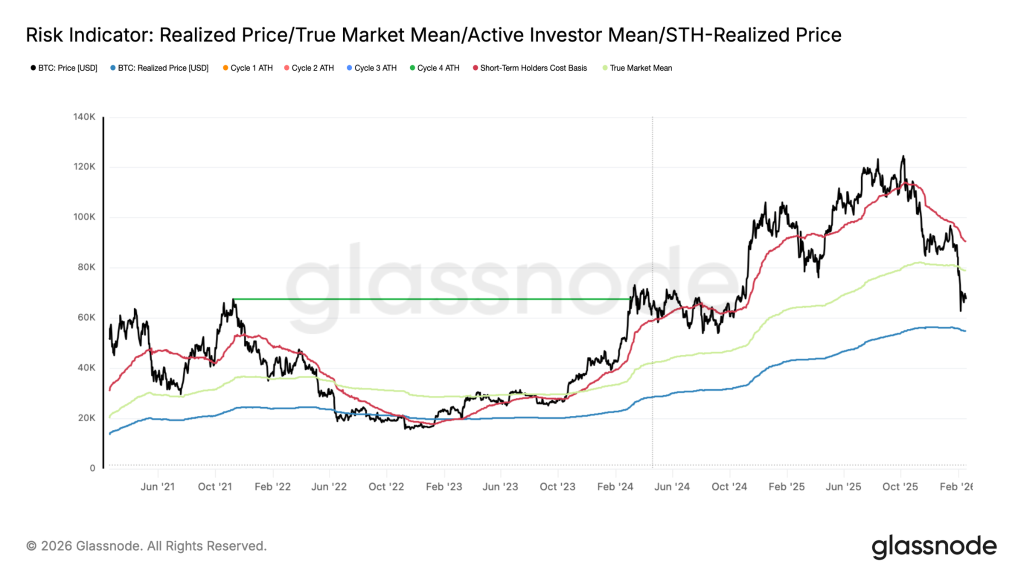
Glassnode analysts noted that bitcoin has broken below the True Market Mean, currently near $79,000. Historically this level has demarcated market expansion from contraction.
After the break, the next structural support became the Realized Price—around $54,900. In prior cycles, the corridor between these two metrics became a zone of prolonged consolidation.


Conditions have worsened even versus early February, when the market merely “held the line” below $70,000. Since then, outflows from spot ETFs have become persistent and selling pressure has intensified.
Experts said net flows into exchange-traded funds turned negative again, depriving the market of a key source of demand. CVD on major exchanges also flipped negative—pointing to active selling.
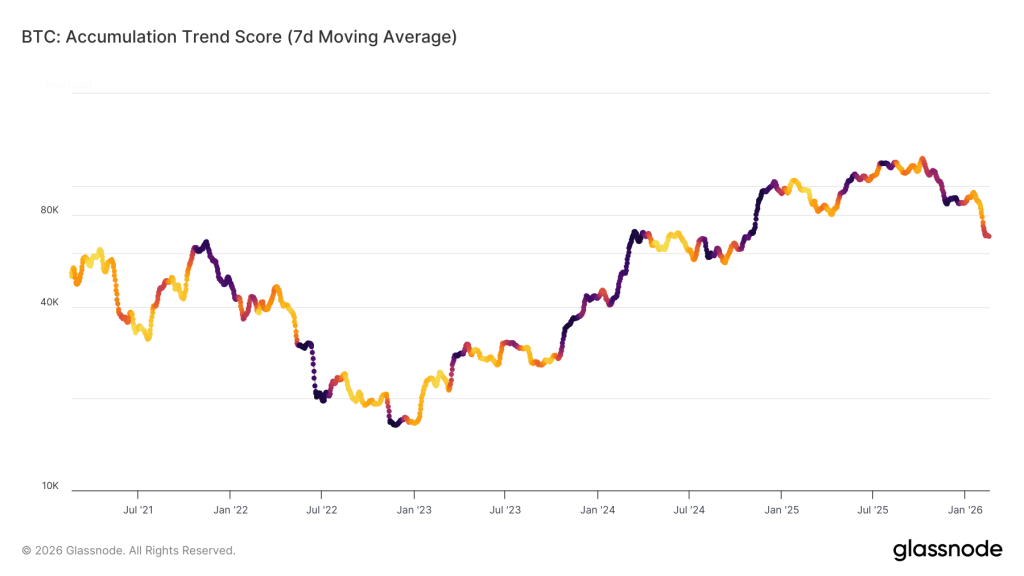
Accumulation metrics have improved slightly, but large holders’ appetite remains weak. The Accumulation Trend Score has stalled in neutral territory (~0.4), signalling an end to distribution but not a return of whale confidence.
The ratio of realised profits to losses is stuck in a narrow band typical of market stress, Glassnode emphasised.
The derivatives market suggests the acute phase of panic has passed, but sentiment has not turned. Implied volatility has dropped sharply, and the 25 Delta Skew has retreated from extremes. Traders are in no hurry to add bullish bets.
Earlier, CryptoQuant analyst Burak Keshmechi outlined four indicators to watch to determine bitcoin’s long-term trend.