


Crypto price analysis: Ethereum leads the market as prices rise
The leading RoboForex analyst Dmitry Gurkovsky explains the possible trajectories for Bitcoin’s price and several popular altcoins.
The cryptocurrency market is trying to rise after another correction. Ethereum is performing best, while others are not rushing to set new highs.
Moreover, on daily charts for such cryptocurrencies as Litecoin and EOS, reversal patterns with downside potential are taking shape, and if buyers fail to defend the nearest support levels, a sharp decline for the entire cryptocurrency market is quite possible.
On the Bitcoin chart one can highlight a similar structure in the form of a “Triangle” pattern. The reluctance of bulls to push the price above the $12,000 level, followed by a breakdown of support and the price staying below $11,055, could send the leading asset down to $10,000 and even lower—to $8,825.
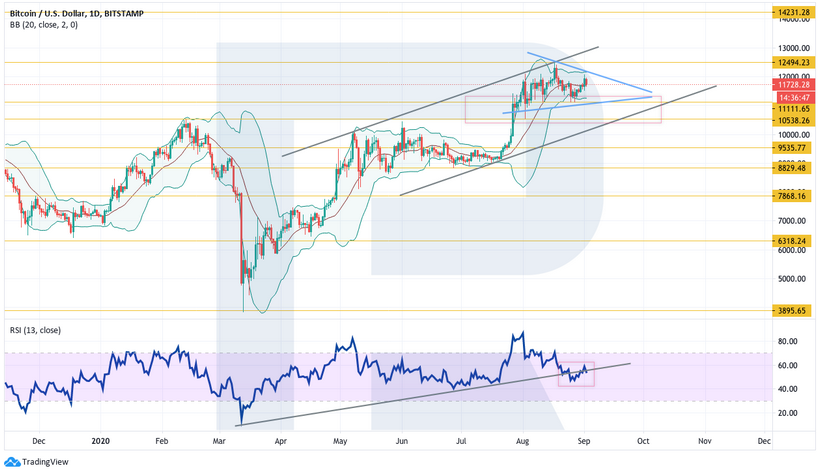
Bitcoin
On the daily chart Bitcoin is correcting within a triangle pattern. If the upper boundary of the pattern is breached with the price staying above $12,495, a confident rise to $14,230 should be considered.
An additional signal in favor of this scenario would be the RSI indicator returning above its support line.
An invalidation of the above scenario could be a break of the triangle’s lower boundary with the price staying below $11,055, in which case one could consider a strong correction down to $8,830.
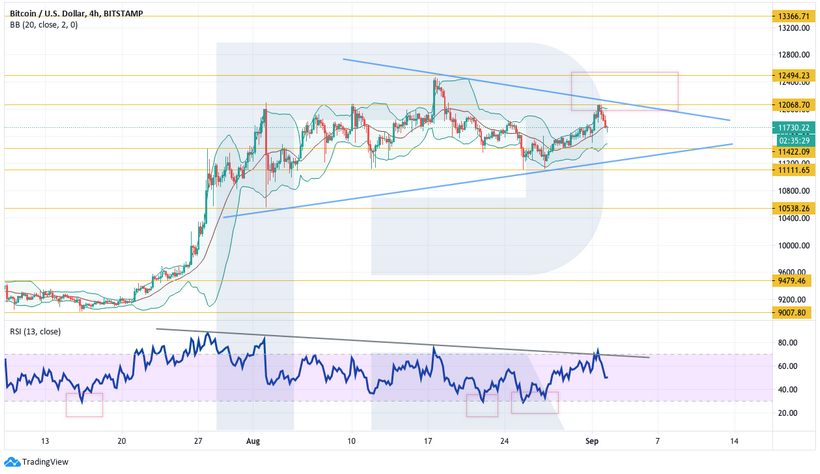
On the 4-hour chart the price has managed to rebound from the support level. A strong signal in favor of continuation would be a break of the resistance line on the RSI indicator, however so far there has been only a rebound from it.
A confirmation of the bulls’ continuation would be a break of the upper boundary of the triangle pattern, and for this it is enough to settle above $12,065. This level has acted as strong resistance, from which the price has bounced three times, signaling ongoing selling pressure.
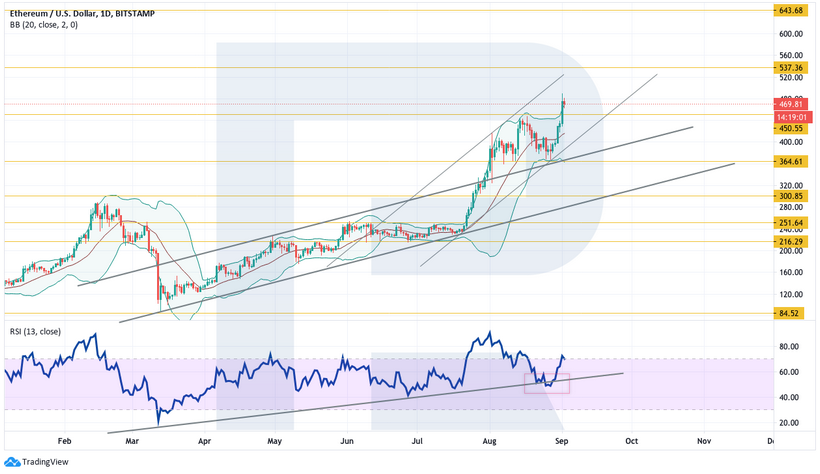
Ethereum
ETH/USD prices on the daily chart continue to rise actively. The price rebounded from the lower edge of the Bollinger Bands and decisively breached the upper band, signaling an uptrend.
An additional sign in favor of further growth is another rebound from the RSI support line. The target is $537.
Also, do not rule out formation of a large “Double Bottom” on the weekly chart, with a take-profit at $645. The invalidation would be a break of $365, implying a decline to $250.
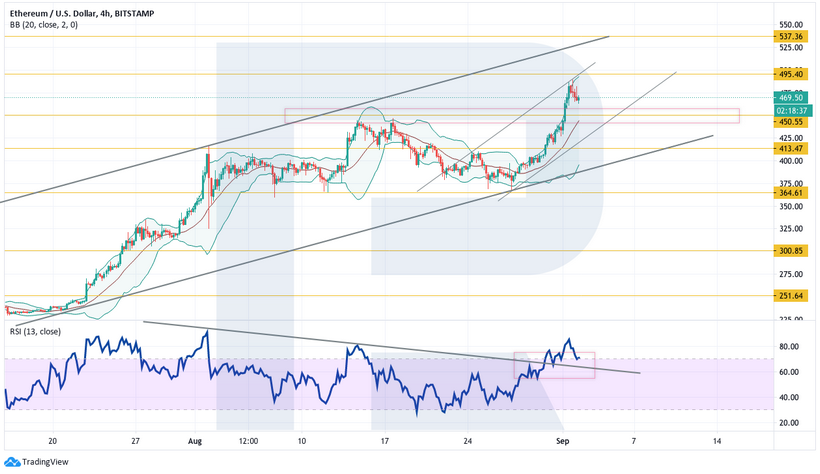
On the shorter timeframes the price bounces from the resistance area around $495. At the same time there was a break of the RSI resistance line, signaling potential for further rise to $537.
The scenario could be negated by a close below $413, confirming a break of the upward channel’s lower boundary and signaling a move down to $364.
A strong signal in favor of growth is also the halt in forming a head-and-shoulders reversal pattern, so the price may move higher toward the height of such a pattern.
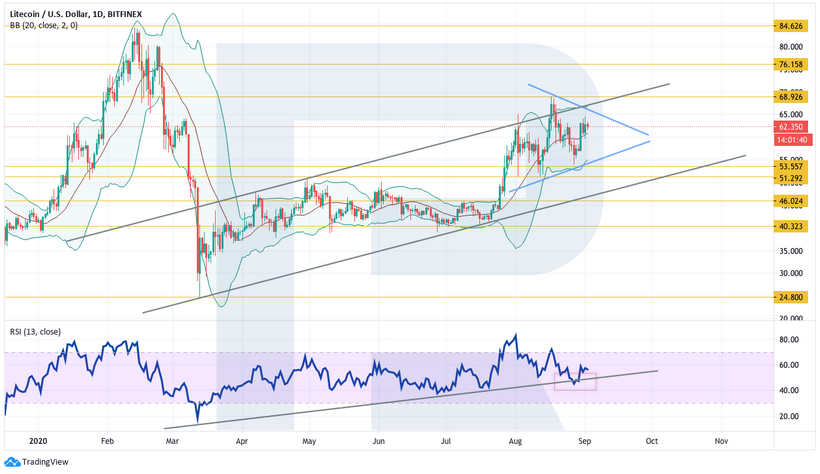
Litecoin
Litecoin’s quotes on the daily chart rebound from the $65 level, which acts as a key resistance on the way up. If sellers seize the initiative and we see a drop below $53, consider only a continued decline to $40, as the current price structure strongly resembles a head-and-shoulders reversal pattern.
However, do not rule out holding above $69, which would indicate a breakout of the triangle’s upper boundary. In that case one could expect a rise to $76, and further to $85.
An additional signal in favor of this movement is the RSI rebound from the support line.
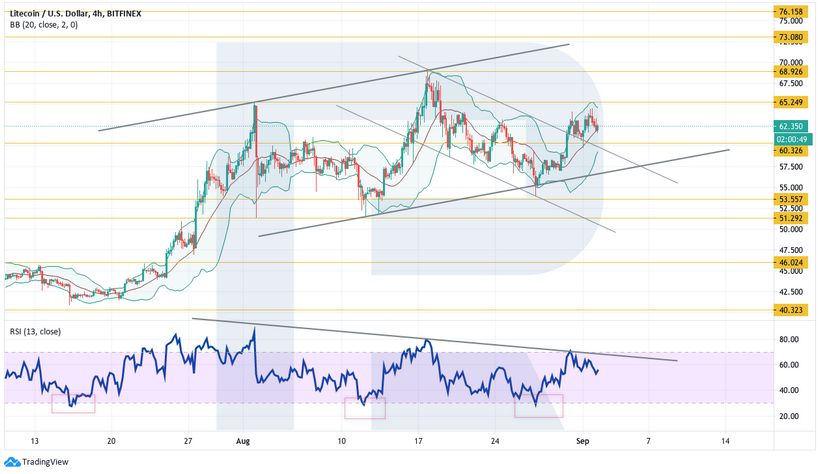
On the 4-hour chart the quotes have broken above the upper boundary of the downtrend channel, signaling potential for further growth. A strong signal here is the RSI repeatedly rebounding from 30.
A fall and break below the lower boundary of the rising channel with a close under $54 would indicate further declines toward $46 and the start of a reversal pattern on the daily chart of the asset.
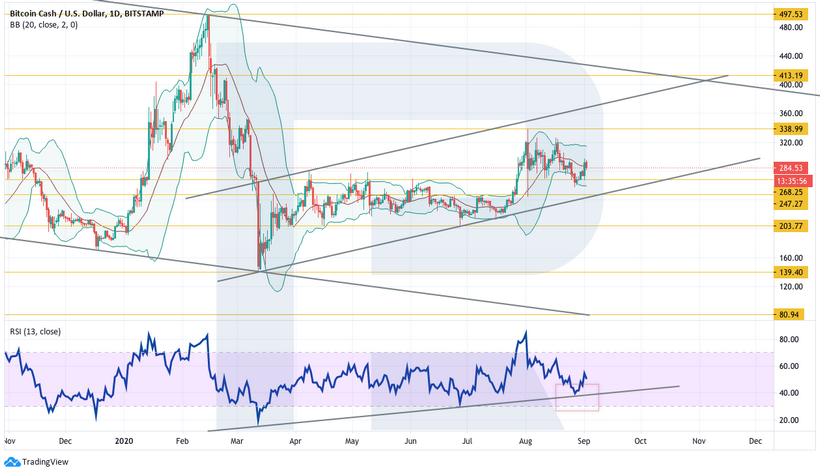
Bitcoin Cash
Bitcoin Cash on the daily chart continues to rebound from the support level, as well as from the RSI’s upward trend line.
Although the price has not managed to breach the lower boundary of the Bollinger Bands, to confirm growth it is important to see a break above the upper boundary with a close above $338.
In this case the rally could continue toward $413.
A break below the lower boundary of the rising channel with a close below $247 would push the price down to $203.
On the 4-hour chart, quotes have left the bounds of the “Wedge” pattern, signaling a move higher and the start of a pattern completion with a potential target at $370.
An additional signal here is a breakout of the RSI trend line, from which there has already been a rebound, increasing the odds of continuing growth toward the local maximum.

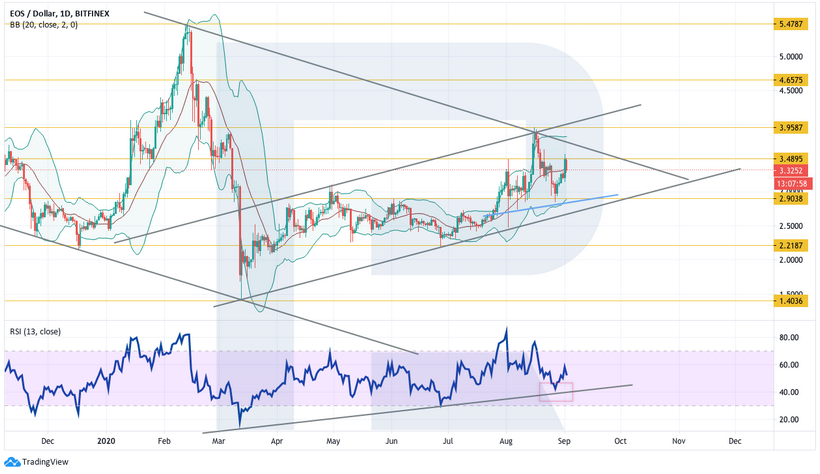
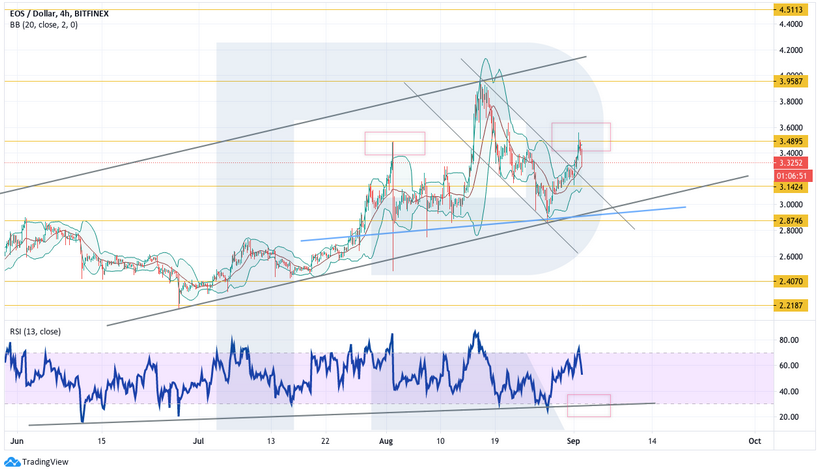
EOS
EOS continues to test resistance. It is also worth noting that a head-and-shoulders reversal pattern is forming here, as in Litecoin’s chart.
If the price breaks below the lower boundary of the rising channel with a close below $2.90, expect a decline toward $2.20 and lower as part of the reversal pattern.
For buyers it is important to push the price above the local maximum and avoid a drop below $3.95 to sustain the uptrend.
In this case one could talk about invalidating the reversal pattern and sustaining the upward impulse toward $4.65 and higher. Also supportive is an RSI rebound from its support line.
On the 4-hour chart, a reversal pattern is also forming. The price has just bounced off the area forming its right shoulder; if the asset cannot rise above it, expect only a decline.
Buyers need to push through a clear local maximum and avoid a drop below $2.87 to keep hopes for a resumed uptrend alive.
Subscribe to Forklog news on Facebook!
Рассылки ForkLog: держите руку на пульсе биткоин-индустрии!