


Crypto price analysis: market on the eve of another rally
Leading RoboForex analyst RoboForex Dmitry Gurkovsky explains possible scenarios for the price movements of Bitcoin and several popular altcoins.
After another round of fresh highs, all assets have moved into a downward correction. The current decline is merely another move lower ahead of the next attempt to rise.
On many charts, forming price structures point to a potential continuation of the rally. Therefore, if buying pressure does not ease and the market again attempts to move higher soon, a renewed bullish trend can be expected.
Some may be puzzled by the market’s reluctance to grow actively after breaking the “Triangle” upward, but the technical picture still favors a bullish scenario.
Bitcoin
On the daily chart, Bitcoin’s quotes are correcting again. The price remains above the middle line of the Bollinger Bands, indicating the presence of bulls.
A key support zone sits at $10,535. A test of this level could precede a continuation of the rally. A signal in favour of this scenario would be a rebound off the RSI support line.
An invalidation would be a break below the lower boundary of the ascending channel with the price staying below $9,810; in that case, expect a drop to $7,870 and the start of another downward correction.
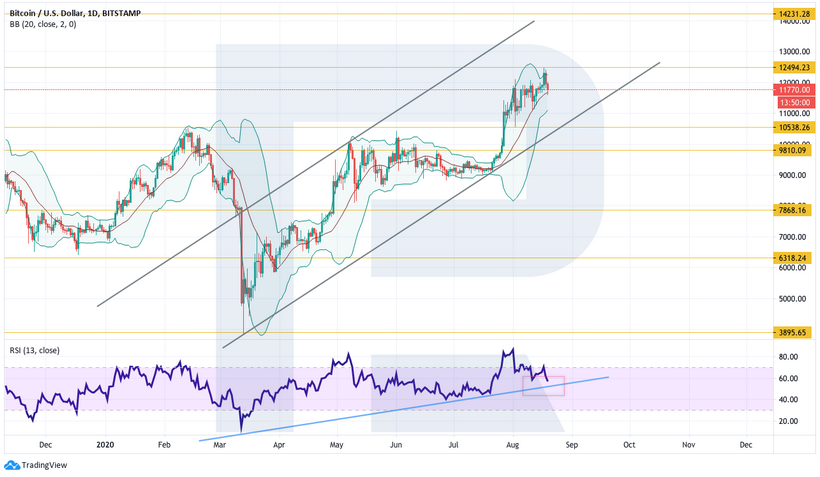
Daily chart BTC/USD from TradingView
On the 4-hour chart, the price bounced off the upper boundary of the ascending channel.
A solid support zone sits at $11,225, after which one should expect a new attempt for price to rise toward $12,495. Here we observe the RSI support line nearby; a bounce off this line would be a good signal for continuation of the rally.
An invalidation would be a break below the lower boundary of the ascending channel with the price staying below $11,150; in that case, a drop to $10,540 is expected.
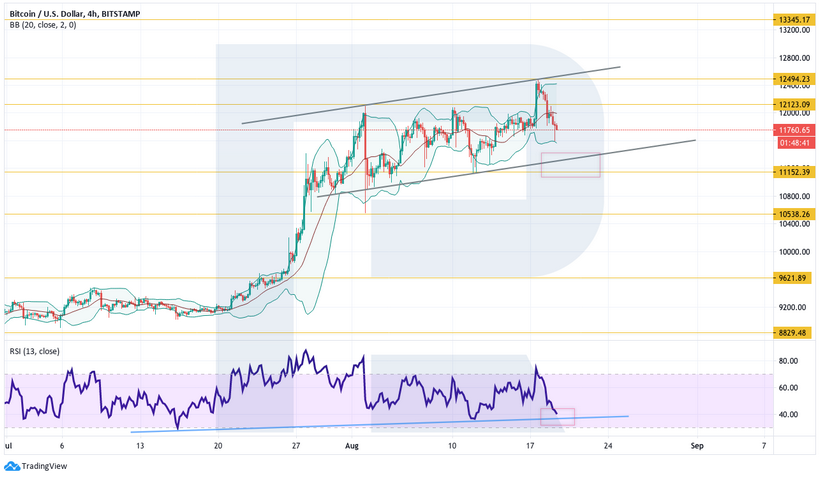
4-hour chart BTC/USD from TradingView
Ethereum
ETH/USD quotes on the daily chart also managed to reach a local high. However, the asset is already correcting.
A strong signal in favour of a rise was the breakout of the upper boundary of the ascending channel. Therefore do not rule out a return of quotes to the broken channel boundary at $360, after which the continuation of the price rise can be considered. In this case, a rebound from the RSI support line is likely.
An invalidation of the price growth would be a price close below $360, which would indicate a return of the price inside the channel and a drop toward $295.
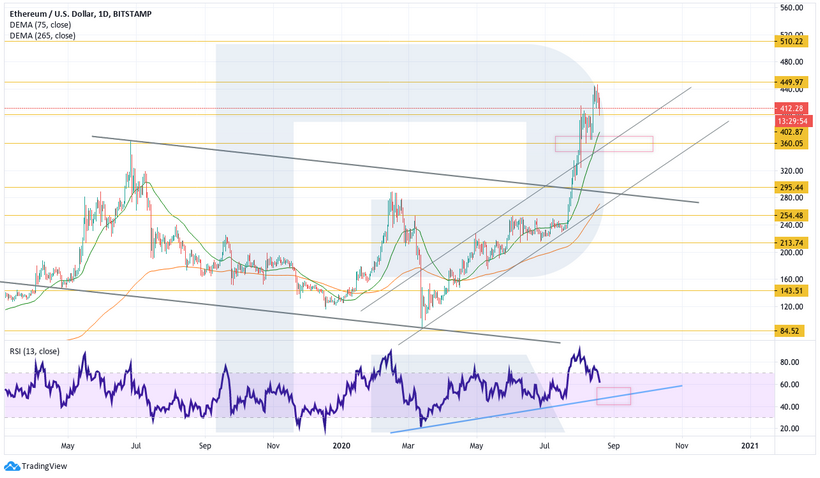
Daily chart ETH/USD from TradingView
On smaller timeframes, quotes correct within a channel. RSI values have almost reached the support line, which will be a strong signal in favour of a rise should the RSI values bounce from the support line.
A breakout of the resistance area with price closing above $450 would be the next target toward $510. The key support area here is also $360; a break below this level would send the asset into a strong downward correction toward $295.
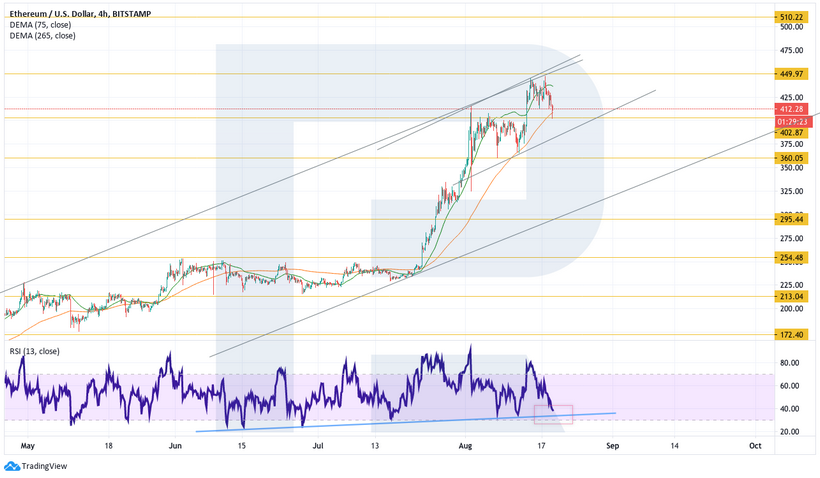
4-hour chart ETH/USD from TradingView
Litecoin
Litecoin’s quotes on the daily chart could not hold above the upper boundary of the ascending channel, but bullish pressure remains.
Just below is the RSI indicator’s support line; a bounce from it would indicate another attempt to hold above the channel boundary and continue the upward impulse.
However, a break of this line could end the formation of the reversal pattern “Head and Shoulders” on the RSI chart; in that case the target of the decline would be $50.

Daily chart LTC/USD from TradingView
On the 4-hour chart, quotes correct within an ascending channel. Here a bullish pattern “5-0” forms; within this pattern a test of the lower boundary of the ascending channel at $57 is expected, followed by a rise toward $68.90.
An additional signal in favor of this scenario would be a rebound from the RSI trend line. A breach of this line could signal a move lower to $55, with a drop toward $46 as a possible outcome.
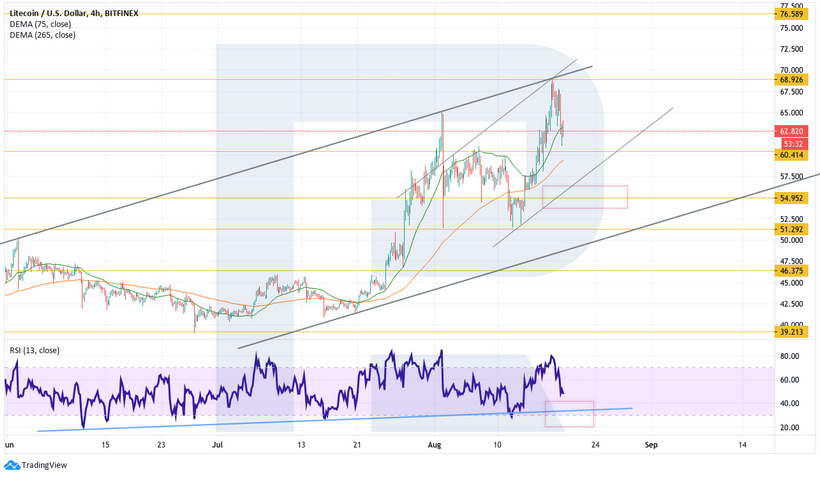
4-hour chart LTC/USD from TradingView
EOS
EOS cryptocurrency bounced off the upper boundary of the ascending channel, which is negative for bulls. However prices continue to hold above the Ichimoku Cloud signal lines, indicating bullish impulse.
If the price closes above $4.06, expect the price to continue rising at least by the width of the current channel.
An additional signal in favour of the continuation of the growth scenario is a rebound from the RSI trend line; if the values fall below the trend line, one can speak of a new attempt at a downward correction toward $2.40.
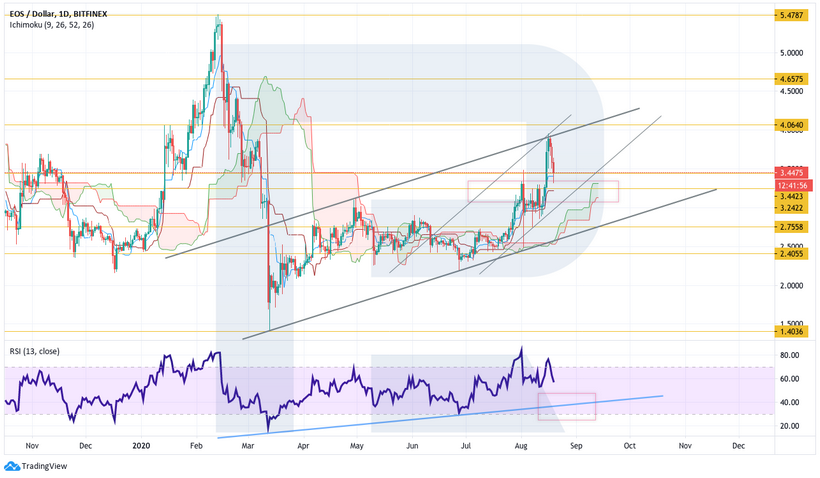
Daily chart EOS/USD on Bitfinex from TradingView
On the 4-hour chart prices have approached the upper boundary of Ichimoku Cloud.
Consider an upward rebound already from current levels. The nearest upside target is $3.95.
An additional signal in favour of this scenario is a rebound from the RSI trend line, as we can see values have almost tested this line.
An invalidation for the positive scenario for buyers could be a break below the lower boundary of the ascending channel with price dropping under $3.25. In this case one could consider a decline toward $2.78.
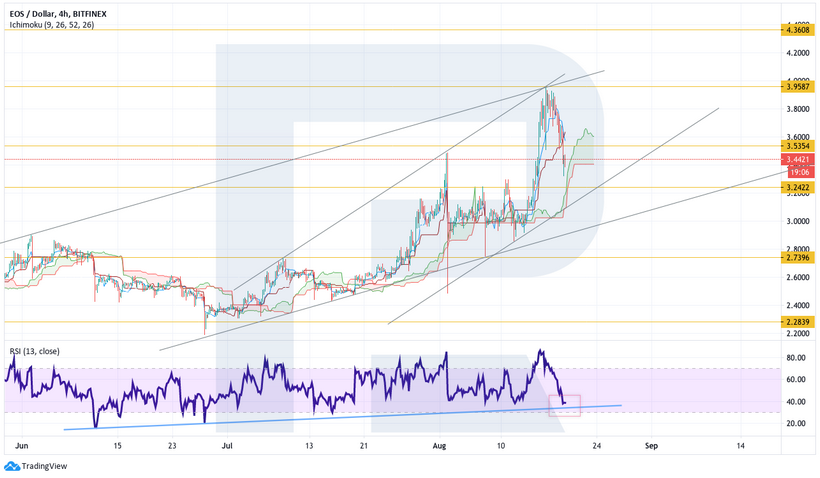
4-hour chart EOS/USD on Bitfinex from TradingView
Chainlink
Chainlink quotes move within an aggressive bullish trend. Buyers have broken upward through one channel, and currently buying pressure from bulls remains unabated.
RSI is expected to test the support line soon, which would indicate another bounce upward and a rise toward $25.
An invalidation would be a break below the lower boundary of the ascending channel with price closing below $14, which would signal continuation of the correction toward $9.10.
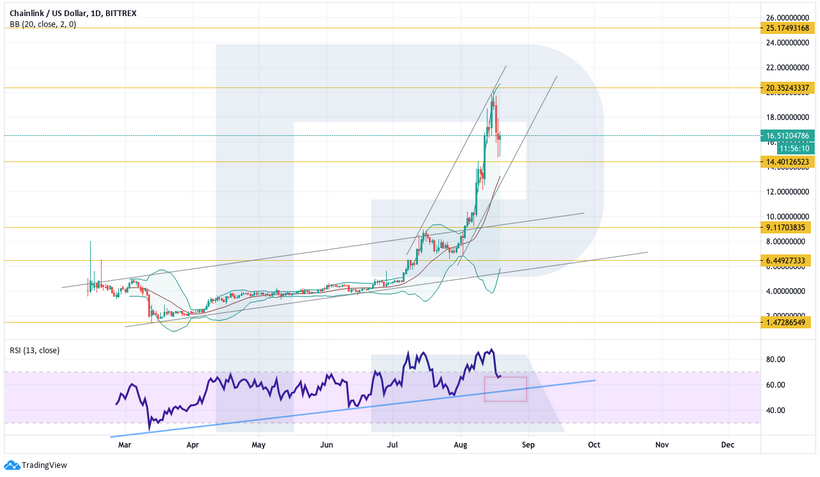
Daily chart LINK/USD on Bitfinex from TradingView
On smaller timeframes, prices are decreasing within a channel, but there is potential for forming a double-bottom reversal pattern. Therefore, with a break of the resistance area and price above $17.10, consider continuing growth toward $18.40 as part of the pattern’s realization.
A strong signal in favor of this scenario is also a breakout of the downward trendline on the RSI indicator.
An invalidation of the positive scenario for buyers would be a decline with price closing below $14.55, which would indicate cancellation of the pattern and a continuation of the decline toward $12.00.
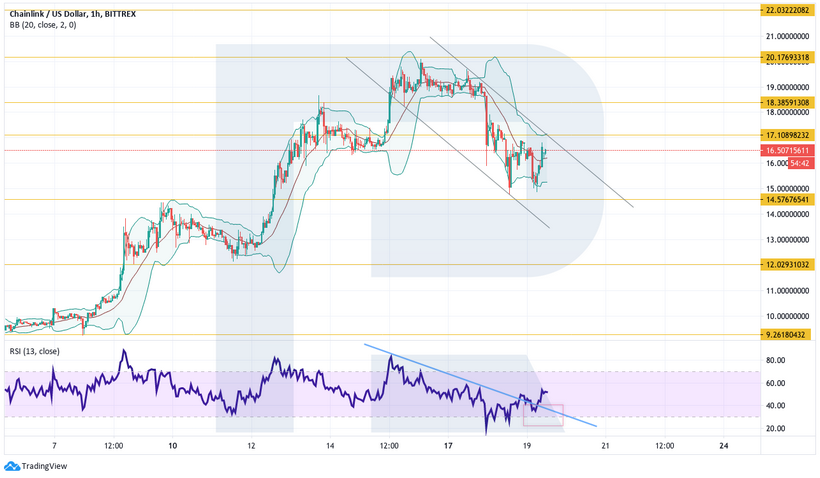
4-hour chart LINK/USD on Bitfinex from TradingView
Subscribe to Forklog news on Facebook!
Рассылки ForkLog: держите руку на пульсе биткоин-индустрии!