

Ethereum Chart Reveals ‘Bearish Pennant’ Targeting $1100
Ethereum's daily chart shows a 'Bearish Pennant' suggesting a potential drop to $1100.
The daily chart of Ethereum has formed a ‘Bearish Pennant’—a pattern indicating the likelihood of a significant downward price movement.
The deterioration of the technical picture amid declining on-chain activity suggests a potential continuation of the downtrend. In this scenario, the price of the largest altcoin risks falling to $1100.
This chart pattern emerges when, after a sharp drop, the price consolidates within an ascending triangle.
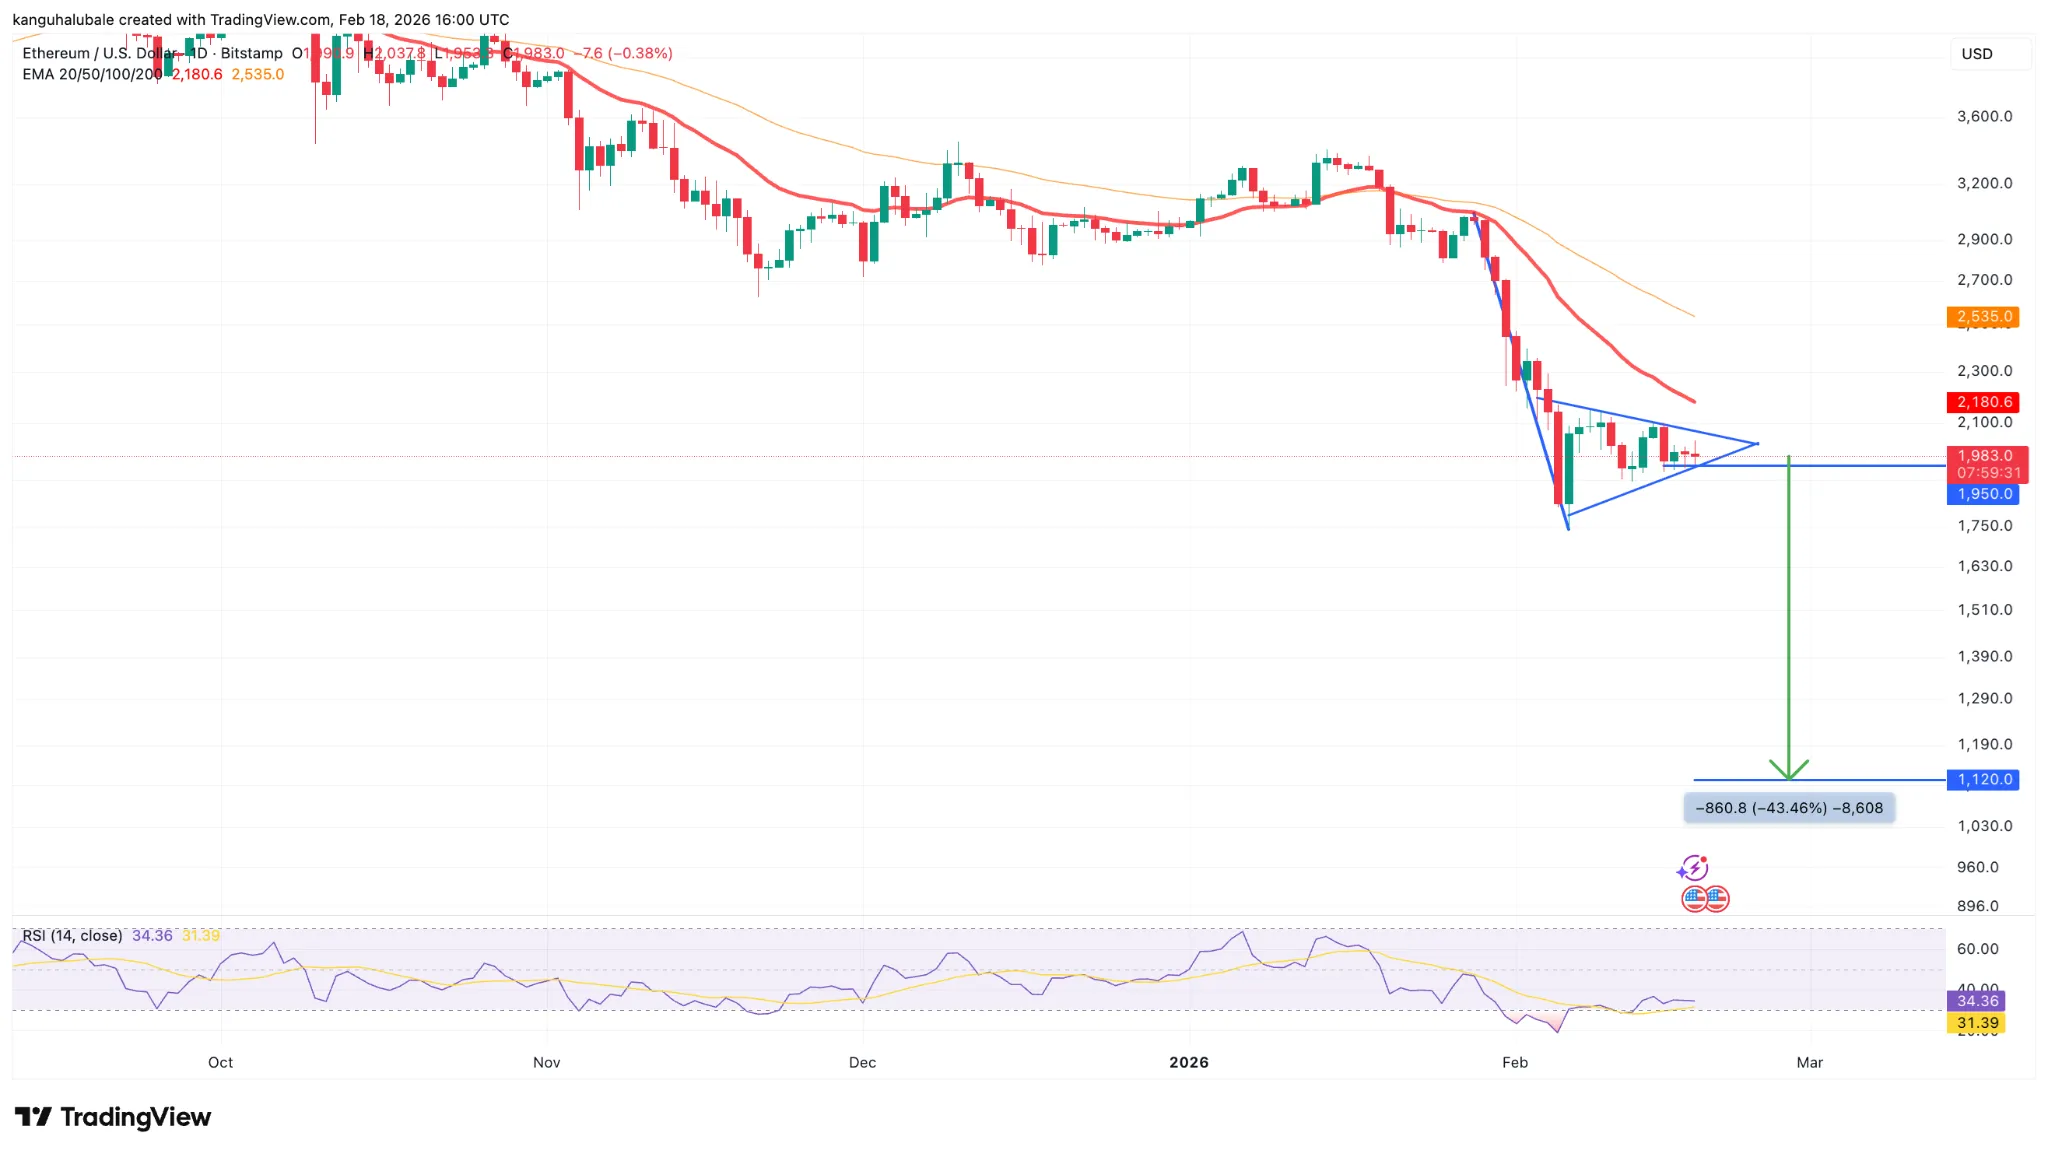
The pattern will be confirmed if the price breaks the lower boundary around $1950 on high volumes. In this case, the asset could fall by the magnitude of the previous decline—down to $1100 (a 43% drop from current levels).
According to crypto analyst Crypto Patel, to negate this scenario, the price must hold above the support level at $1800.
$ETH Broke My Heart Twice
First Dagger → Bull Flag lost & BreakDown $3,700 Level.
Second Dagger → Ascending Triangle failed and Broken $3,000 SupportNow Trading Between $2000-$1850
Watching These Levels Closely:
Hold $1,800 → Relief Bounce Toward $2,650
Lose $1,800 →… pic.twitter.com/rpAYK2yyNa— Crypto Patel (@CryptoPatel) February 16, 2026
Decline in On-Chain Activity
The drop in Ethereum’s network activity also pressures the asset’s price. On February 18, the daily transaction volume was 1.95 million—about 33% less than the 2.89 million recorded on February 7.
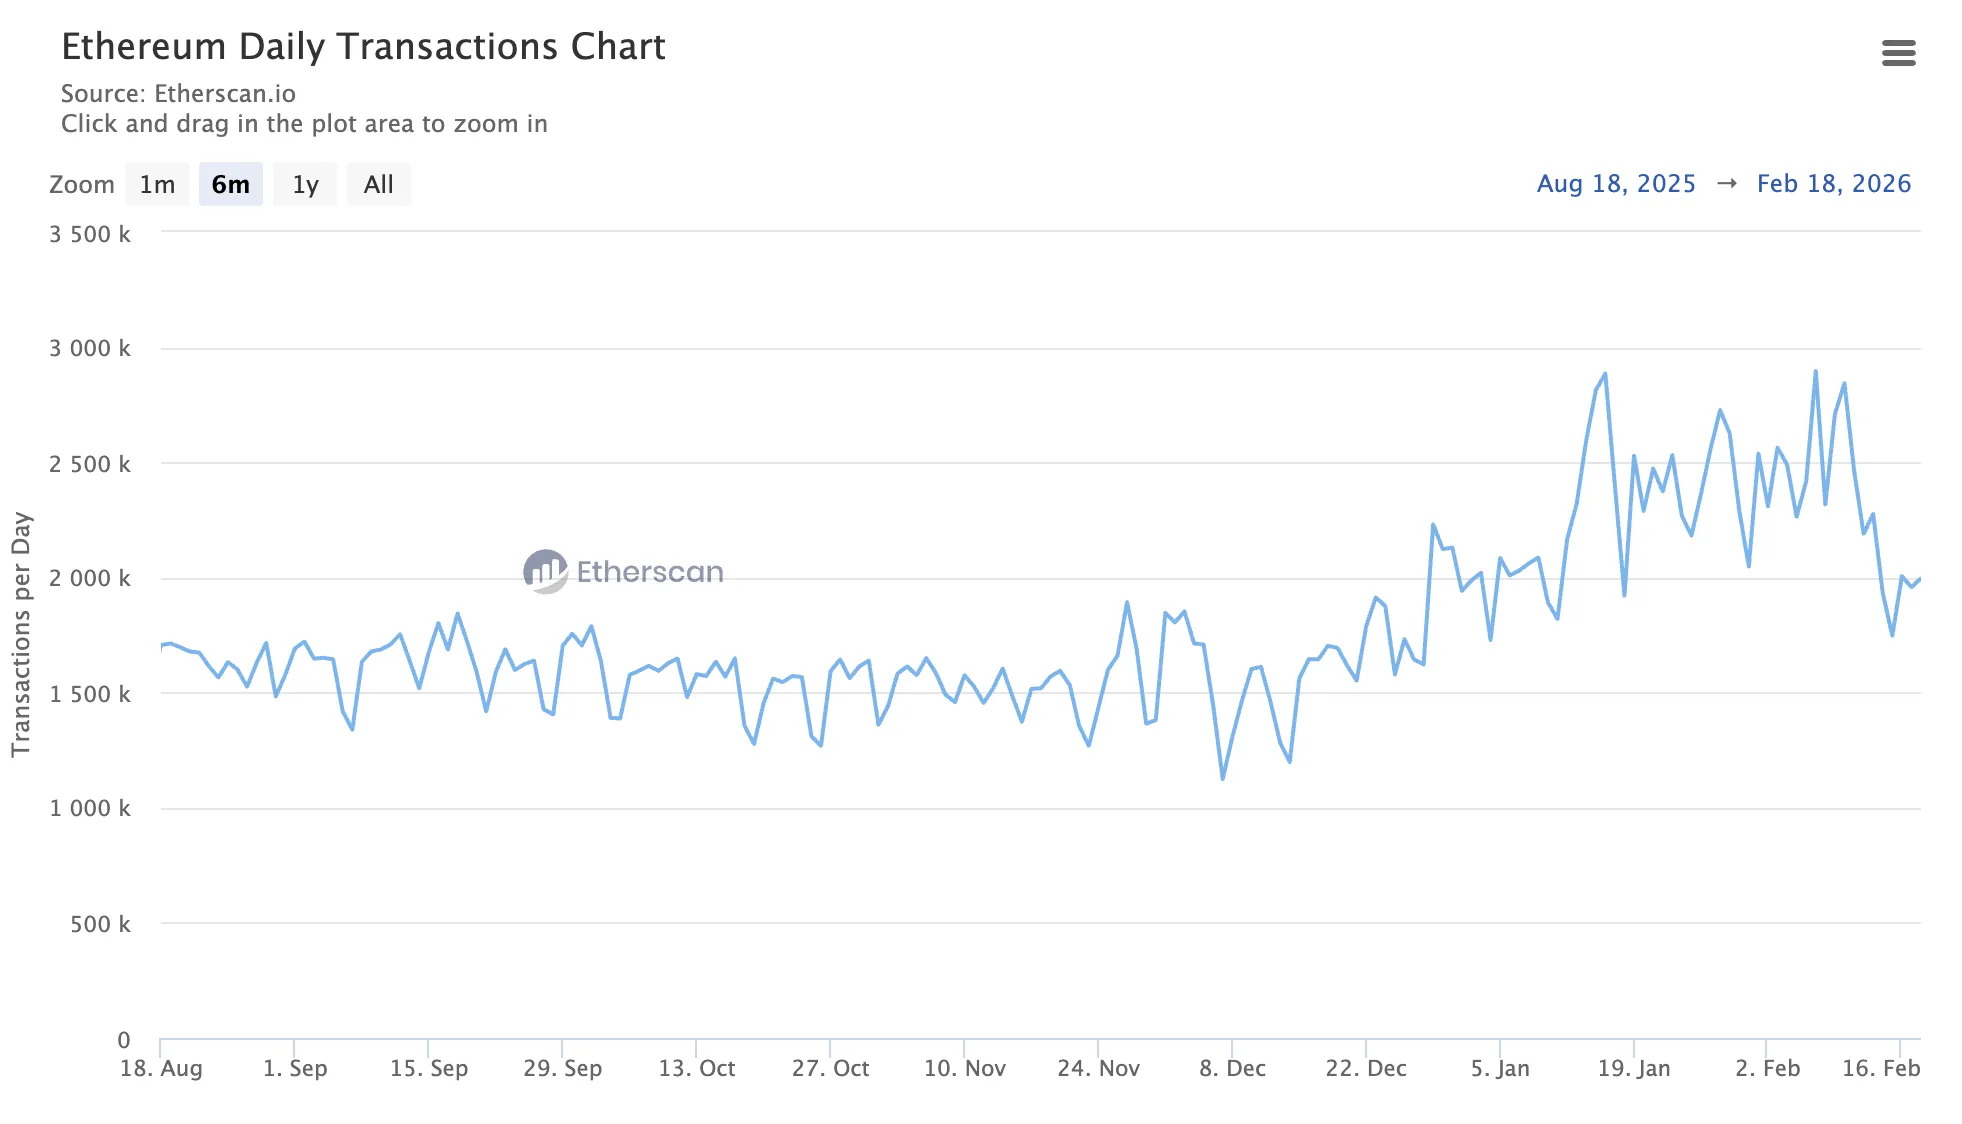
A comparable decline was observed in January 2024, when the leading altcoin’s price fell by 30%.
The stagnation in on-chain activity is also confirmed by the dynamics of TVL in DeFi applications.
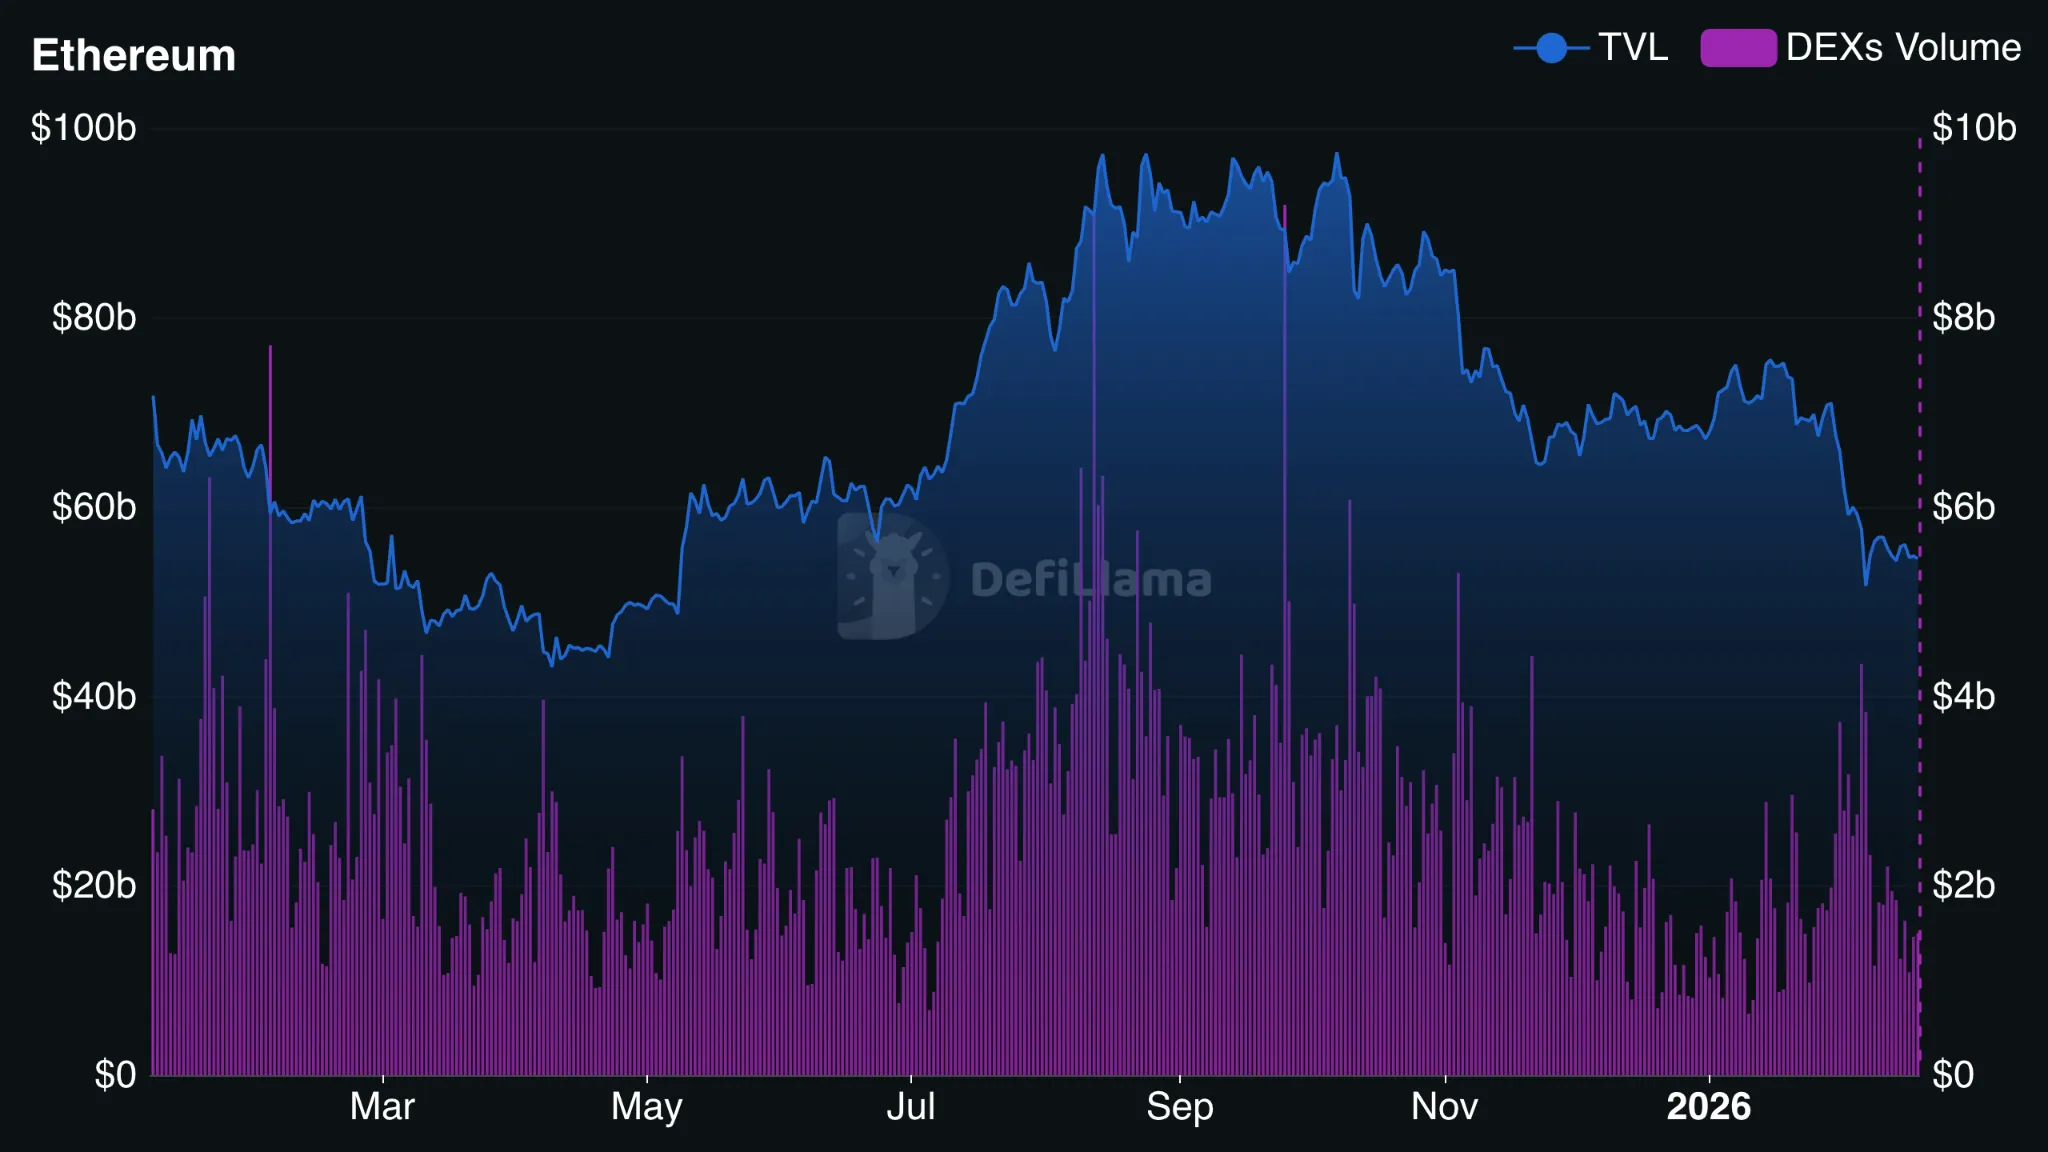
Since the beginning of February, the ecosystem’s total indicator has decreased by more than 22%—by February 18, it had fallen to $54.5 billion, down from $70 billion at the start of the month.
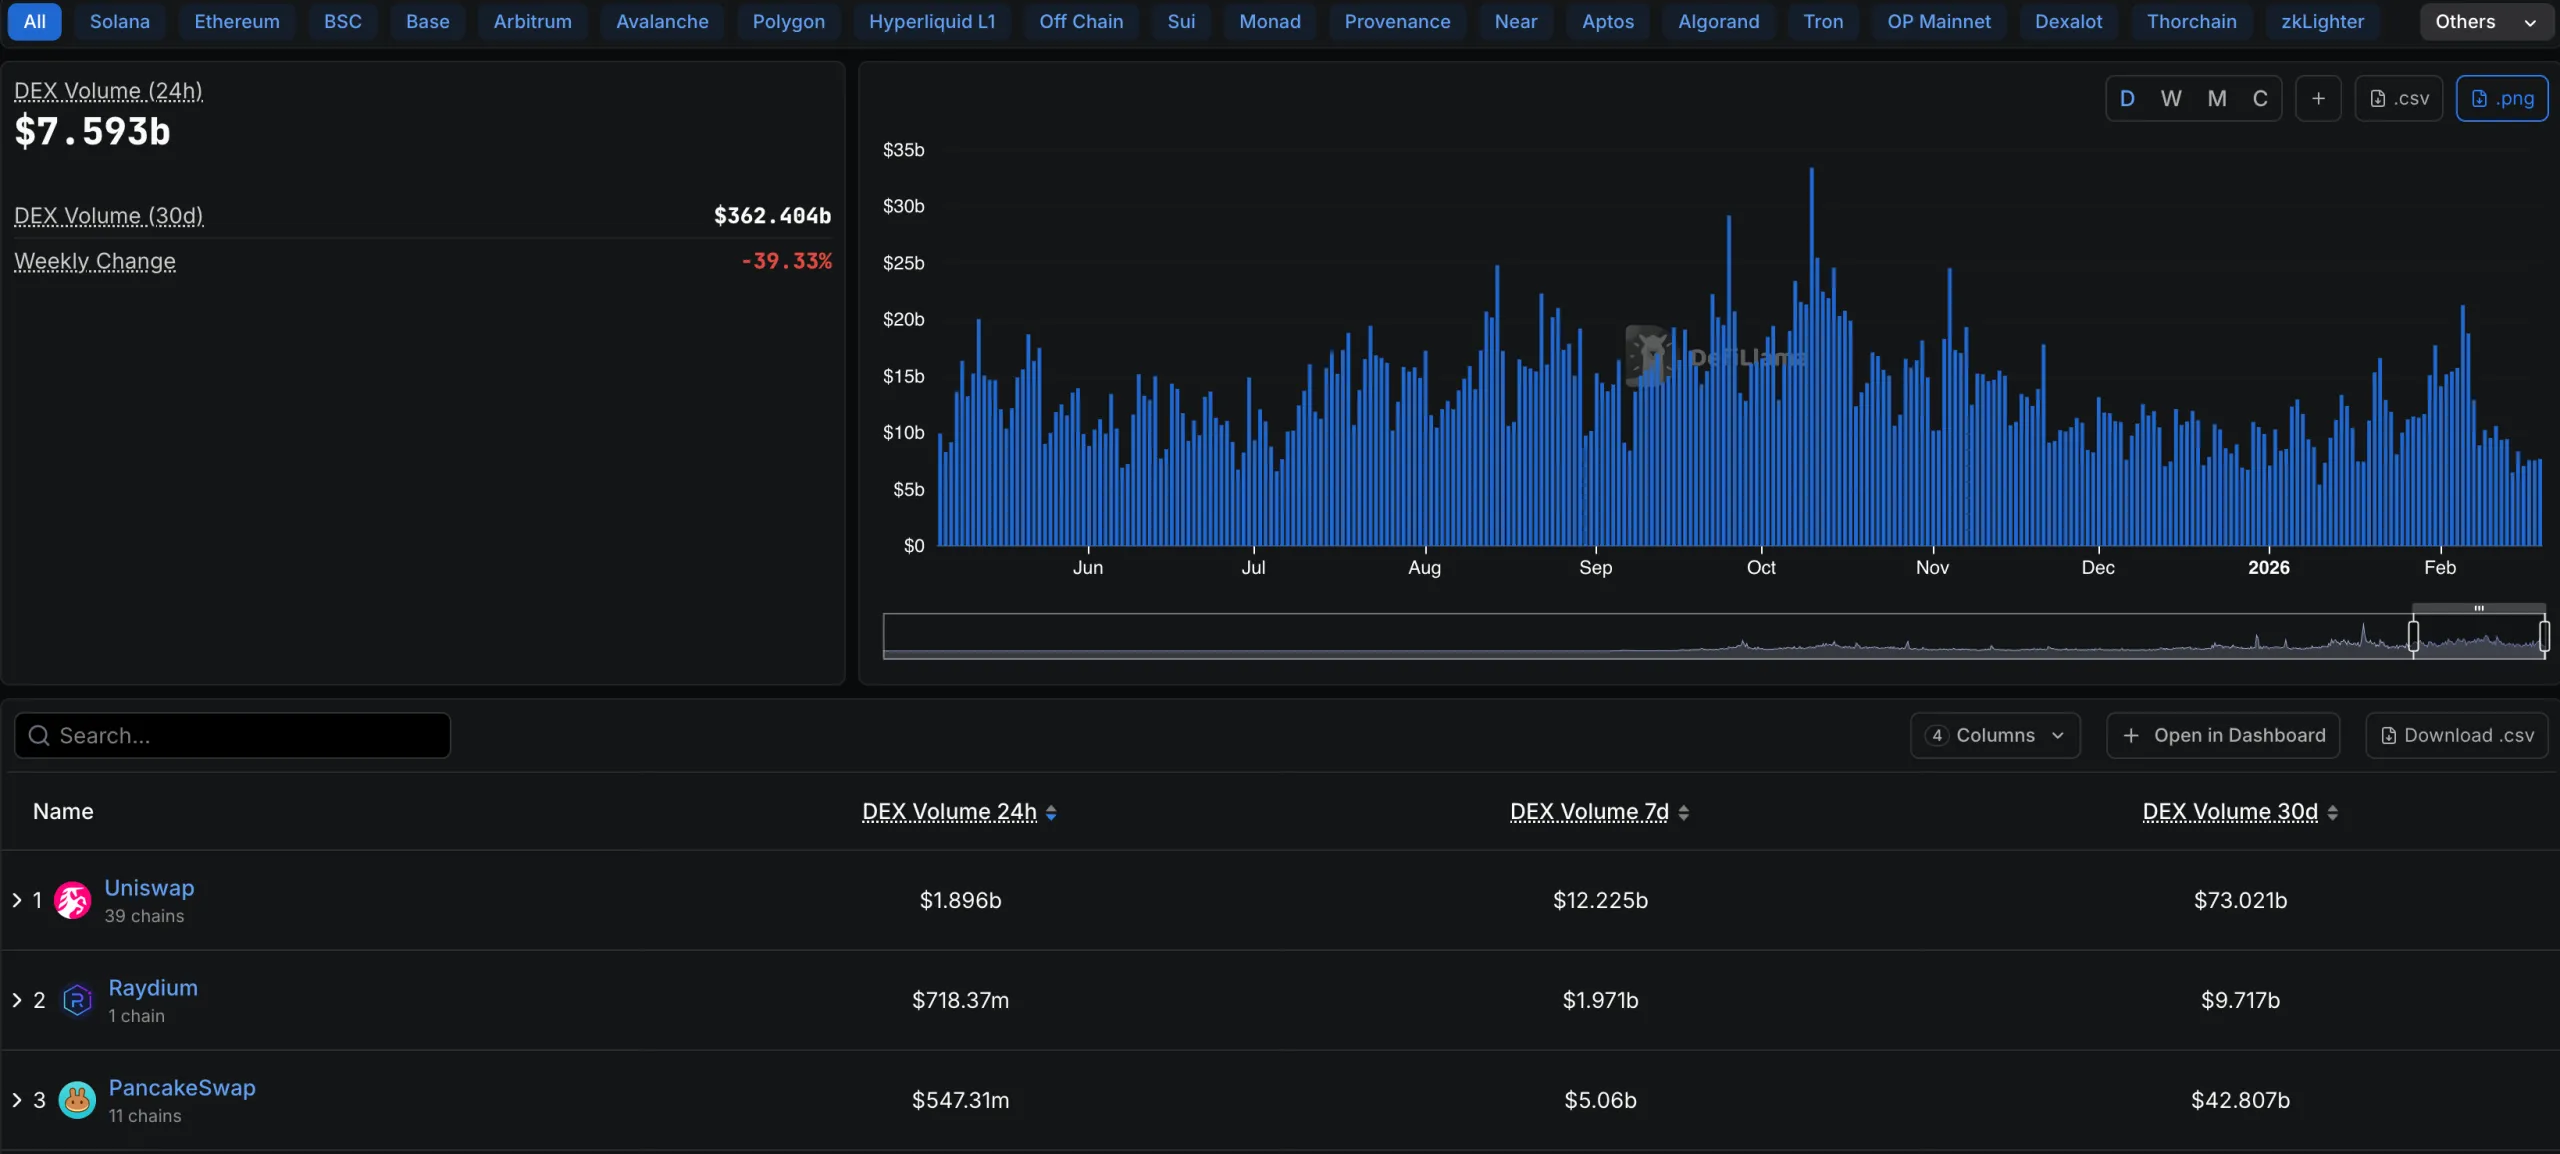
The decline in TVL is accompanied by a drop in trading activity on DEX, including the largest non-custodial exchange Uniswap.
An additional negative factor has been the four-week capital outflow from ETF based on Ethereum.
Back in February, a ‘Bearish Pennant’ also formed on Bitcoin’s daily chart. The potential target is the $56,000 level within the month.
Рассылки ForkLog: держите руку на пульсе биткоин-индустрии!