


The daily number of transfers on the leading altcoin’s blockchain has approached 1.3 million, yet ETH’s price remains range-bound. A CryptoQuant analyst using the pseudonym CryptoOnchain called the divergence a bullish signal: fundamentals are growing faster than the market.
Ethereum Network Activity Reaches New ATH: A Bullish Fundamental Divergence
“If this strong utility trend persists, the probability of the price eventually catching up with these robust on-chain fundamentals in the mid-term remains highly favorable.” – By @CryptoOnchain pic.twitter.com/doE1Lrg0RL
— CryptoQuant.com (@cryptoquant_com) April 10, 2026
The all-time high for the metric was set in February. Now, Ethereum’s transaction count has almost returned to that level, pointing to several notable on-chain signals:
- a record in transfers signals user growth and ecosystem development driven by DeFi, L2 solutions and applications. It suggests ETH is being used rather than left idle in wallets;
- the lag of price behind the metric implies the second-largest cryptocurrency is undervalued and lays the groundwork for an uptrend;
- rising transfer counts increase gas consumption. The fee-burn mechanism removes more ETH from circulation, supporting steady demand.
“If the trend persists, the price will likely, over time, catch up with the strong metrics,” summarised CryptoOnchain.
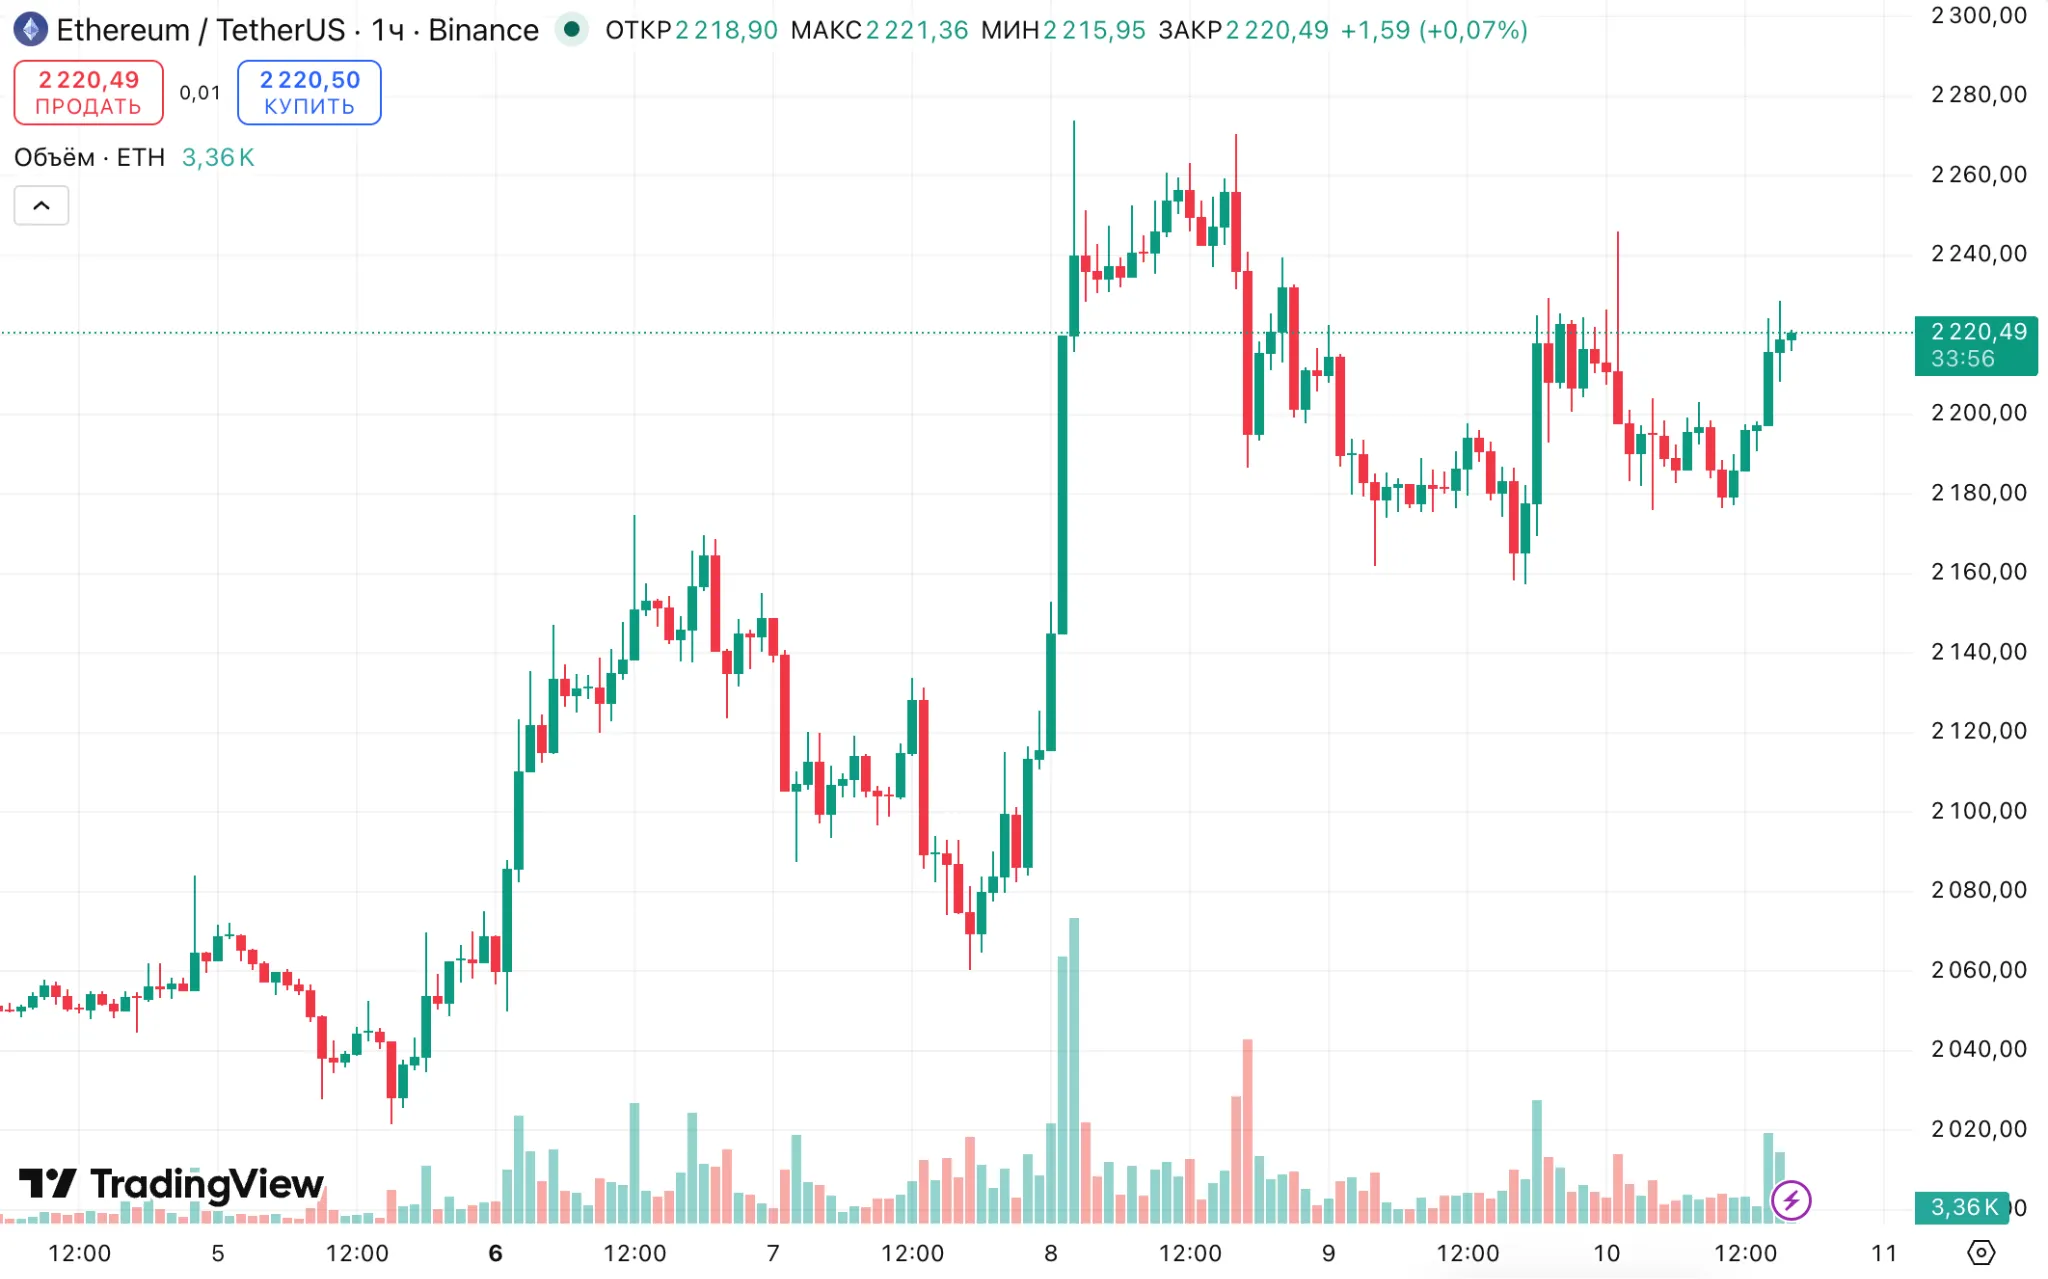
At the time of writing, Ethereum trades around $2,200. The asset is up 1.6% over the past day and 7.8% over the week.


High on-chain activity was one factor that helped the asset outpace bitcoin, noted analysts at XWIN Research Japan. In March, Ethereum rose 7.12%, versus 1.83% for the digital gold.
Why Ethereum Outperformed Bitcoin
“ETH currently benefits from simultaneous capital inflow, supply tightening, and ecosystem growth. This positions Ethereum as a structurally stronger asset in the current phase.” – By @xwinfinance pic.twitter.com/khcggqJZk6
— CryptoQuant.com (@cryptoquant_com) April 10, 2026
The altcoin also posted higher volatility (62.8% versus 48.9% for bitcoin), confirming its high-beta status. Despite strong correlation (around 0.94), Ethereum reacts more aggressively to changes in liquidity and risk appetite.
Against this backdrop, investors more often choose the second-largest cryptocurrency, viewing it as “bitcoin with leverage”, the experts said.
“The decline in trading volumes points to the influence of liquidity, but ETH is supported by capital inflows, supply tightening and ecosystem growth. That makes Ethereum structurally stronger — once liquidity improves, it may continue to outperform,” they concluded.
Ethereum undervaluation
Undervaluation is also indicated by the Capriole Macro Index Oscillator, which has fallen to -2.42. Historically, this zone is associated with capitulation and trend reversals.

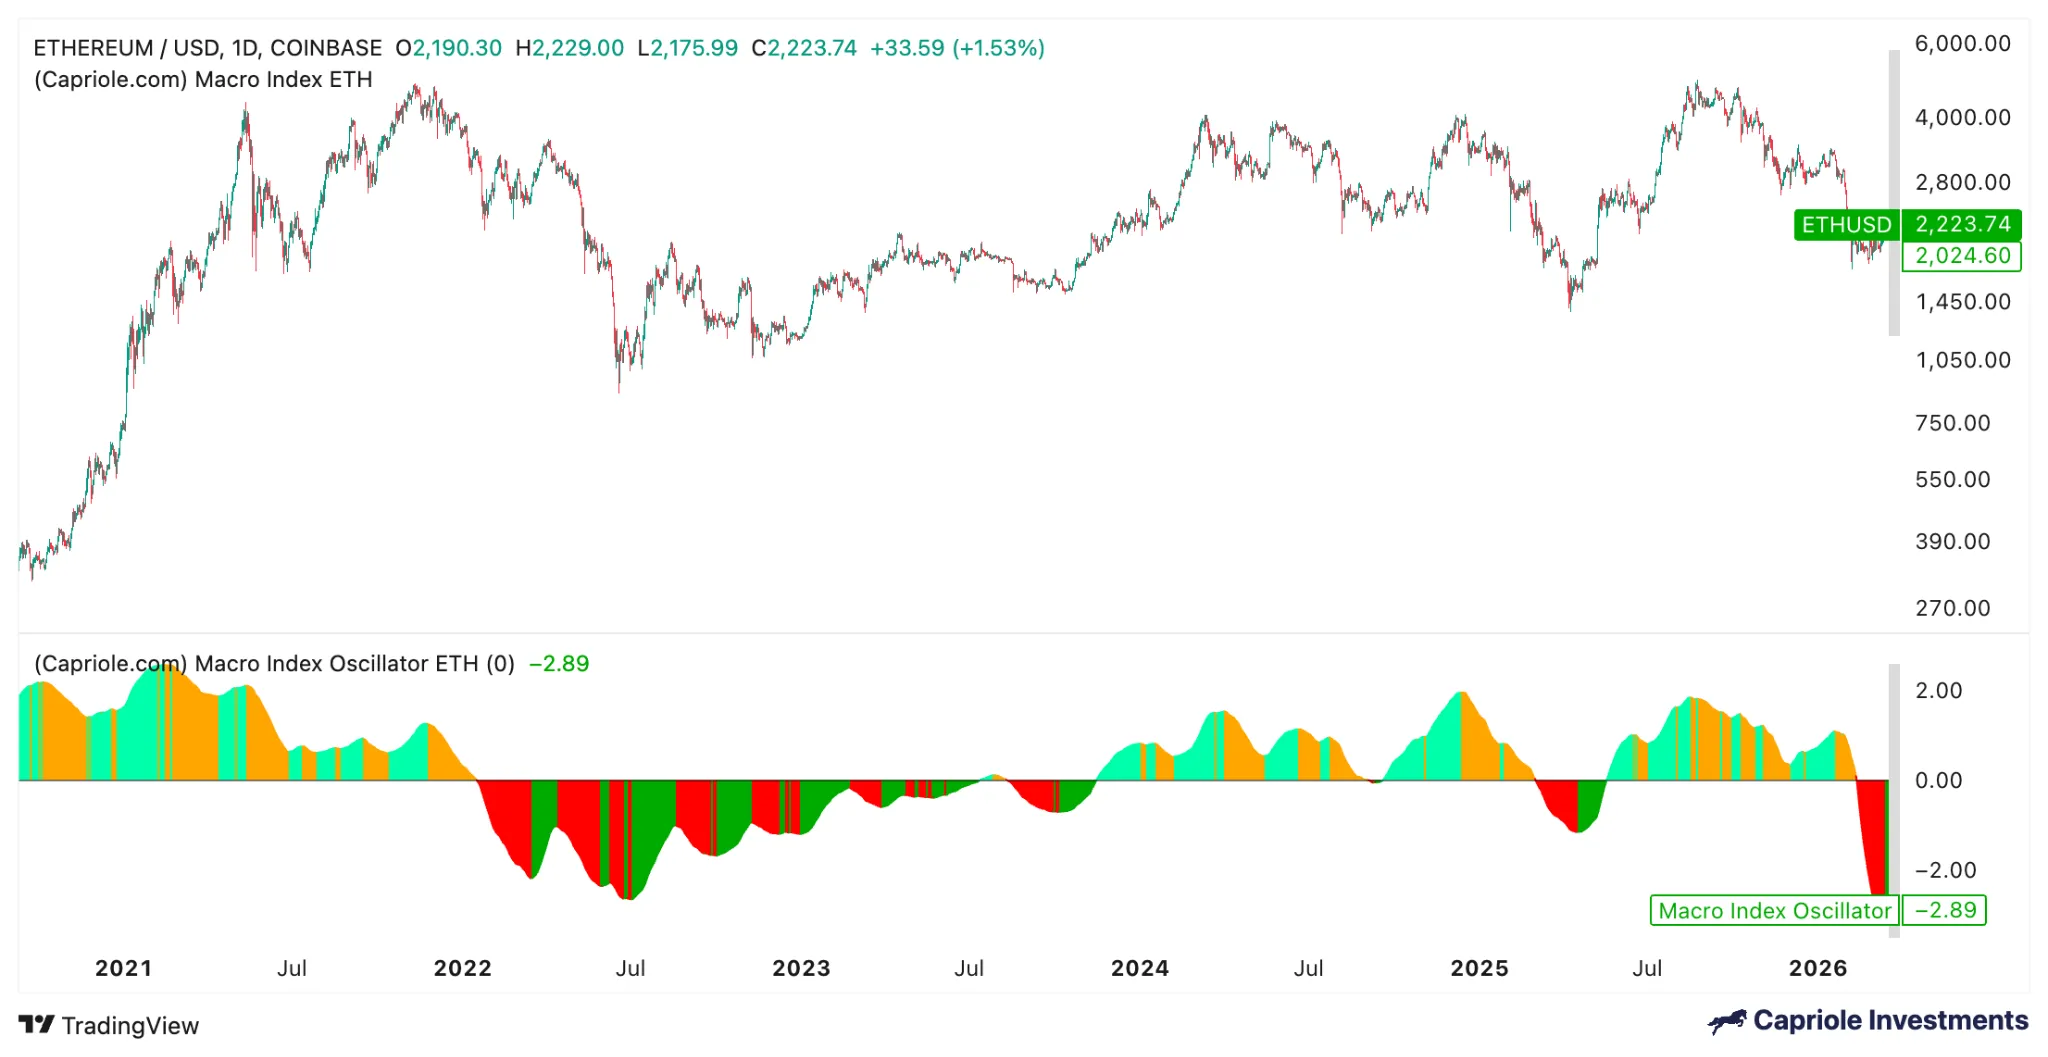
The indicator tracks investment behaviour, cycle positioning and on-chain data. Deeply negative readings often signal seller exhaustion.
In June–July 2022, Ethereum bottomed around $1,000–1,200 as the indicator fell to -2.2. In October–November 2023, a -1 reading coincided with a breakout after a drop to $1,500. In April 2025, another negative reading marked a local low near $1,500, followed by a rally above $4,000.
The current picture resembles previous capitulation phases. The altcoin has fallen from highs near $4,800 to $2,100, with the oscillator close to cyclical lows.
A reversal signal would be a return of price to the $2,400–2,500 range and the macro indicator moving back toward zero.
Earlier, an analyst known as crypto sunmoon also noted that the taker buy-sell ratio for Ethereum has been rising for four to five months. Combined with the current drawdown, the structure mirrors the set-up preceding the April–May 2025 rally.
Another positive signal
An analyst going by Darkfost also flagged the taker buy-sell ratio. According to him, the metric points to a potential recovery in the second-largest cryptocurrency.
✅Ethereum derivatives show early signs of recovery.
Despite a persistently uncertain macro environment, several signals point to a gradual improvement in Ethereum, particularly on the derivatives side.
💥 It has been nearly three years since such a setup was last observed in… pic.twitter.com/r9lyLiTL1W
— Darkfost (@Darkfost_Coc) April 9, 2026
On Binance, the metric has turned positive for the first time in three years. It has stayed above 1 for several days — at 1.016.
According to the expert, the dynamics reflect a gradual return of buyer dominance in the perpetuals segment. This points to the early stage of a more constructive trend.
“The signal matters given that Binance accounts for more than 37% of total open interest in ETH. The venue is key for assessing positioning in the derivatives market,” stressed Darkfost.
Earlier, CryptoQuant analysts linked April’s rally in bitcoin and Ethereum to the opening of new long positions in the perpetual futures market.