


The amount of Bitcoin in ‘paper’ profit reached a peak not seen since November 2021, but its average size remains insufficient to trigger a wave of hodlers’ position closures, according to Glassnode.
The volume of ‘positive’ supply surpassed 16.366 million BTC, equivalent to 83.6% of all coins in circulation.


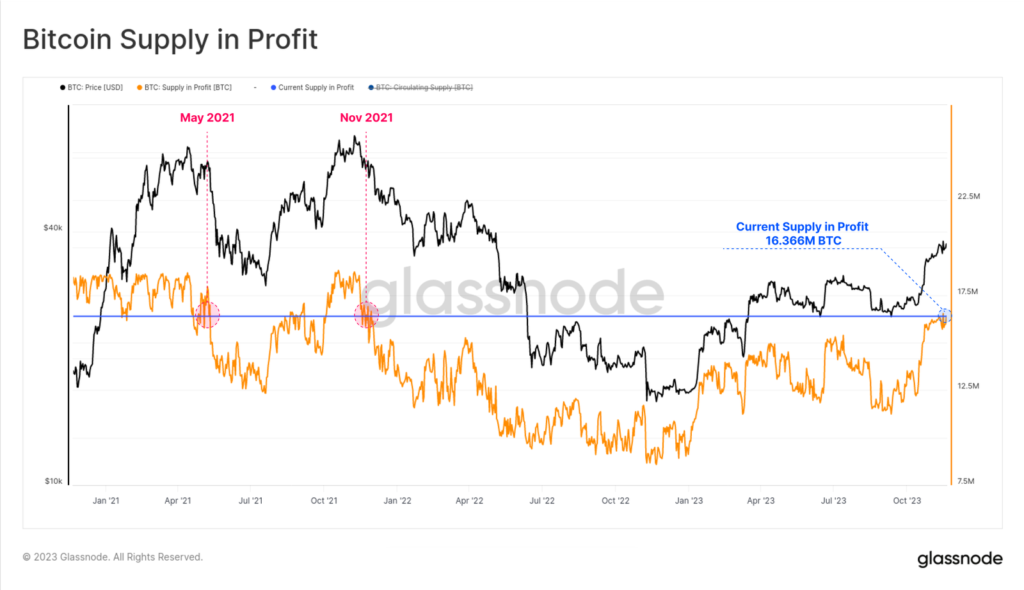
The indicator significantly exceeds the all-time average (74%) and is approaching the one-standard-deviation boundary (90%). Crossing this threshold, the analysts emphasised, signals the start of a euphoric bull-market phase.


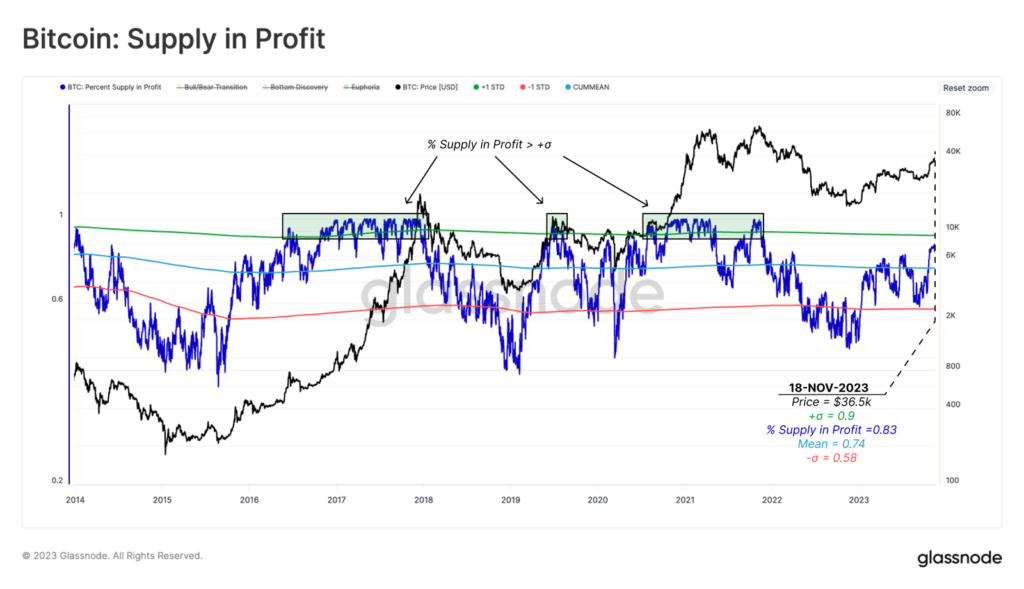
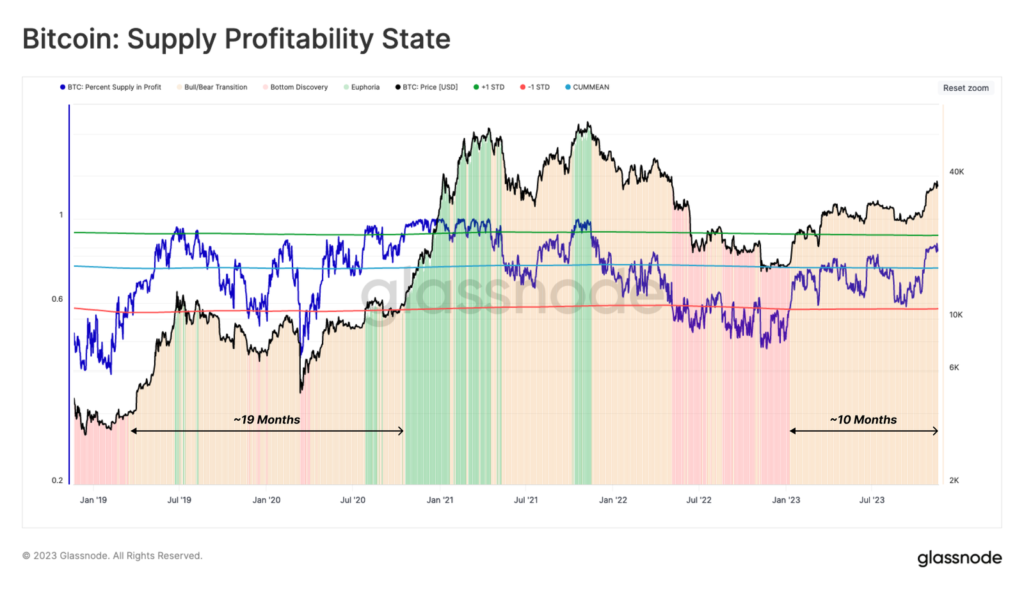
The chart below outlines three typical phases of the ‘profitability’ cycle over the last five years:
- bottoming ?, when fewer than 58% (std) of coins in circulation are in profit;
- bearish/bullish transition ?, when the market recovers after the preceding phase (or exits the euphoria), and the share of bitcoins in profit sits in a range from 58% to 90%;
- euphoria ?, when the majority of coins are in profit as the price reaches ATH (+1 std).
The last 10 months have seen the market in a transition from a bear to a bull trend. For much of 2023 the metric traded below the average (58%), but a sustained breakout followed October’s rally.
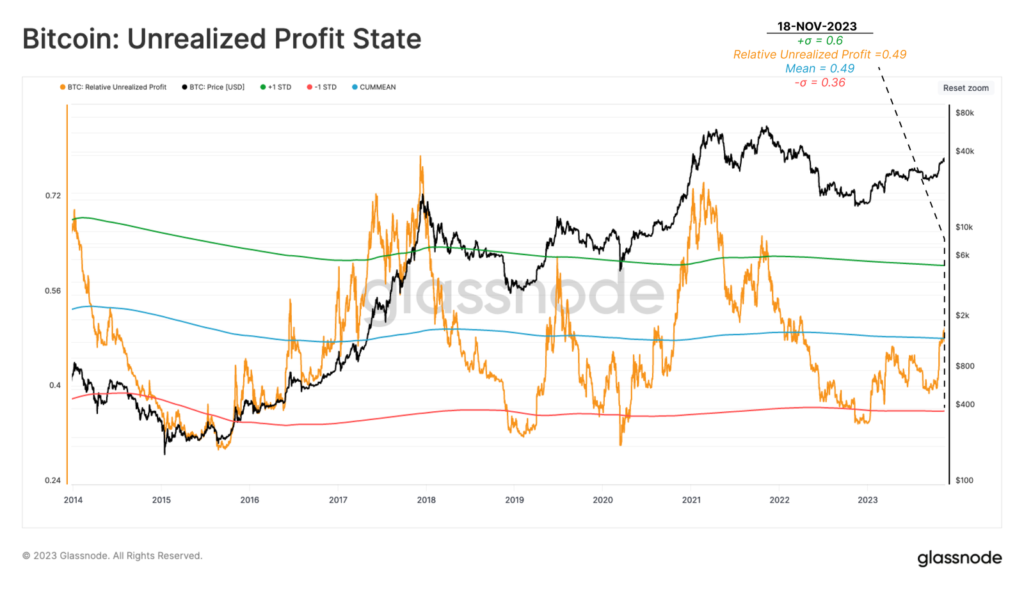
The following chart of unrealised profit also adds the mean and standard deviations. The indicator displays the financial result relative to each dollar invested.
Unlike the previous case, this metric has not yet reached a statistically high level associated with the hot phases of a bull run. It currently sits back at the 49% average, far below the extreme levels above 60% observed during euphoric phases.
“While a substantial portion of the supply is in profit, most of which is based on costs only marginally below the current spot price”, — the analysts explained.
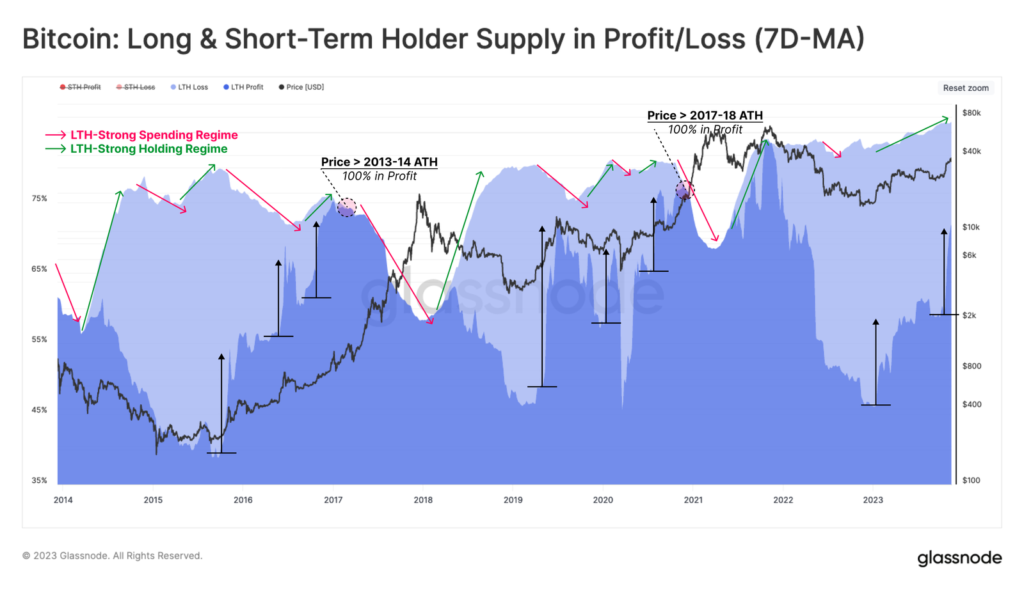
According to the analysts, the dynamics of Bitcoins held by long‑term investors are cyclical. They highlighted different regimes of spending patterns and hodling:
- before returning to ATH, the supply by LTH undergoes a lengthy period of renewed accumulation, with the aggregate value typically remaining flat or rising slightly;
- as the market exits the previous cycle, the incentive to increase spending rises markedly; this is reflected in a sharp reduction in the amount of BTC held by LTH as coins are transferred to new buyers at increasingly higher prices.
Throughout the bear market of 2022, the first phase unfolded in line with past patterns, with LTH supply rising sharply. The difference from the 2015-16 and 2018-20 cycles lies in the more tempered trajectory.
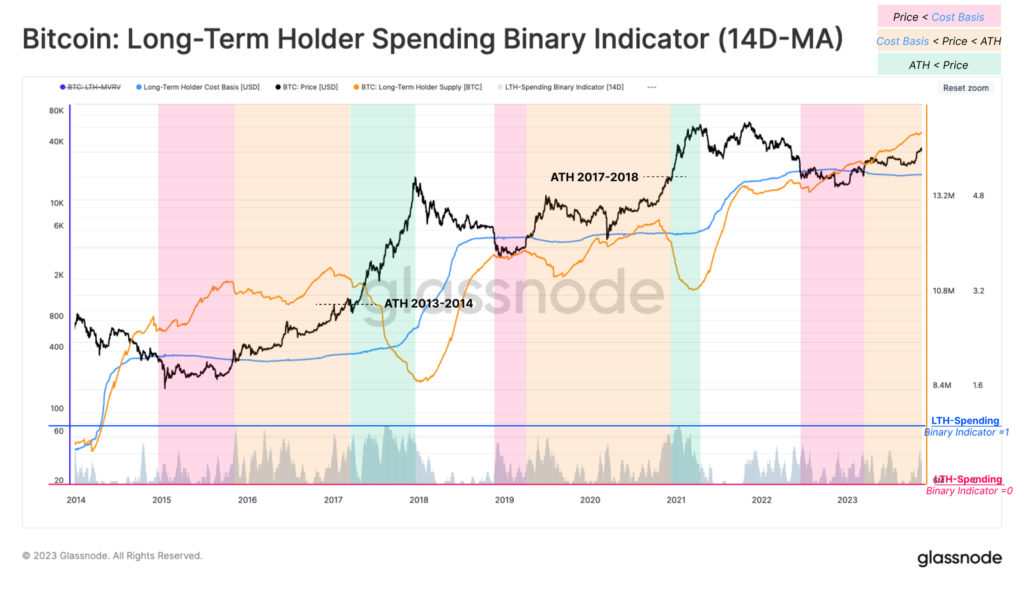
In conclusion, experts suggested examining the 14D—MA of the expenditure binary indicator applied to long-term investors (SBI).
Measuring hodlers’ spending, the indicator helps split the long, rocky journey between bear-market lows and new trajectories into three sub-intervals:
- bottoming ?, when the spot price trades below LTH’s cost basis;
- equilibrium ?, where the price trades above LTH’s cost basis but below ATH;
- price discovery ?, as the price breaks above the two latest metrics.
Currently, the SBI signals only modest hodlers’ spending, which analysts say is another sign of constrained supply.
As Glassnode notes, the available supply of digital gold has fallen to historical lows, and the velocity of moving coins into long-term storage is about 2.48 times exceeds the pace of its emission, according to Glassnode.
Earlier, analysts noted that, in anticipation of the halving and ETF, long-term investors have accumulated a record number of bitcoins.
Earlier, JPMorgan analysts called the crypto rally “overheated”, likely to reverse sharply after the expected approval of a spot-based ETF backed by digital gold.