


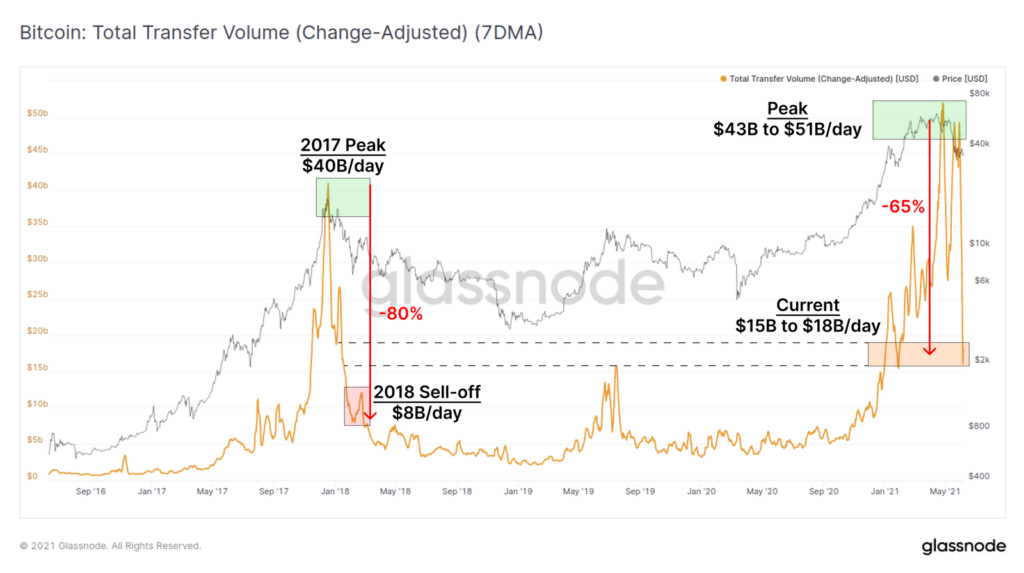
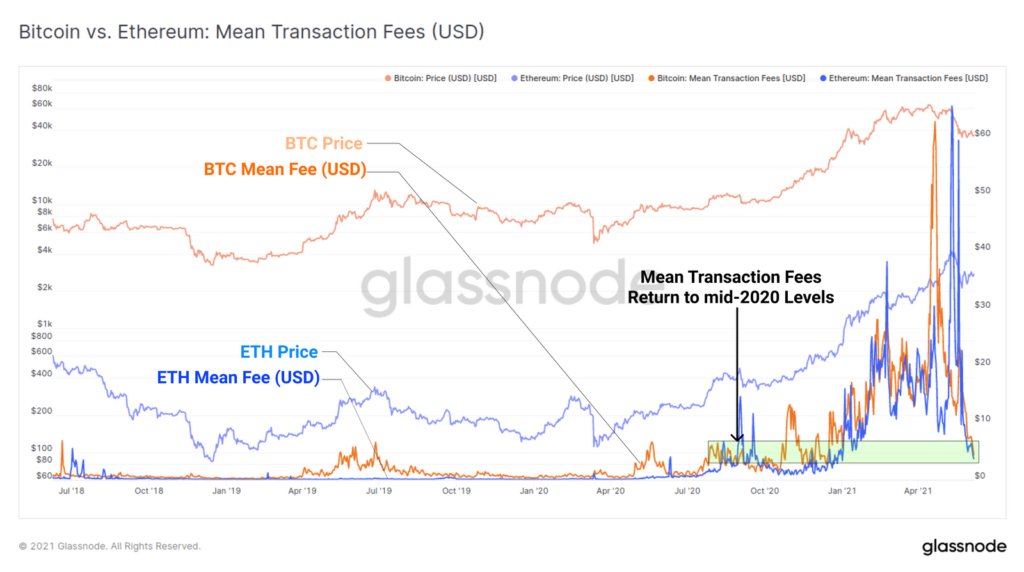
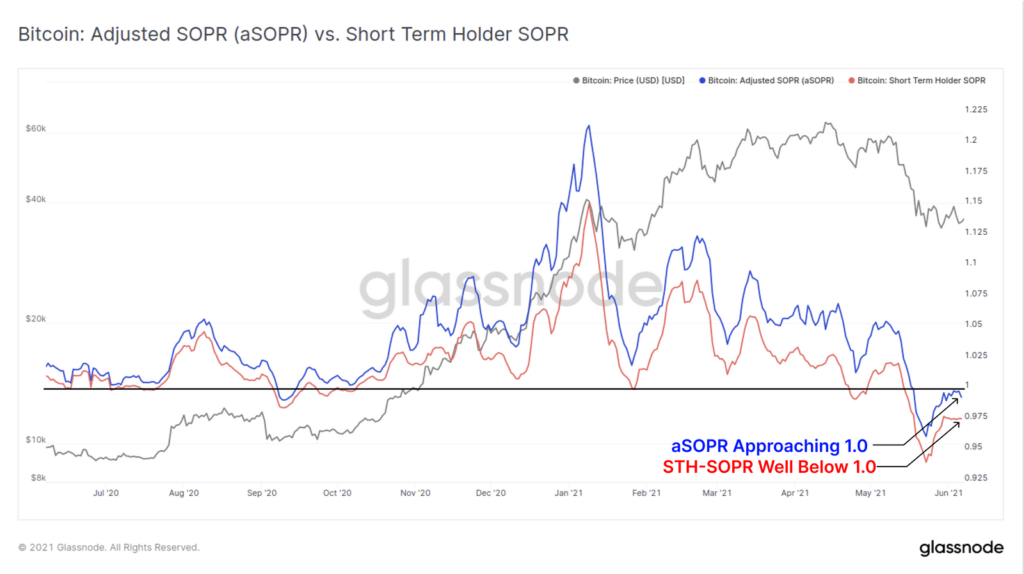
Metrics for active users, on-chain value transferred, and transaction fees in the Bitcoin network for the prior week fell to levels seen at the end of 2020 and the start of 2021. These observations were shared by Glassnode analysts.
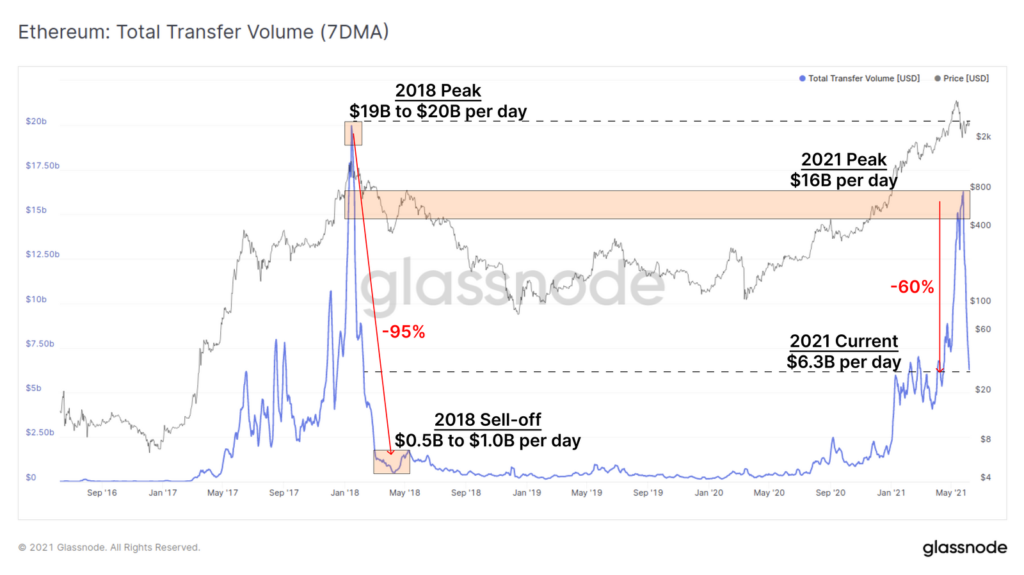
The demand for both #Bitcoin and #Ethereum blockspace has fallen dramatically this week, with many usage metrics breaking down.
We analyse:
— Active on-chain usage
— Falling blockspace demand
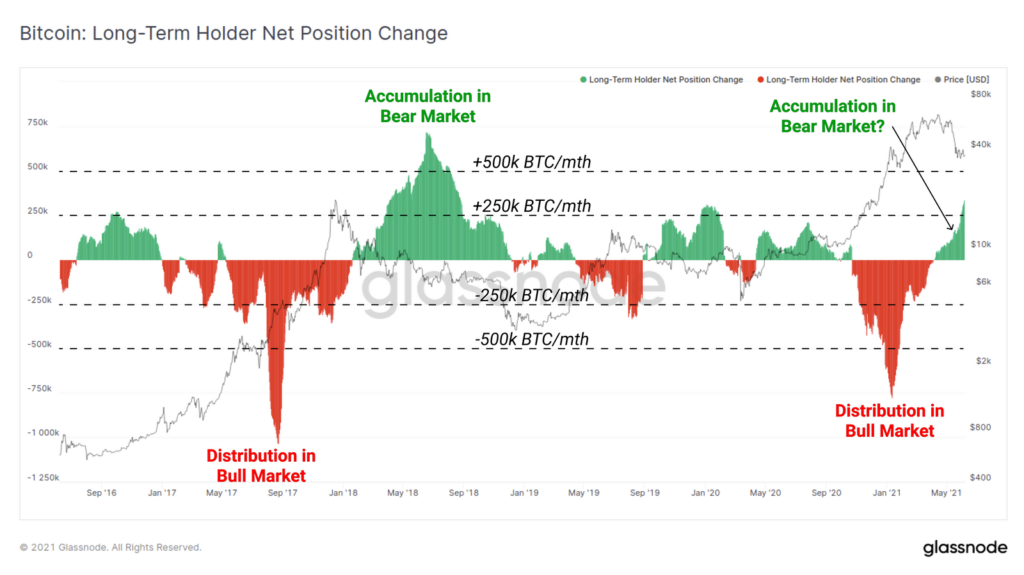
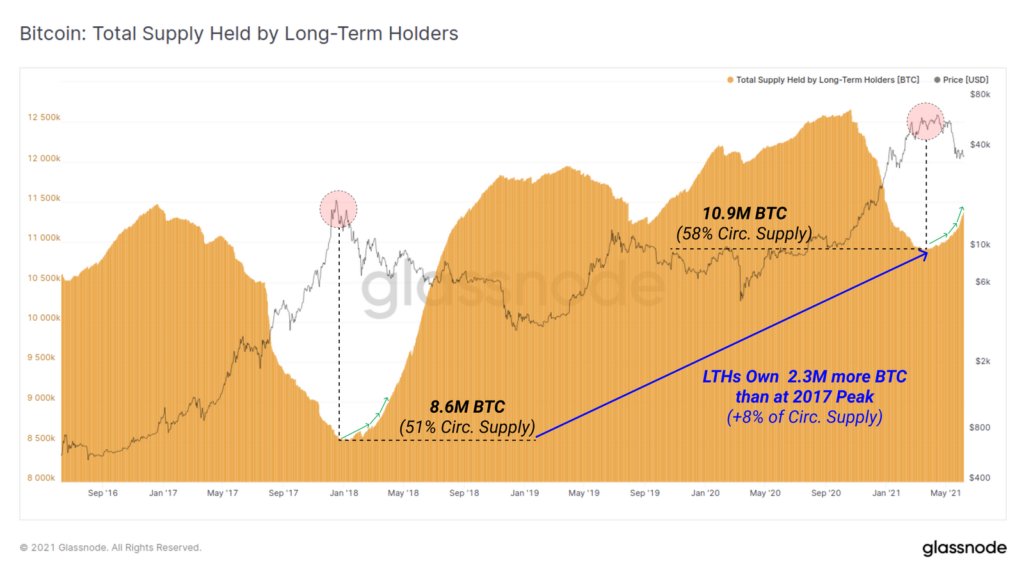
— Long-Term Holder supplyRead more in The Week On-chain👇https://t.co/8E6VOBOl5A
— glassnode (@glassnode) June 7, 2021
Experts noted that such on-chain metric dynamics, together with the clearing of mempool congestion, point to a high degree of uncertainty about the direction of the price vector.
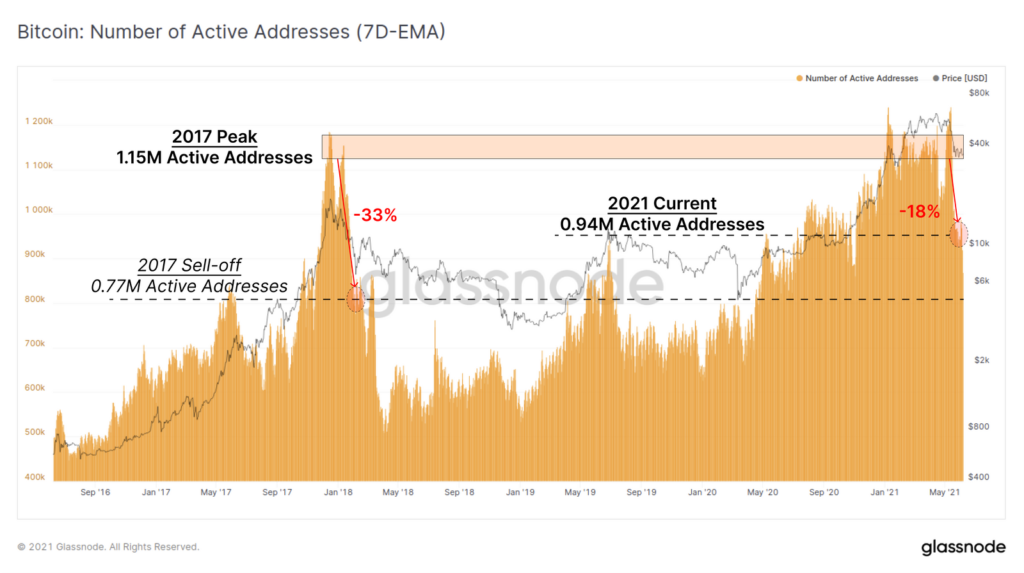
The seven-day moving average of active Bitcoin addresses fell 18% from recent peaks to around 940,000. In 2018, after Bitcoin reached an all-time high at the time, the drop was 33%.


Earlier, ForkLog’s experts outlined the criteria for the transition of the current correction into a bear market.
Subscribe to ForkLog news on VK!