


The dynamics of capital flows, exchange activity, leverage in crypto derivatives, and institutional demand all point to a surge in risk appetite among Bitcoin investors, according to Glassnode.
The risk appetite for #Bitcoin investors is increasing, with growing signs of speculation appearing across capital flows, exchange activity, derivatives leverage, and even institutional demand.
Discover more in the latest Week On-Chain below?https://t.co/4hL2kqpzOo pic.twitter.com/QdjnBuOtm7
— glassnode (@glassnode) February 27, 2024
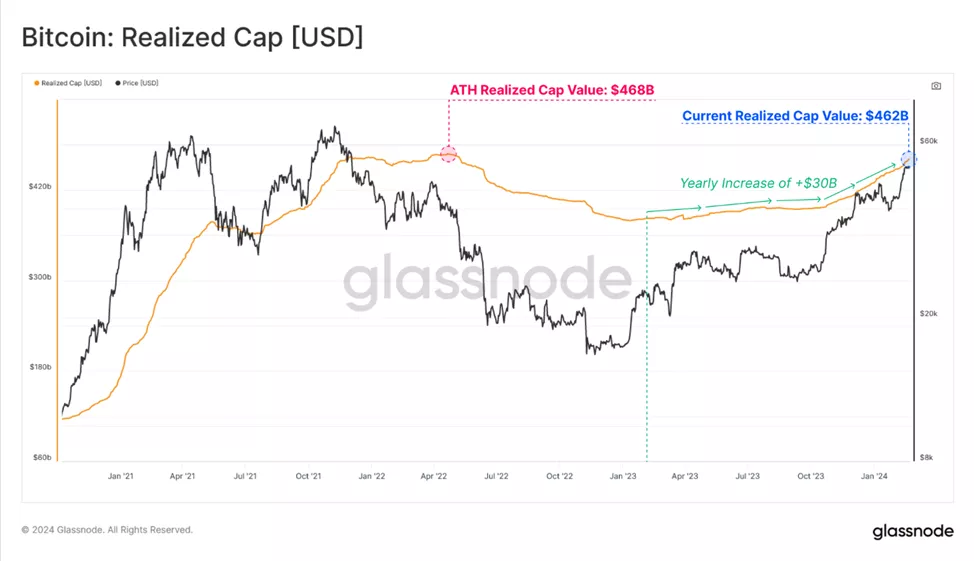
Analysts noted that the consolidation around $52,000 before the surge to $59,000 was supported by fresh capital inflows. This was reflected in a $30 billion increase in the realized capitalization metric since the beginning of the year. The indicator reached $460 billion, just 3% below its ATH.


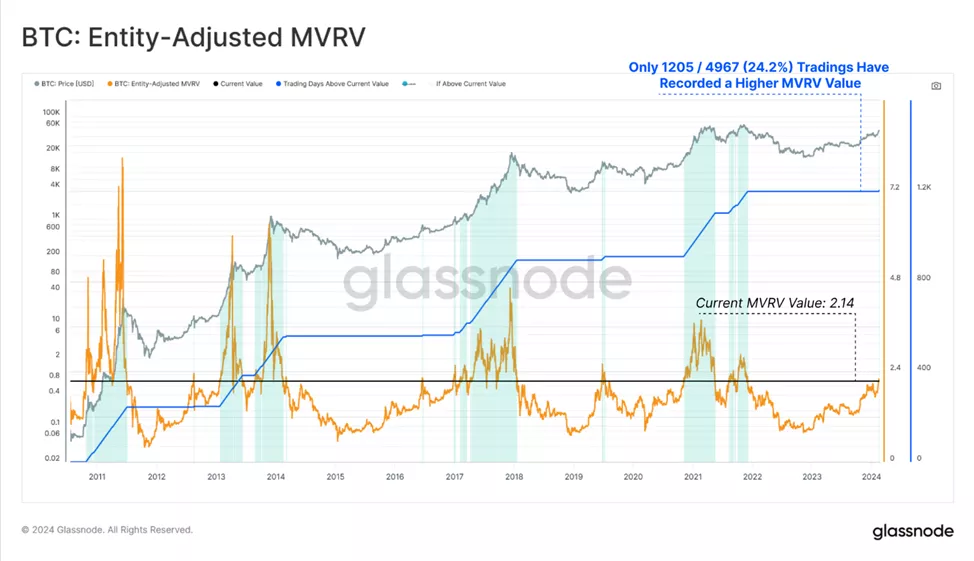
Even before the new rally phase, the unrealized profit of the ‘average’ holder reached 120%—the highest since November 2022. Such a high value was observed only in 1126 out of 4965 (22.7%) trading days, based on the analysis of MVRV.
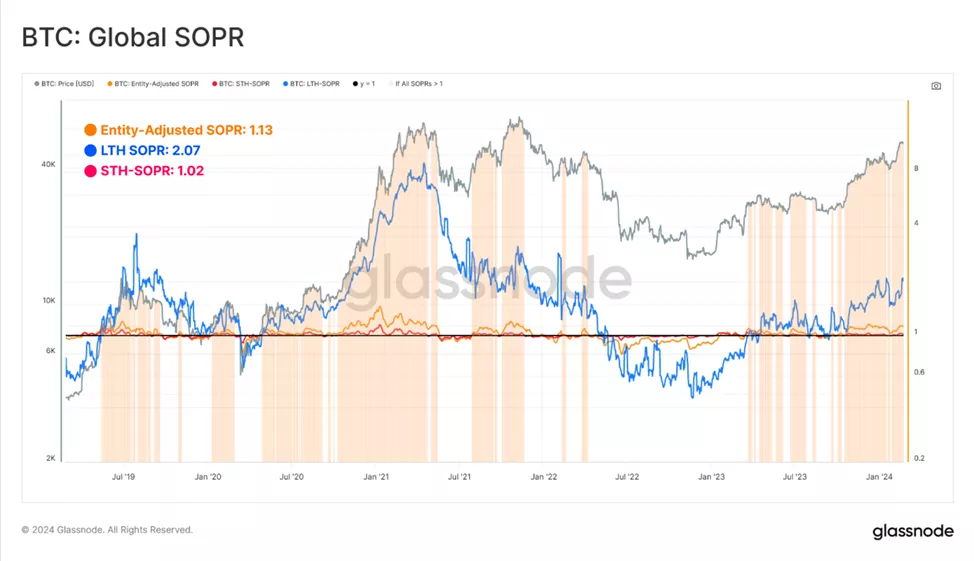
Analysts examined the SOPR indicator to assess the average realized profit or loss across market participant categories:
- ? average market SOPR: 1.13 (+13%);
- ? hodlers’ SOPR: 2.07 (+107%);
- ? speculators’ SOPR: 1.02 (+2%).
As with MVRV, the current situation corresponds to the peak euphoria phases of the bull markets in 2017 and 2021.
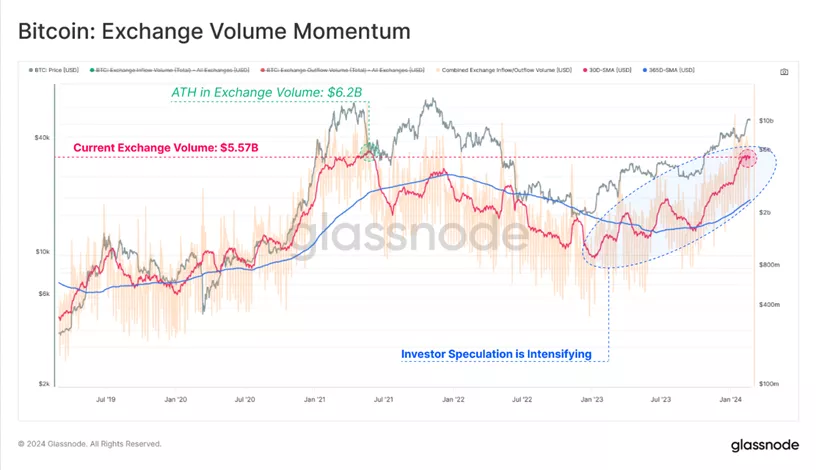
As a measure of trading activity and speculation, experts also examined the dynamics of flows on crypto exchanges.
The total volume of deposits and withdrawals reached a ‘staggering’ $5.57 billion. For comparison, the historical maximum is $6.2 billion.

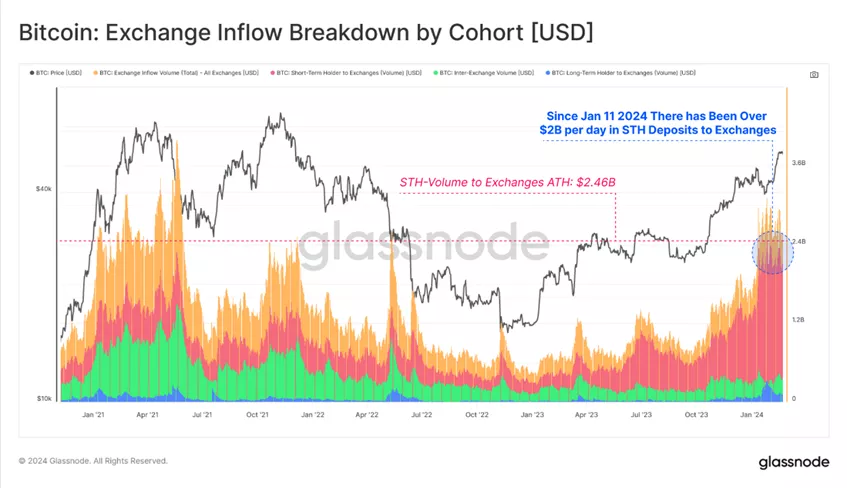
By segregating exchange deposits into separate categories, experts obtained the following values:
- ? short-term holders +$2.1 billion;
- ? long-term investors +$120 million;
- ? inter-platform operations +$354 million.
Since mid-January, the daily volume of coin inflows from short-term players in value terms has exceeded and remains stable at $2 billion. At one point, the indicator reached a new ATH ($2.46 billion). According to analysts, the figures underscore a high degree of speculative interest.

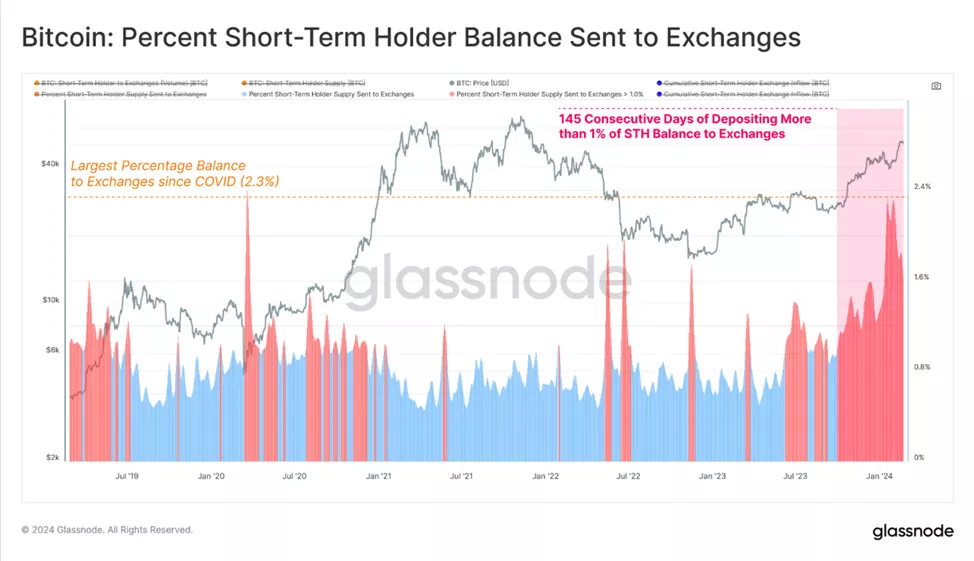
The dynamics of the relative share of coins sent by short-term traders to centralized platforms also support the conclusion of buyer frenzy. Over a single day since October 2023, the indicator rose from 1%+ to a maximum of 2.36%, the highest since the March 2020 sell-off.
According to specialists’ calculations, a record 78.3% of all network transactions are related to crypto exchanges.
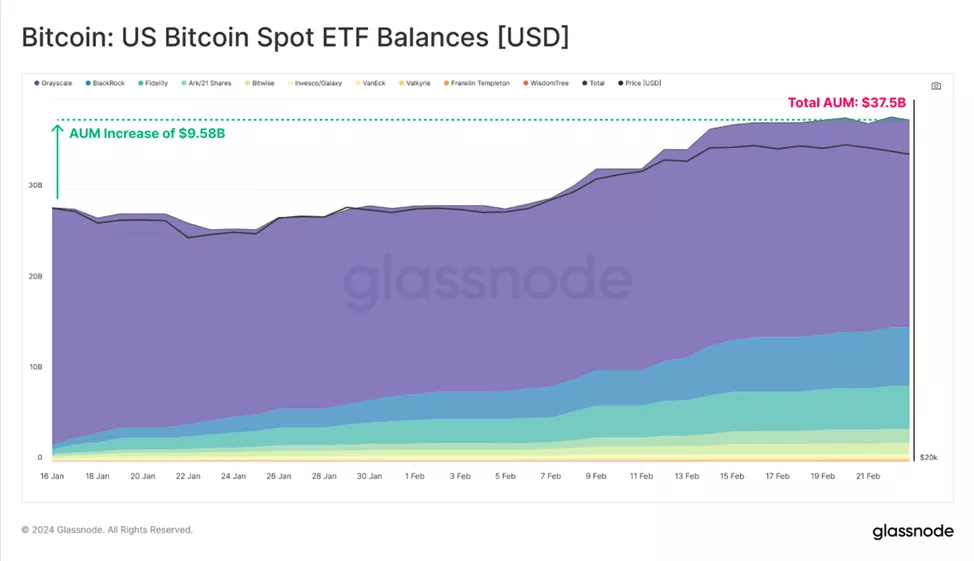
Spot Bitcoin ETFs led to an ‘incredible’ net inflow of 90,000 BTC. As a result, the AUM of product issuers increased by $5.7 billion, reaching $38 billion.
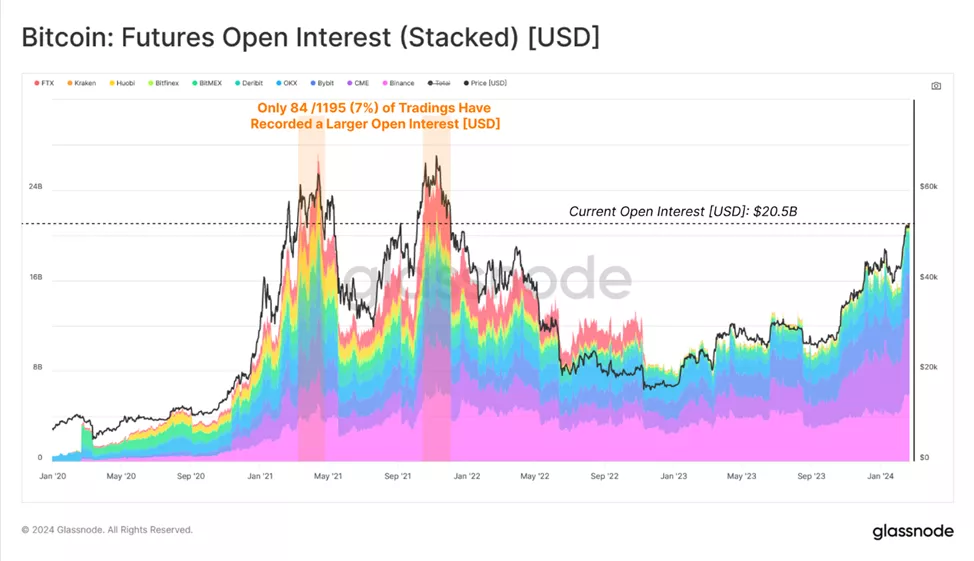
Signs of speculative sentiment also appeared in the crypto derivatives market. The total open interest (OI) in Bitcoin futures reached $21 billion. Only in 7% of trading days was the value higher. In dollar terms, OI approached the euphoria levels of 2021.
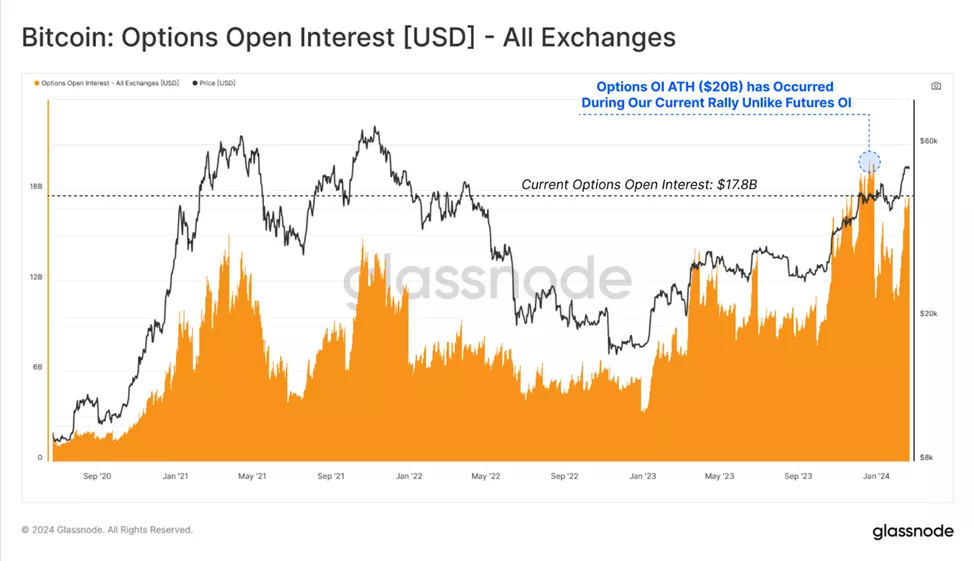
In the options market, OI jumped to $17.8 billion, nearly matching the futures market. At one point, the metric reached a new ATH of $20 billion.
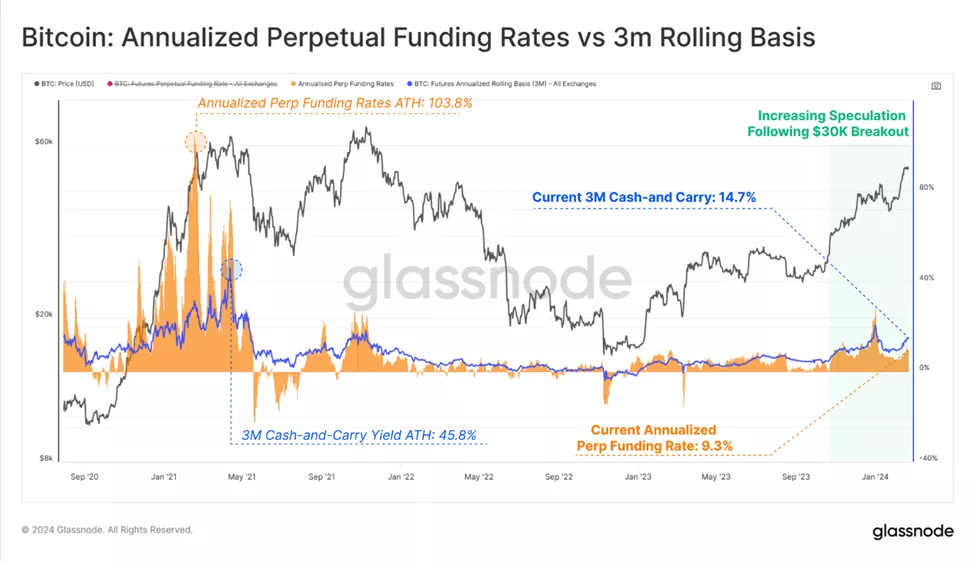
In the perpetual contracts market, the annual funding rate surged from 3% to 14.7%.
Analysts found several explanations for this:
- traders are willing to pay much higher interest rates to use leverage;
- those opening shorts on contracts can now earn a ‘risk-free’ rate two to three times higher than U.S. Treasury bills;
- such attractive yields may encourage market makers to return, increasing market liquidity.
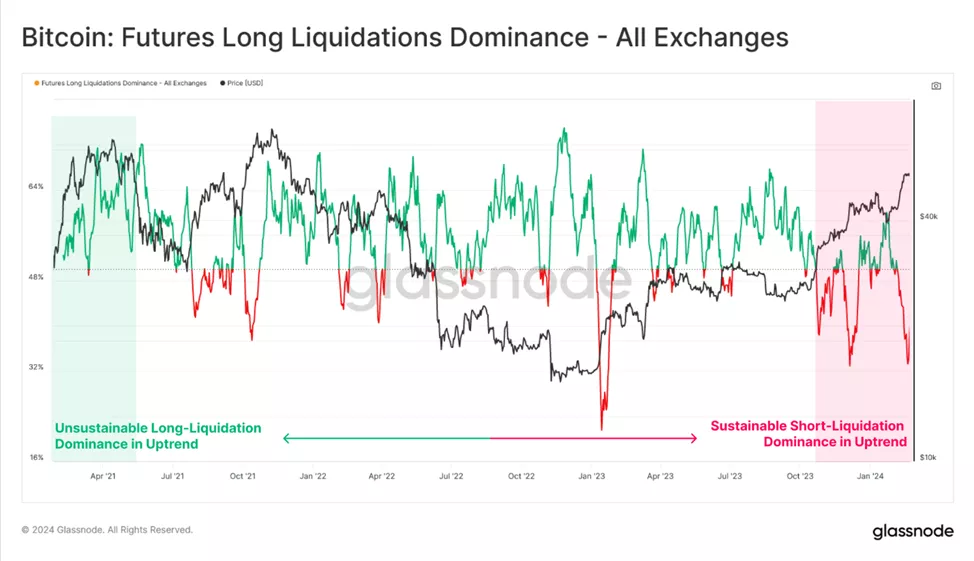
Experts also noted a significant increase in the liquidation of short position holders. Over the past 30 days, the figure exceeded $465 million.
Earlier, analysts at Matrixport suggested Bitcoin could rise to $63,000 in March, citing halving among the catalysts.
Previously, Fundstrat co-founder Tom Lee predicted digital gold could reach $150,000 by the end of 2024.