


Glassnode Highlights Bitcoin’s Volatility Risks
Following Bitcoin’s ATH, a divergence between demand and “active supply” has intensified, historically signalling a period of heightened volatility, according to Glassnode.
A notable divergence between supply and demand is emerging, with the #Bitcoin market being range-bound for over seven months.
With low volumes across on-chain and futures markets and a HODLer-dominated environment, the scene is set for heightened volatility in the near future.… pic.twitter.com/C83NCo6ugl
— glassnode (@glassnode) October 15, 2024
The scenario is exacerbated by the market’s sideways movement over seven months, low on-chain and derivatives market volumes, and a predominance of HODLing among investors.
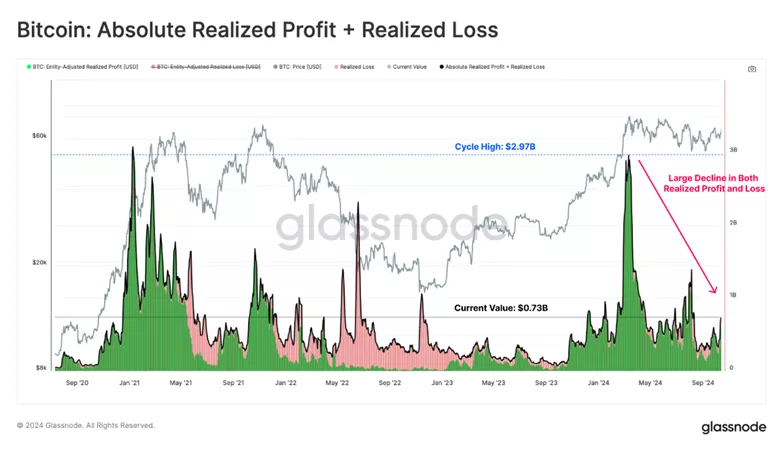
Using the realised profit/loss metric, analysts showed a reduction in daily capital inflow from $2.97 billion in March to $0.73 billion.
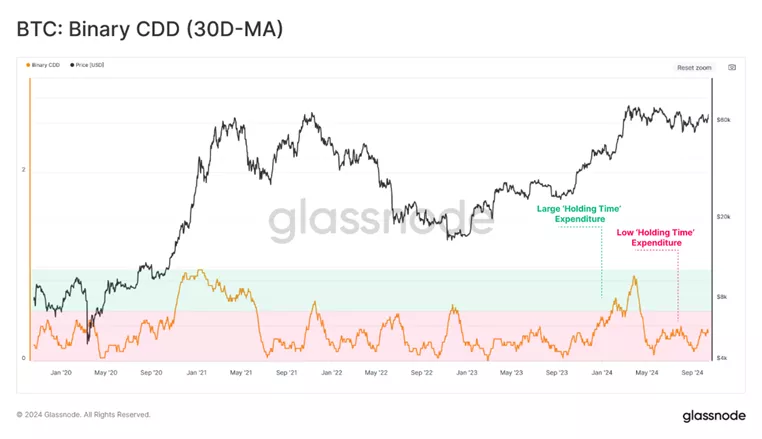
The conclusions are supported by the Binary CDD metric, which tracks “holding time” spent in the market when holders of older supply engage in large transactions (balanced by the emergence of “new buyers”).
Experts recorded a moderate “decay” of the indicator, indicating relatively low HODLer activity within the current price range.
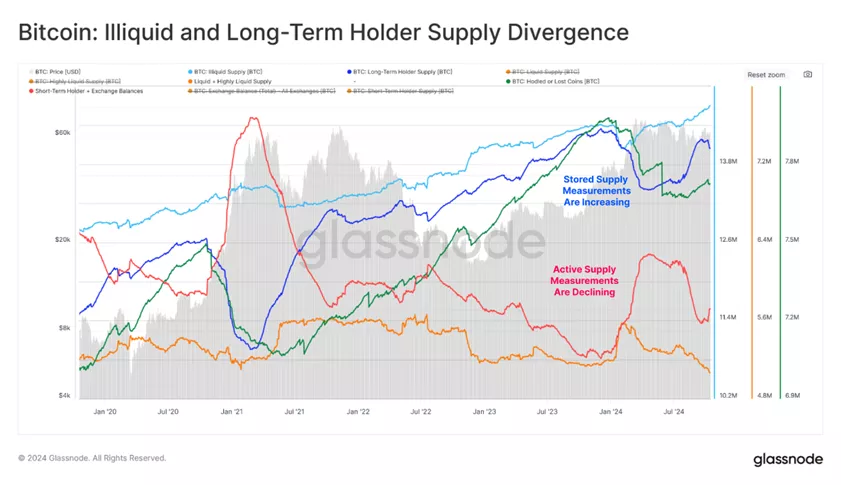
After analysing demand, specialists examined supply dynamics. The latter refers to the volume of coins that market participants are willing to spend and trade.
The chart below presents several “available supply” options, including short-term holder and exchange balances (highlighted in red), as well as highly liquid bitcoins (in orange).
Experts compared these metrics with “long-term held supply” indicators, which include coins in storage (in blue) and in HODLer wallets (in green).
The illustration shows the strengthening of the latter group at the expense of the former.
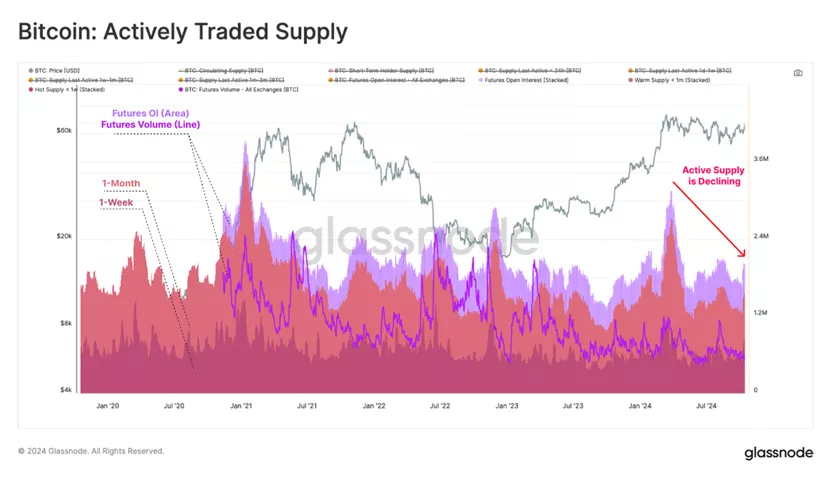
In the next stage, analysts considered the so-called “warm supply” — bitcoins moved within the last month for potential sale (highlighted in maroon). This category also includes coins forming trading volume (in red) and open interest (in purple) in futures.
Experts noted that these indicators have effectively halved since reaching ATH. In other words, there is a clear reduction in speculation and market participant engagement.
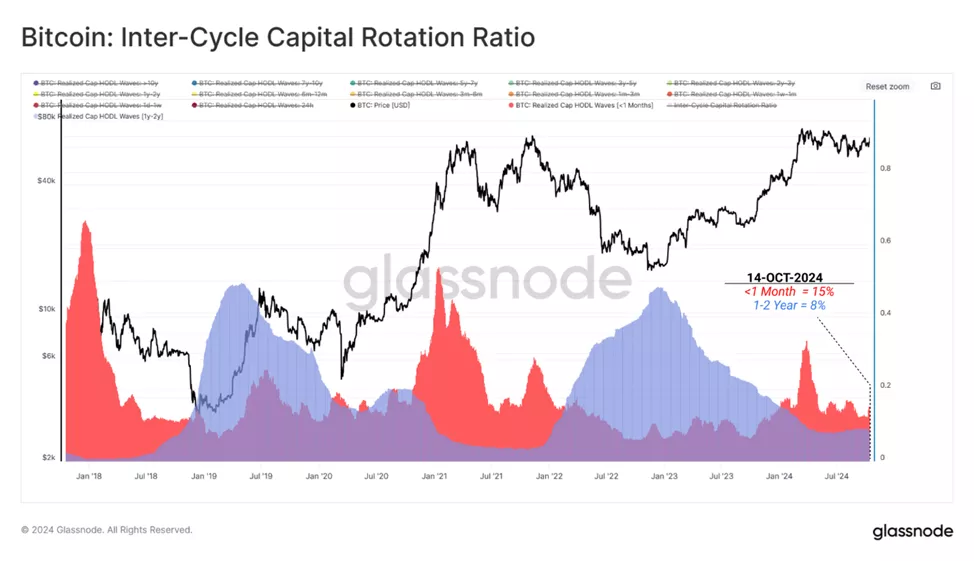
Glassnode then analysed the “wealth” share of two holder groups:
- Short-term indicator [<1 month] — largely corresponds to demand from "new investors" bringing in "fresh" capital.
- Long-term indicator [1-2 years] — part of the supply from long-term and price-sensitive participants who accumulated capital during the bear market and held it throughout. The indicator peaks during the cycle’s bottoming phase.
Specialists noted a high but declining presence of new demand. This significantly exceeds levels during the 2022 bear market but falls short of March figures.
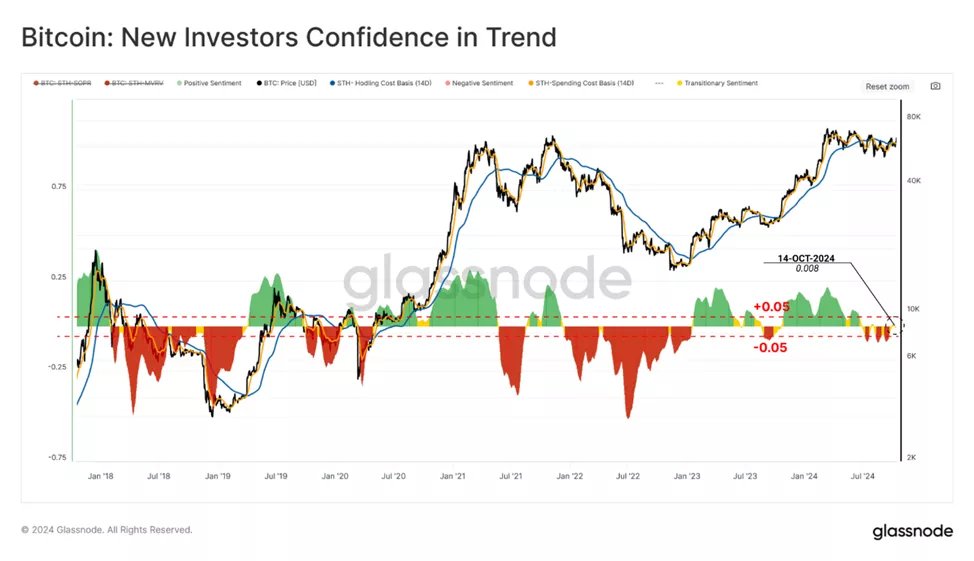
The confidence of “new investors” in the market’s direction remains within a neutral range — expenses do not differ significantly from the initial purchase price. Despite recent turbulence, the metric is noticeably higher than in 2019–2021, specialists explained.
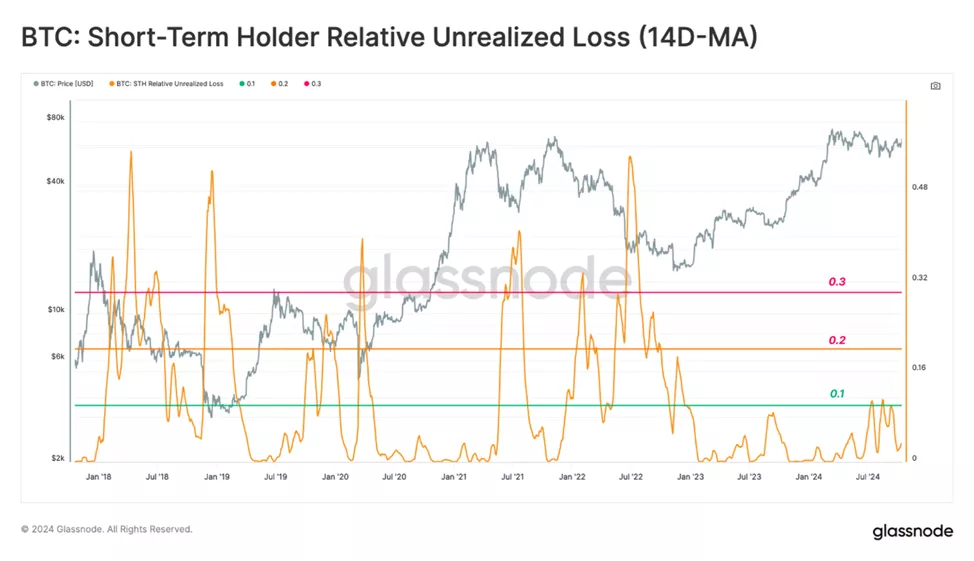
The absence of unrealised losses among “new investors” reinforces this resilience and indicates a lack of sharp declines in their profitability. In other words, this category experiences limited financial pressure and fear, reducing the likelihood of a deep bear market.
Previously, Glassnode warned of digital assets’ susceptibility to heightened volatility due to liquidation risks and an ambiguous macroeconomic outlook.
Earlier, JPMorgan identified drivers for cryptocurrency growth by the year’s end.
Рассылки ForkLog: держите руку на пульсе биткоин-индустрии!