


Two key metrics point to a potential trend reversal in the leading cryptocurrency, noted CryptoQuant analyst Ignacio Moreno de Vicente.
Bitcoin’s Stress Cycle Is Ending — But Not Yet Reversing
“Risk remains present… But for investors with a cycle-aware framework, the data suggests we are closer to the beginning of an opportunity than the end of one.” – By @MorenoDV_ pic.twitter.com/3Ajya7zPJp
— CryptoQuant.com (@cryptoquant_com) April 9, 2026
Sharpe ratio fell deep into negative territory, reaching -40. Historically, that threshold has coincided with the formation of long-term lows. In 2015, 2019, 2020 and 2023, breaks below that level were each followed by subsequent price gains.
An indicator of buy and sell pressure adds important context, the expert noted. Durable cycle lows have typically formed in several stages rather than all at once.
First comes a flush into the zone of maximum selling pressure (orange/red spikes below -0.05 on the second chart above). At this stage, forced sellers and panic-driven participants capitulate.
Then, as market supply contracts, conditions gradually normalise.
When the indicator returned to the blue “buying pressure” band (a signal of genuine demand resumption rather than mere stabilisation), the risk-reward became most attractive.
“Right now the chart shows that the orange washout (capitulation) has already occurred. We are moving into the next phase. The delta is slowly returning but has not yet reached the blue levels. It is precisely this gap — between confirmed capitulation and the revival of demand — that has historically been the point for the most asymmetric capital deployment,” explained Moreno de Vicente.
He cautioned, however, that macro risks, liquidity and fragile investor sentiment could prolong the process.
Conditions for a trend shift
According to Glassnode analysts, bitcoin is currently in a typical bear-phase regime.
Bouncing in a Bear#Bitcoin bounced from $67k to $72k, but weak spot demand and softer futures activity suggest the recovery still lacks strong conviction, even as ETF flows begin to turn modestly positive.
Read the full Week On-Chain👇https://t.co/ADIT9yu3C4 pic.twitter.com/S1T79HQ59z
— glassnode (@glassnode) April 8, 2026
A relief rally amid a temporary truce between the US and Iran could lift the cryptocurrency’s price to $78,000 — the true market mean. However, there is still no meaningful shift in momentum.
Two conditions are needed for a durable recovery:
- stabilisation of the short-term holders’ cost basis (it is still falling);
- a sharp reduction in losses for those who bought near the cycle peaks.
The seven-day moving average of realised losses for long-term investors tracks this dynamic. Since November 2025, the metric has exceeded 4,000 BTC per day — a signal of capitulation among buyers who entered at the highs.
The most reliable signal of a phase shift would be a sustained decline in this gauge to below 1,000 BTC per day, alongside a price recovery above the short-term holders’ cost basis ($81,600).
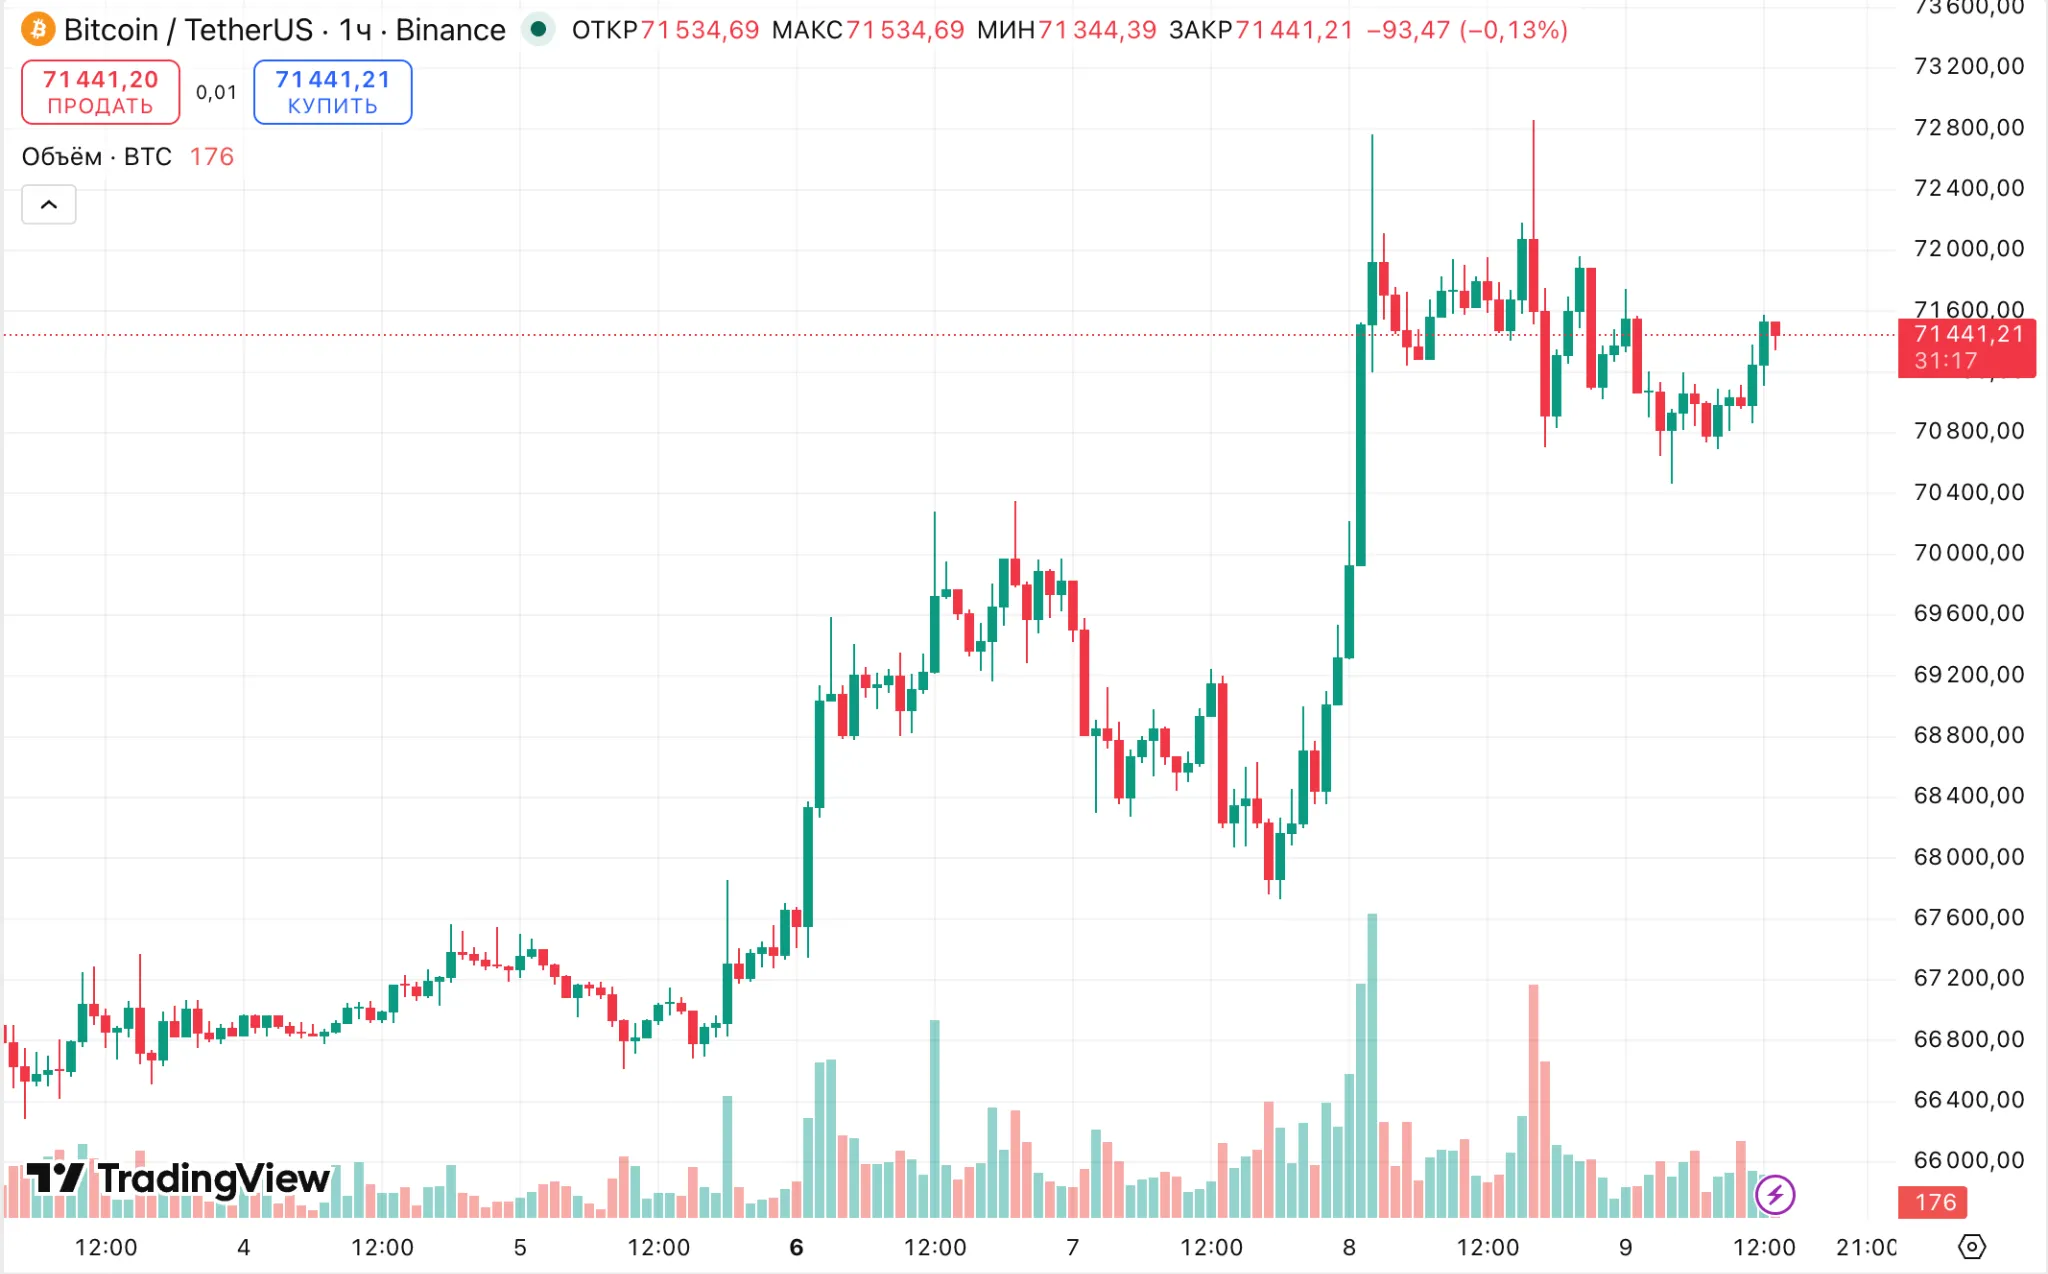
At the time of writing, bitcoin trades around $71,400. The price is down 0.3% on the day but up 7.5% on the week.


Saylor is confident the cycle bottom is in
At the same time, Strategy founder Michael Saylor believes bitcoin has already bottomed near $60,000, writes The Block. He pointed to a familiar pattern: downtrends end not amid improving sentiment, but when forced selling is exhausted.
The latest decline, he said, was driven mainly by overleveraged miners and weaker participants who liquidated positions.
As their supply dries up, the market’s balance of power shifts. Saylor listed factors that limit further downside:
- more stable demand for ETFs;
- improving liquidity expectations;
- a rise in corporate allocations to treasury assets.
By his reckoning, conditions look asymmetric: as weak-hand supply is exhausted, demand for bitcoin continues to grow.
Saylor also commented on the potential threat from quantum computers. He said these risks are distant in time and manageable. Any real threat would form gradually, giving the network enough time to adapt.
Bitcoin’s open architecture will allow developers to implement quantum-resistant upgrades well before such attacks become practical, the expert stressed.
On April 8, Lightning Labs CTO Olaoluwa Osuntokun unveiled a prototype tool to protect wallets from potential quantum attacks.