


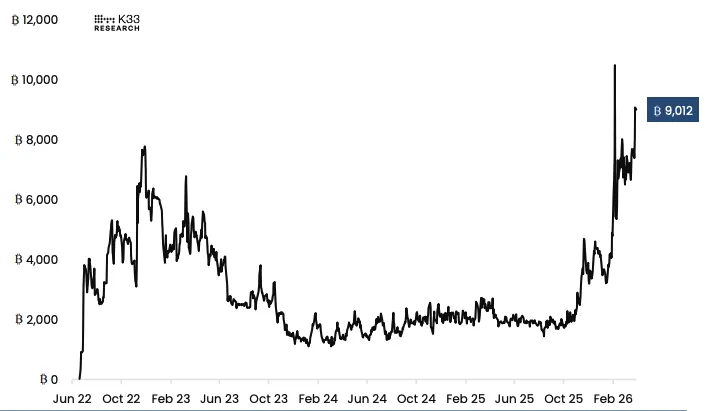
In recent days, the volume of short positions on the leading cryptocurrency via ETF has surged by 22% to 9012 BTC. Such levels have been recorded only twice in history, analysts at K33 noted.


The head of research at the firm, Vetle Lunde, pointed out that the current situation aligns with typical bottom formation stages, where the market is saturated with bearish positions. This is also hinted at by the persistence of negative funding rates.

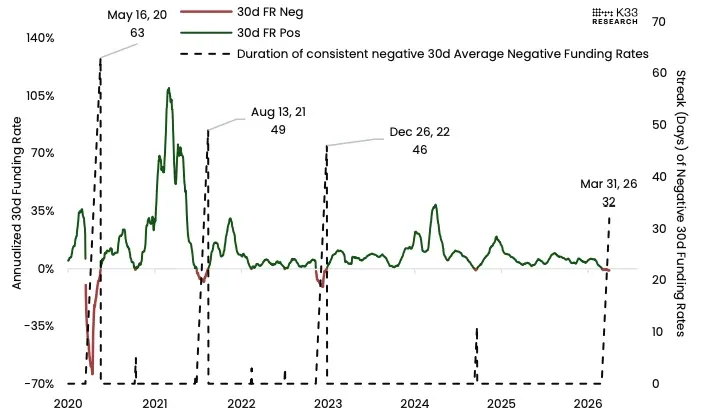
“The average annual 30-day funding rates have remained negative for 32 consecutive days. In two weeks, this period could surpass the duration of negative rates observed from November to December 2022,” he noted.
Other on-chain data also suggest an approach to a cyclical low. According to CryptoQuant, the gap between Bitcoin’s spot and realized price has narrowed from 120% at the end of 2024 to the current 21%. To reach the accumulation zone, where the bottom historically forms, the asset needs to drop by another 20%.
Low Liquidity Ahead of Holidays
K33 stated that Bitcoin traders are exhibiting “aggressive caution.” The pressure is created by weak price dynamics, uncertainty surrounding the conflict in Iran, new warnings about quantum threats, and the approach of Easter—a time of low liquidity.
A series of holidays in many countries leads to reduced trading volumes and volatility, as traditional markets are closed. This also affects cryptocurrencies, Lunde emphasized.
According to him, since 2019, Bitcoin’s seven-day trading volumes during Easter weeks have consistently been below the annual average. A similar trend is observed with volatility—during these periods, it also systematically lags behind the annual average values.

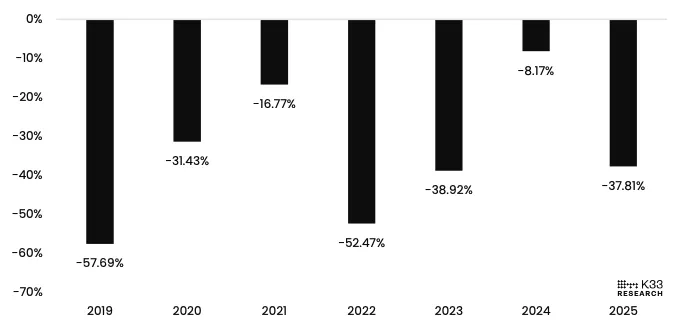
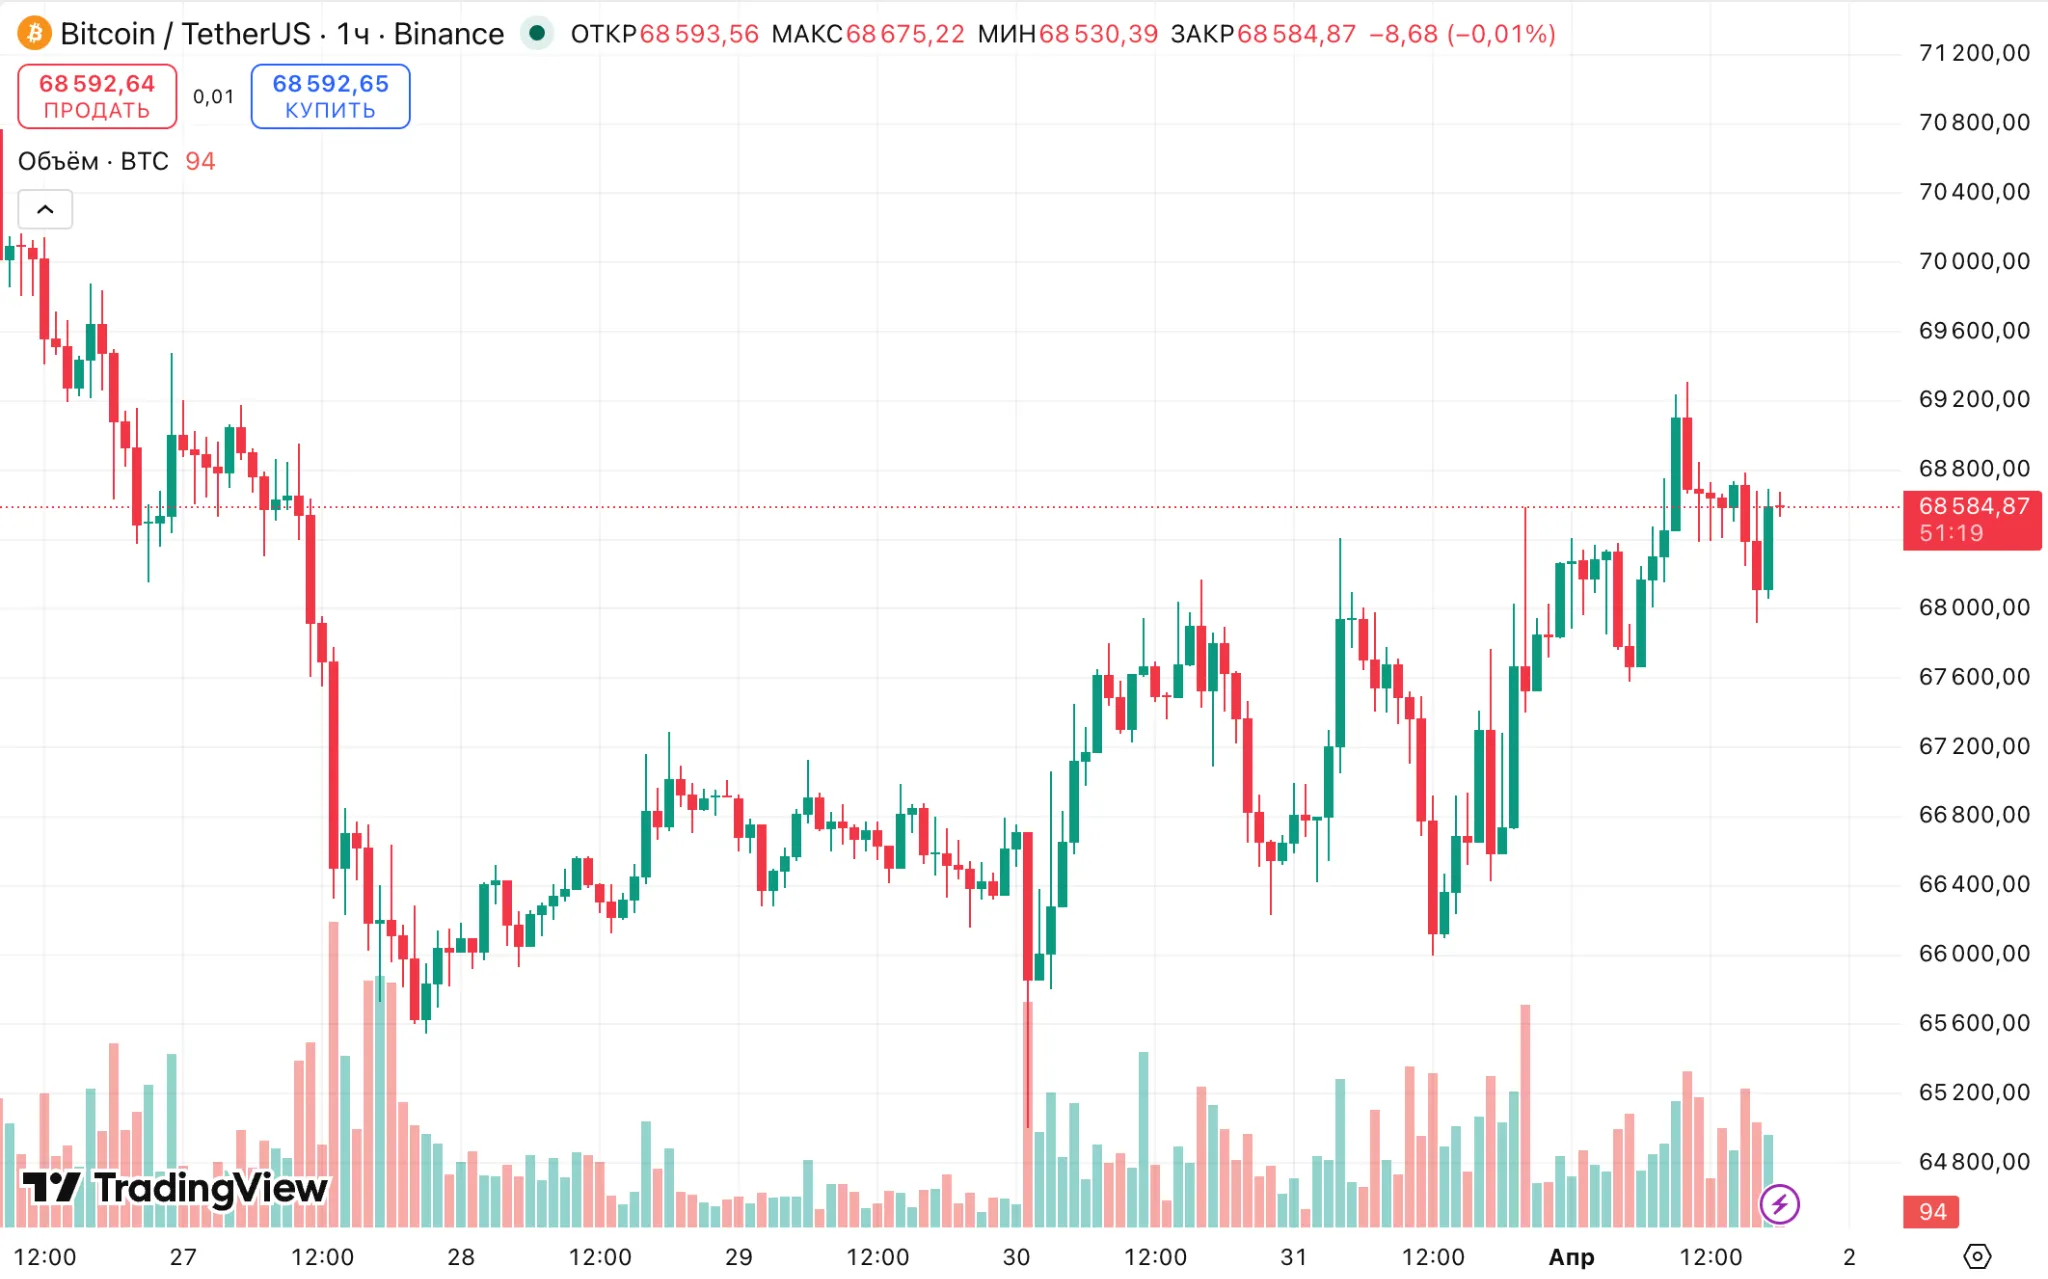
At the time of writing, digital gold is trading around $68,600. The recently concluded first quarter of 2026 was the worst for the asset in the past eight years.

Analysts at Fidelity described Bitcoin’s 52% drop from its all-time high as a sign of market maturation.
