


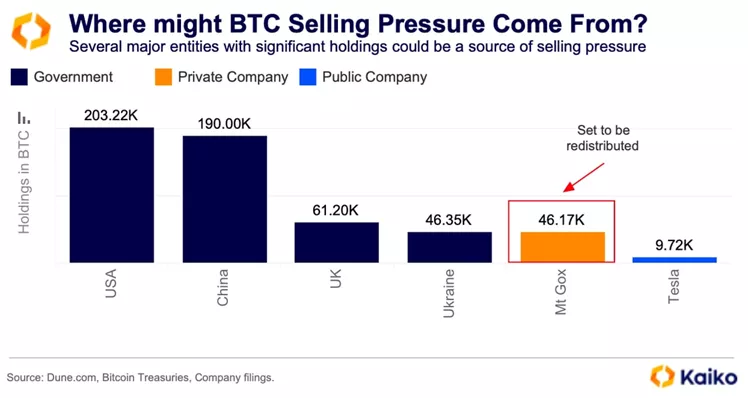
The additional selling pressure from the distribution of the remaining 47,170 BTC ($2.7 billion) held by the Mt.Gox trustee is unlikely to cause liquidity issues for digital assets, according to Kaiko.
Analysts noted that waves of liquidations and the sale of coins by clients of bankrupt cryptocurrency companies have accompanied investors at various stages from May to August.
One of the main sources of concern has been the Mt.Gox payouts. During the first wave of distribution amounting to 100,000 BTC, the market faced significant sell-offs.
In addition to Mt.Gox with 47,170 BTC, potential pressure on prices could come from the authorities in the US (203,220 BTC), China (190,000 BTC), the UK (61,200 BTC), and Ukraine (46,350 BTC).


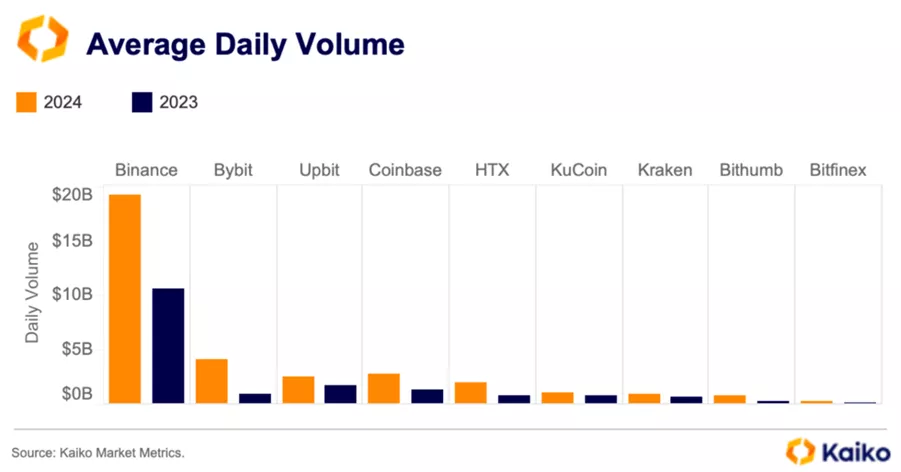
According to specialists, the launch of crypto ETFs has contributed to a 30% increase in trading volume on the ten largest platforms since 2023. They explained that considering only this metric does not allow for a correct assessment of the overall picture, as the indicator can be influenced by fees and various marketing campaigns.

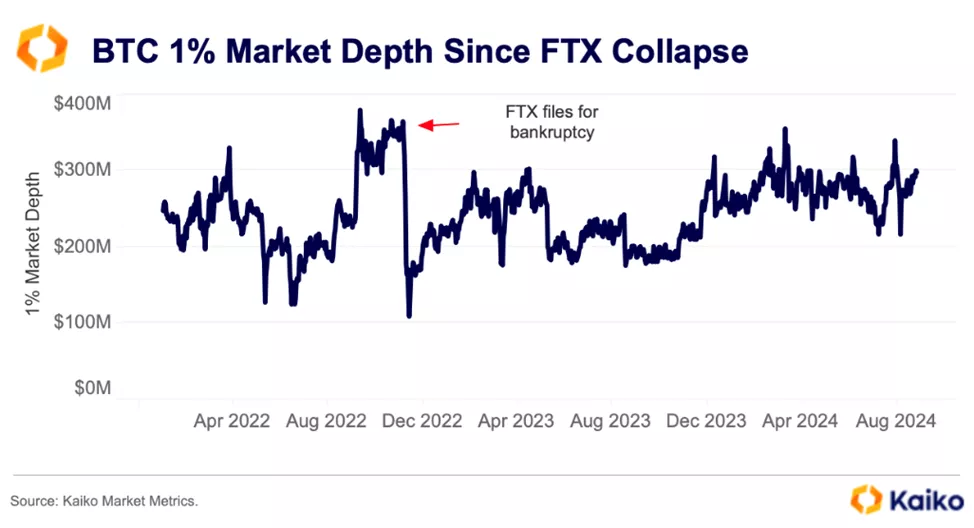
Experts suggested considering trading volume in conjunction with market depth. The graph below shows the latter indicator (1%) in relation to Bitcoin before and after the FTX collapse.

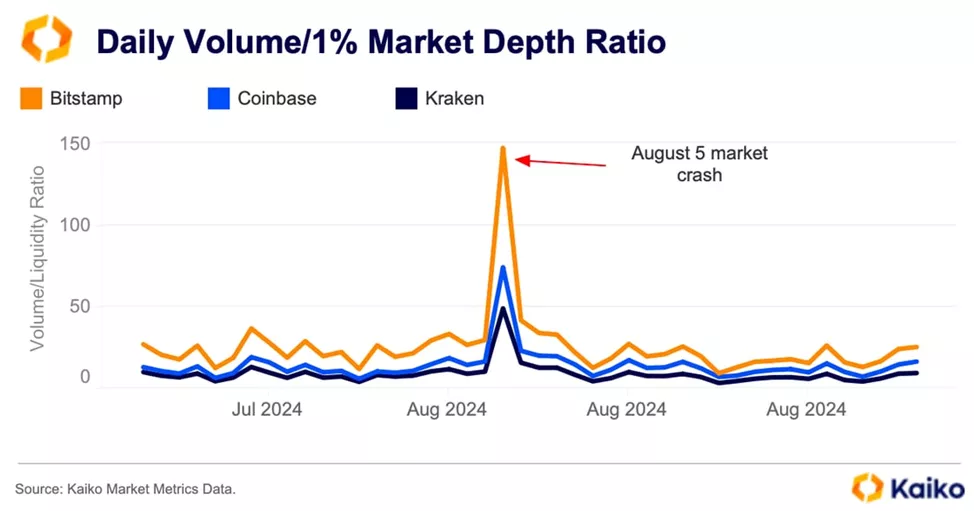
Another indicator to consider when assessing asset stability is the ratio of daily trading volume to average market depth (1%). This metric is often used to analyze inflated turnovers and as a marker of a platform’s ability to handle volatility.
During the August crash, it reached a peak on all exchanges, but relatively more on those with the highest values. This indicates that these platforms experienced stronger market pressure, and their order books suffered more than others.
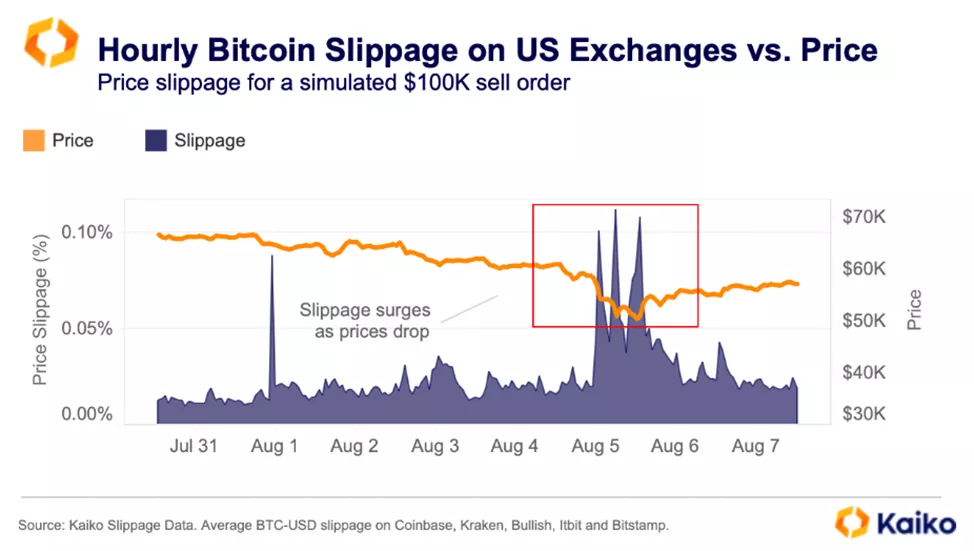
Observations align with data obtained using other liquidity indicators such as slippage.

On August 2, Bitcoin’s drop below $50,000 made it difficult to execute orders at desired prices, causing volatility spikes. On August 5, the slippage indicator for BTC-USD on major US exchanges tripled within a few hours.
Notably, on average, it remained elevated even after the sell-off, indicating persistent uncertainty, experts noted.

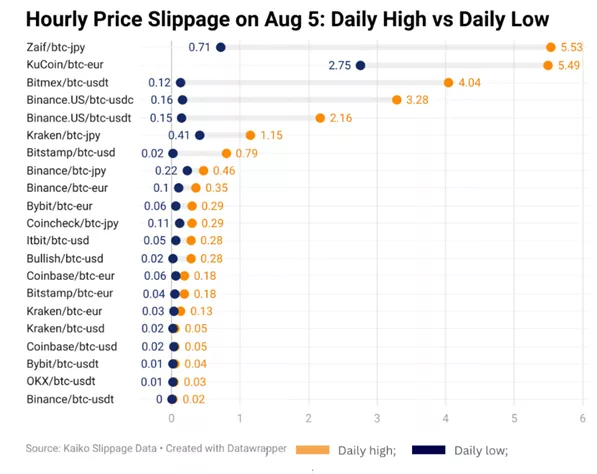
The graph below shows the slippage spread for various platforms.

In August, Kaiko analysts discovered an increase in liquidity concentration during stock exchange trading periods, creating conditions for sharp price fluctuations over weekends during market stress periods.
Previously, potential pressure from Mt.Gox clients was assessed by Glassnode.