


The leading cryptocurrency has facilitated a “healthy reset” of bullish sentiment as the Mayer Multiple indicator reached an eight-month low, according to analyst On-Chain Collage.
The Bitcoin Mayer Multiple is now at a level not seen since October 2023, despite price at $60.9K now vs. $29.9K back in October.
A healthy reset of sentiment to shift back bearish while being at twice the price.
Rinse. Repeat.
This is how Bitcoin works.
Few. pic.twitter.com/ePh0MnmR5H
— On-Chain College (@OnChainCollege) June 26, 2024
“[The metric] is at a level not seen since October 2023, despite the [Bitcoin] price now being $60,900 compared to $29,900 at that time,” the expert noted.
The analyst believes the Mayer Multiple may indicate an imminent recovery for digital gold.
The indicator measures Bitcoin’s current price relative to its 200-day moving average, with the resulting ratio used as a buy or sell signal. The metric’s creator, Trace Mayer, considered values below 2.4 as an accumulation zone for the asset.
According to Glassnode, the Mayer Multiple currently stands at 1.05.


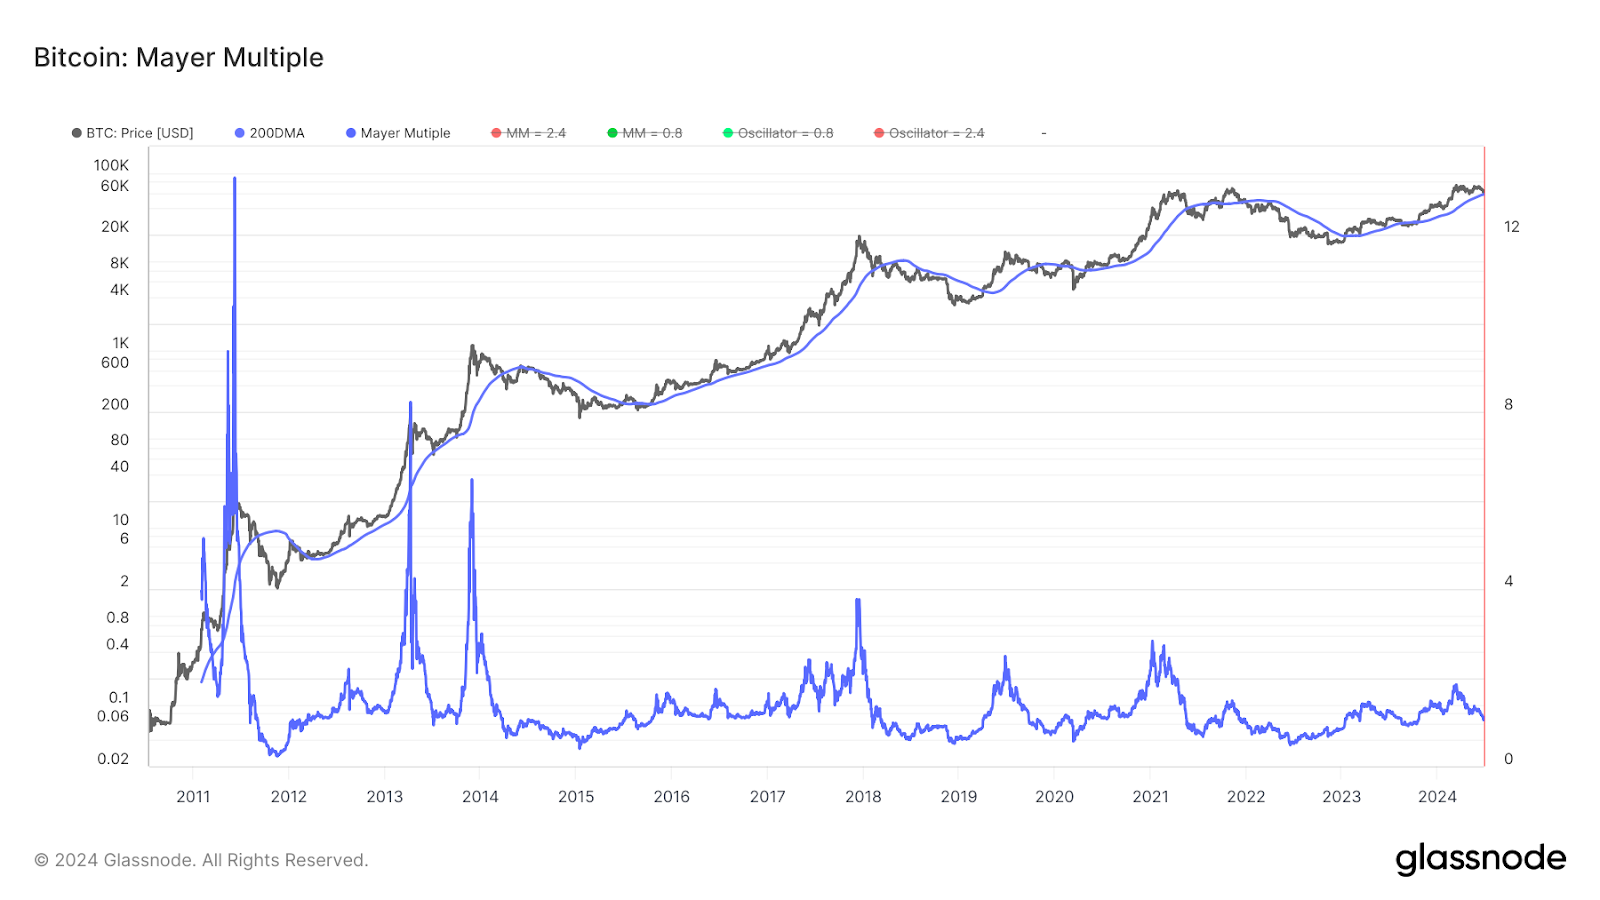
Based on current indicators, upon reaching 2.4, the leading cryptocurrency is expected to trade at around $140,000. The last time this indicator value was observed was in March 2021, when the price was approximately $48,000.
However, Mayer Multiple lows do not always coincide with Bitcoin’s price floors. In mid-2022, the indicator dropped to 0.47, but the asset’s price reached a local minimum only four months later.
What Do Other Indicators Suggest?
Simultaneously, the Relative Strength Index (RSI) has entered the oversold zone across several timeframes. The last time the daily figure was at its current level was in August 2023.

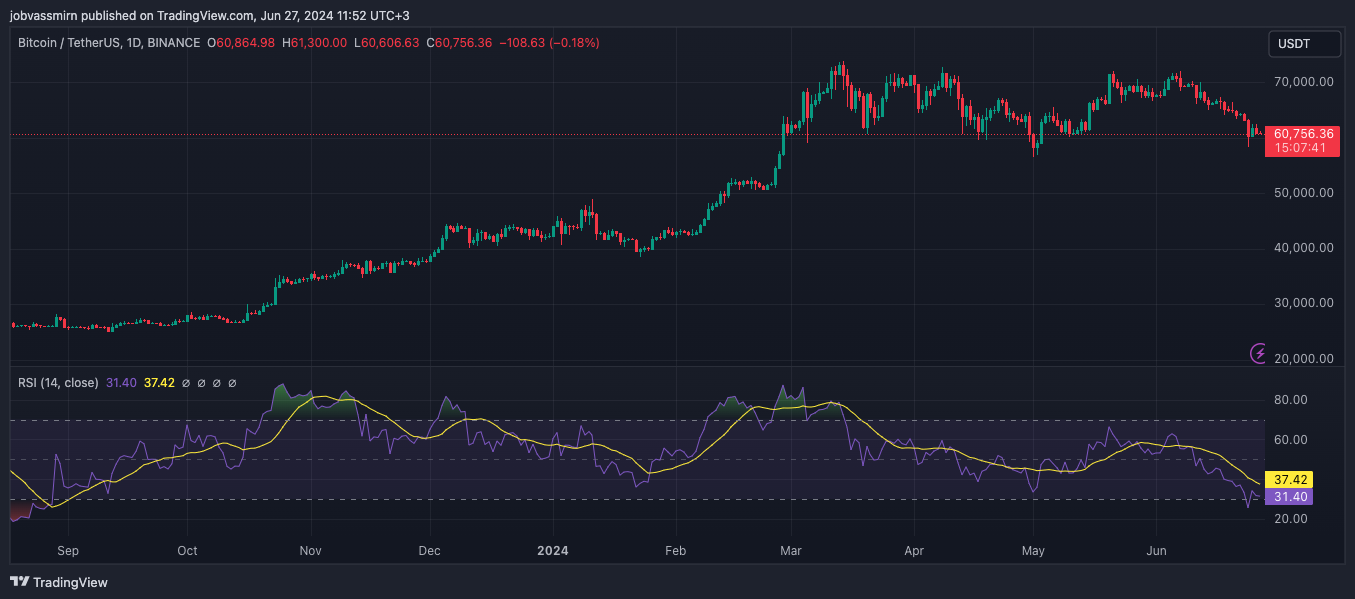
Trader Jelle noted that the last time RSI was at such levels, Bitcoin consolidated below the key resistance level of $30,000 for over three months.
#Bitcoin‘s daily RSI is the most oversold it has been in over 300 days ?
The last time the RSI was this low, Bitcoin had just consolidated for 3+ months, just below the key resistance @ 30k.
We’re looking at 3+ months of consolidation below 70k now.
History repeating? pic.twitter.com/JYhjFBeqyh
— Jelle (@CryptoJelleNL) June 27, 2024
“Now, three months of consolidation below $70,000 are expected. History repeating?” he noted.
Technical analyst Ali emphasized that the RSI signals an ideal time to buy the dip and advised closely monitoring the daily timeframe.
Imagine having one indicator that signals the perfect time to buy the #Bitcoin dip… Keep it simple, folks, and study the daily $BTC RSI! pic.twitter.com/y1JEErdLgs
— Ali (@ali_charts) June 25, 2024
Philip Swift, founder of LookIntoBitcoin, highlighted the “Golden Ratio Multiplier” indicator. According to him, this metric is “the most accurate for identifying every major price high in Bitcoin’s history.”
Arguably, Golden Ratio Multiplier has been the most accurate metric for picking every major price high (not just final cycle high) in Bitcoin’s history.
Nailed the recent #Bitcoin ETF euphoria high too. pic.twitter.com/XEbknSYaZV
— Philip Swift (@PositiveCrypto) June 27, 2024
The indicator is currently at a peak observed during the “ETF euphoria” from February to March.
Previously, CryptoQuant analysts pointed to signs of a potential local bottom for Bitcoin. They noted that after a 15% correction and subsequent rebound from $60,000, signs emerged of the leading cryptocurrency reaching its lows.
Several experts have observed bullish sentiment in the crypto derivatives market. On June 28, when weekly, monthly, and quarterly Bitcoin options positions expire, the put/call ratio stands at 0.51, indicating trader optimism.