

An Investor’s Guide to Popular Indicators for Assessing DeFi Projects
The decentralised finance (DeFi) segment continues to develop at a rapid pace. New projects appear daily, and those with an established track record expand functionality, while adding support for new protocols and scaling solutions.
Not only for beginners, but also for seasoned investors, keeping pace with the market’s rapid changes can be challenging, not to mention timely assessments of new projects.
A substantial array of indicators and platforms for fundamental analysis of DeFi protocols has been developed. Because a large volume of data is publicly available, any investor can readily use these tools.
We propose to consider the most popular indicators designed to help in comparing different projects and in assessing the intrinsic value of assets in decentralized applications.
- There are many indicators designed to assist the DeFi investor in evaluating projects. Many are straightforward and publicly accessible.
- Using indicators in isolation does not provide a complete picture of the market — a holistic approach to analysis and consideration of overall market conditions is required.
Total Value Locked (TVL)
It is one of the most watched indicators, drawing the attention of many market participants. TVL represents the aggregate value of assets locked in a DeFi protocol’s smart contracts.
For example, in the case of the Ethereum-based exchange Uniswap, this is the total value of funds in its liquidity pools contributed by providers.
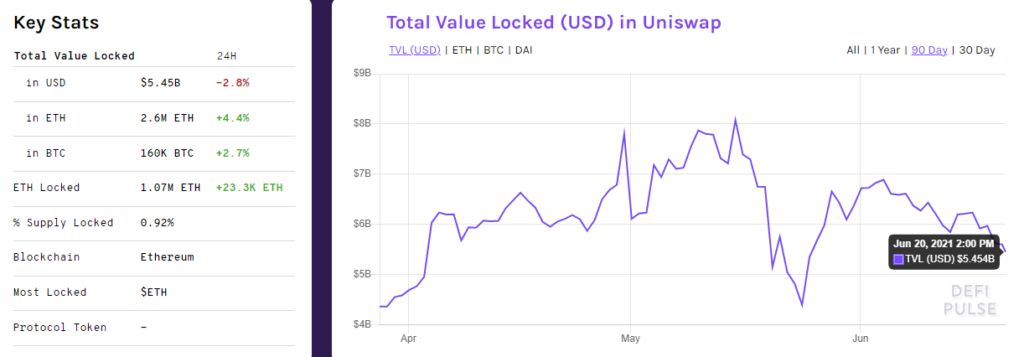
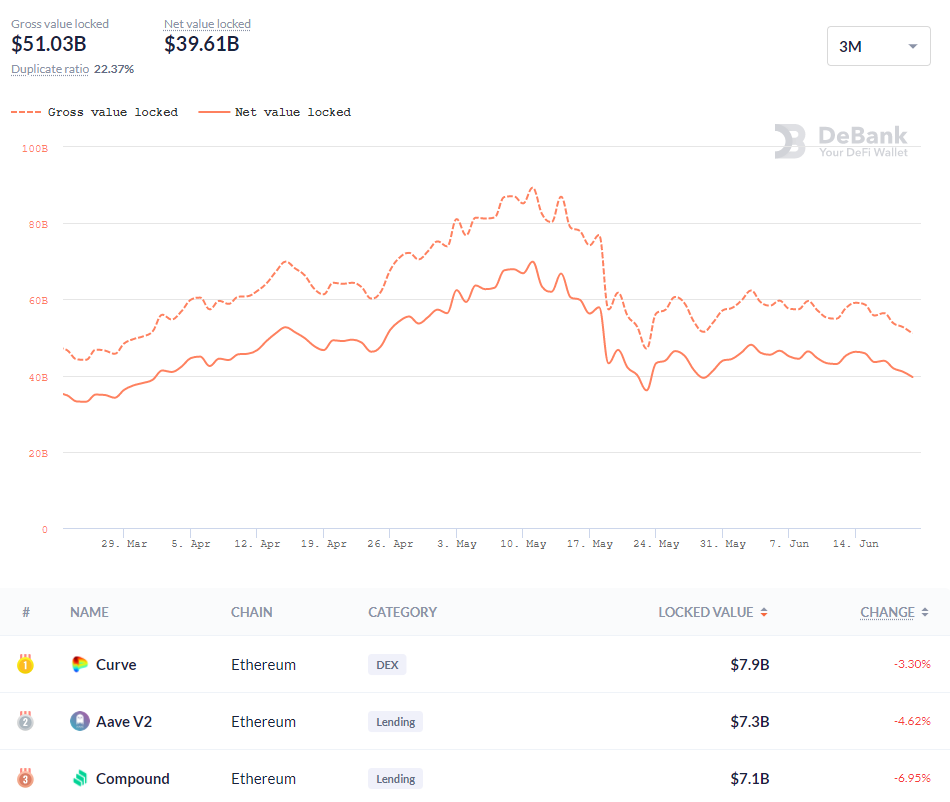
The TVL metric can be analysed for individual projects or for entire ecosystems. Platforms such as DeFi Pulse, Token Terminal (Ethereum), Defistation (Binance Smart Chain, BSC), DeFiBox (Huobi ECO Chain) DeBank and others are suitable for this purpose.
Below is the dynamics of the indicator for the entire Ethereum ecosystem:
TVL can be useful for gaining a sense of overall market interest in DeFi and sector growth. It can also be used to assess the market shares of protocols and to identify undervalued projects.
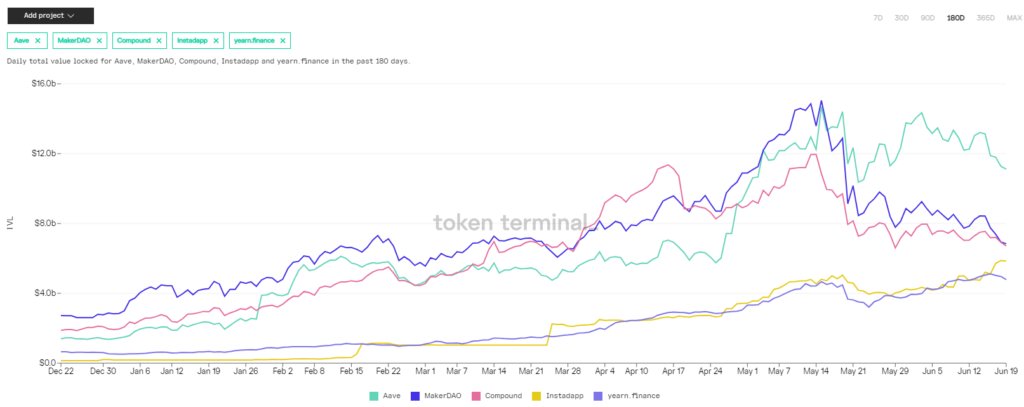
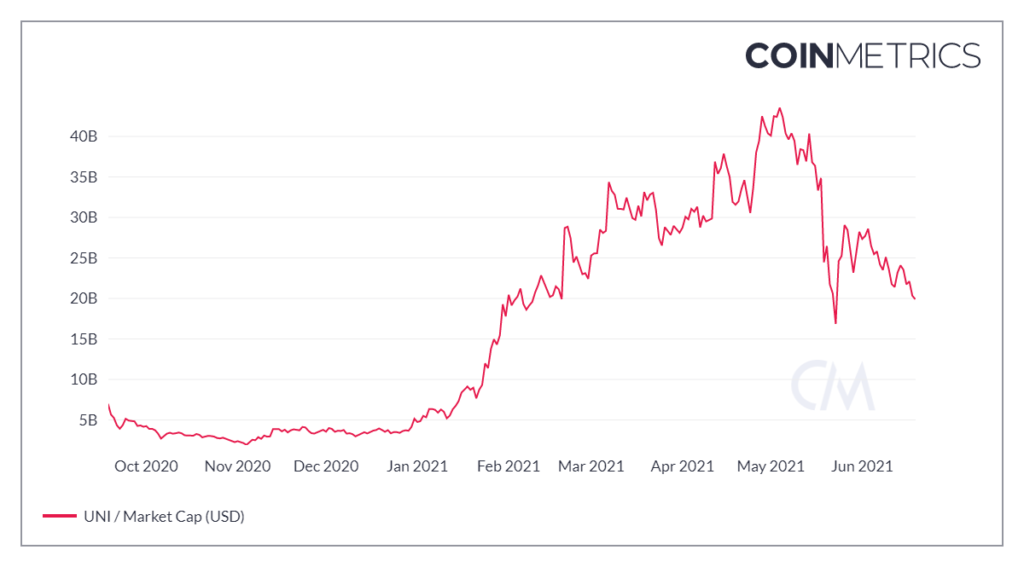
The Token Terminal service allows comparing the TVL trajectories of different platforms.
Investor Spencer Noon of Variant Fund proposed using the ratio of TVL to the fully diluted market capitalization of a project (Fully-Diluted Market Cap or Fully Diluted Valuation). The latter denotes the total market value of all native tokens (already issued and not yet issued).
1. Total Value Locked / Fully-Diluted Marketcap
Here’s why: Protocols with more value locked should be able to capture more value.
Rule of thumb: ⬆️ number = ?? better
DIY: @defipulse @coingecko
— Spencer Noon ? (@spencernoon) August 16, 2020
The higher the ratio, the better. This is a sign of a substantial amount of funds in the project’s ecosystem.
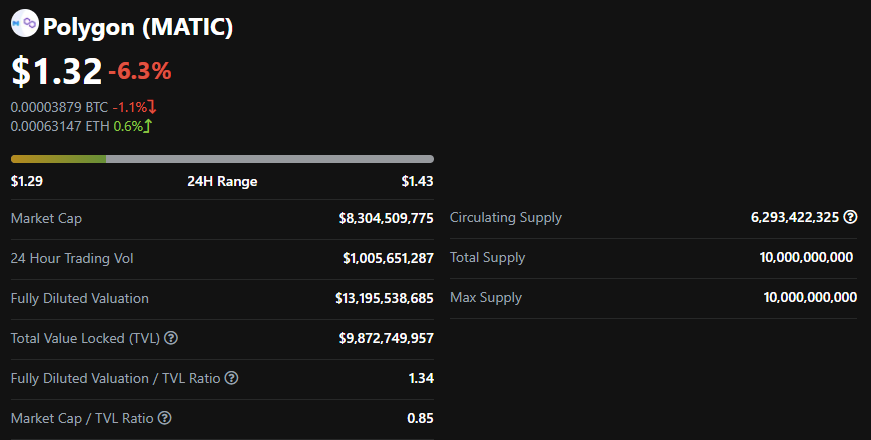
Fully-Diluted Market Cap and TVL metrics for various services can be viewed on CoinGecko. The site also presents the Fully Diluted Valuation / TVL Ratio — the inverse of the ratio proposed by Spencer Noon.
Market Capitalisation
Analysts may also find the market capitalization (Market Cap) metric useful. It is the total number of tokens issued into the market multiplied by the asset’s current price.
It is one of the most popular metrics, featured across numerous analytical services, including CoinMarketCap, CoinGecko and Coin Metrics.
Projects can be compared either by capitalization or by the Market Cap / TVL ratio. All else equal, a lower ratio is preferable. This indicates the service is actively used and sizeable.
“A value of the ratio above 1 means that market capitalization exceeds the total value locked,” as stated by CoinGecko.
To illustrate the difference between TVL and market capitalization, consider Maker, one of DeFi’s pioneers.
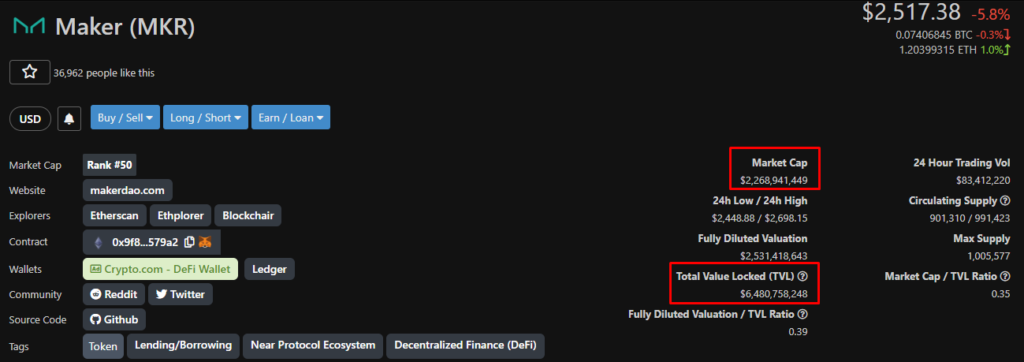
In this case, TVL is the dollar-denominated total value of assets locked as collateral in the Maker system. In other words, if all CDP are valued at $6.4 billion, the platform’s TVL would also be $6.4 billion. Maker’s market capitalization is the product of the total circulating supply MKR by the current price of the native asset.
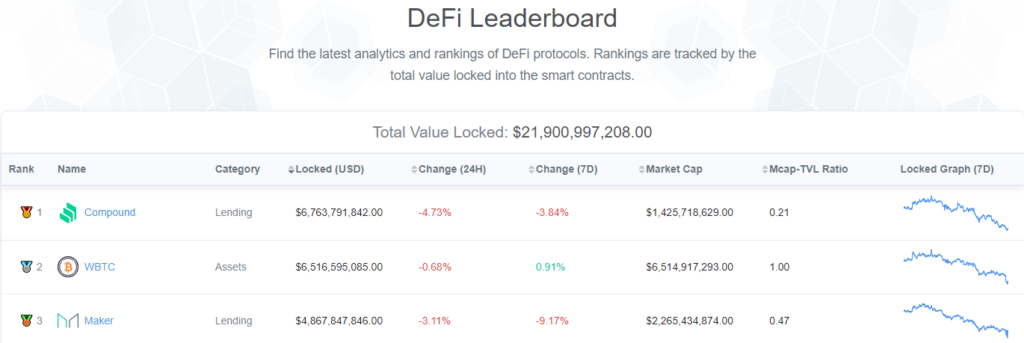
You can compare Market Cap / TVL ratios across projects in the DeFi Leaderboard section of Etherscan.
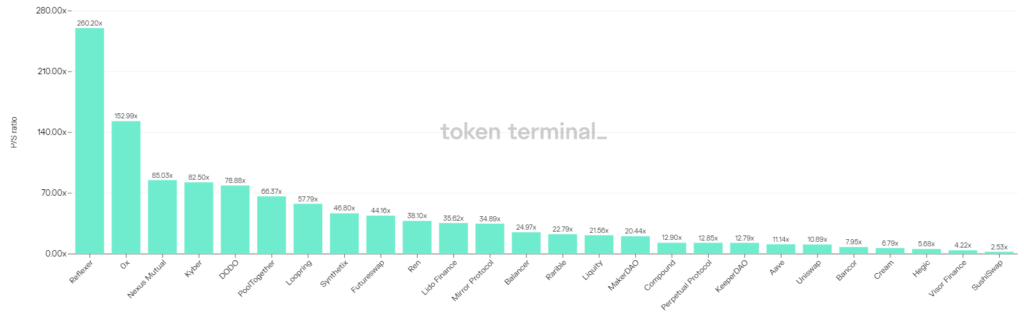
Price-to-Sales (P/S) Ratio
Many indicators in the crypto industry have inherited from traditional financial markets. In addition to the widely known market capitalization, one such metric is the price-to-sales (P/S) ratio. In its classic form, this metric compares a company’s stock price with its revenues.
As many DeFi protocols are already mature and generate revenue for their founders, an analogous metric can be applied. It is computed by dividing the protocol’s market capitalization by its annual revenue. The lower the value, the better.
“Annual revenue is a forward-looking revenue estimate calculated using a 30-day moving average,” according to Token Terminal’s description of the indicator.
Analysts classify DeFi project revenue into three categories:
- Total revenue — the aggregate value of trading fees or interest paid;
- Supply-side revenue — revenue for liquidity providers and lenders;
- Protocol revenue — the total proceeds accruing to token holders.
“A low ratio may indicate the protocol is undervalued, and vice versa,” explain Token Terminal’s experts.
According to them, the metric helps to navigate projects with a compelling value proposition.
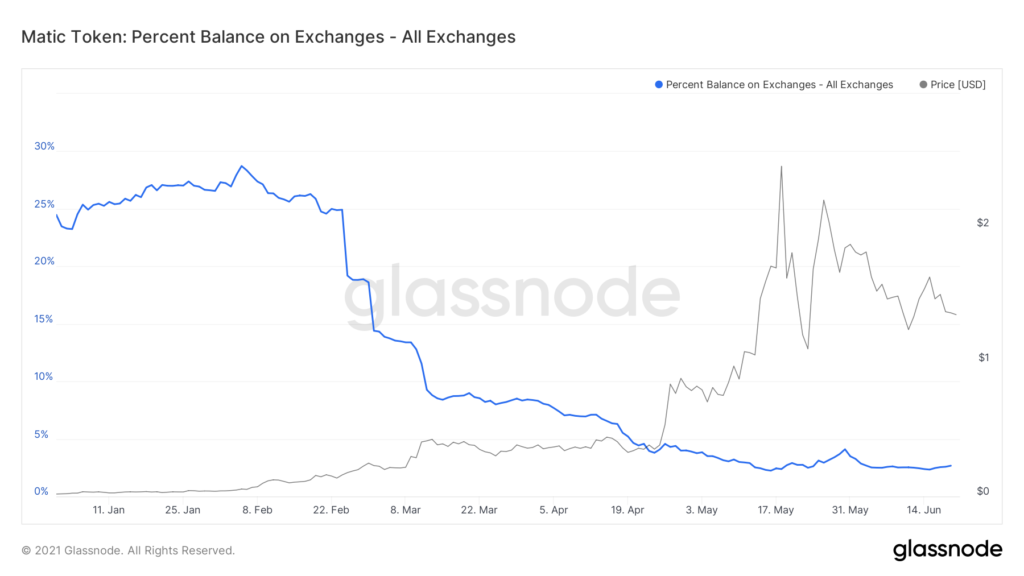
Token Offerings on Exchanges
The most massive sell-offs typically occur on centralized exchanges (CEX). Liquidity on such platforms is generally higher than on many non-custodial platforms.
When large volumes of tokens accumulate on a CEX, this can spell potential selling pressure, especially during periods of volatile market corrections. The lower the metric, the safer for token holders. If a large number of coins are withdrawn from CEXs, this may indicate accumulation of the asset in non-custodial wallets and lower near-term selling pressure in the future.
Significant changes in exchange balances in either direction can signal increased market volatility.
Glassnode is one of the services where you can view the dynamics of this metric across many crypto assets.
Number of Unique Addresses
A steady rise in the number of addresses can indicate growing activity in the ecosystem and demand for the token.
However, this metric does not always correlate with user-base expansion. Some may generate thousands of addresses to create the illusion of active and widespread token usage. Consequently, the indicator may only complement the overall market picture. It should be used alongside other metrics, considering various factors.
The chart below shows the evolution of the number of addresses for popular DeFi projects over the last three months.
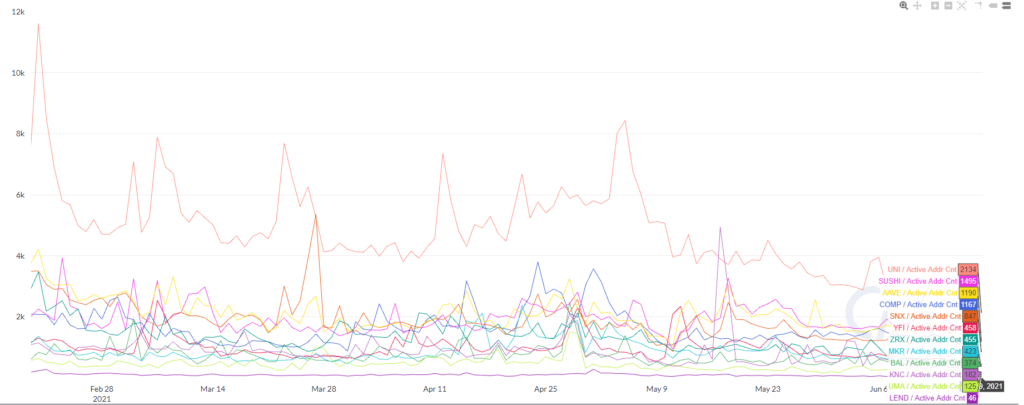
There is a dashboard on Dune Analytics showing the dynamics of the user count for some DeFi projects.
Inflation Rate
Some users may focus on tokens with a small circulating supply, treating them as scarce assets. But they should consider another important metric — the inflation rate.
If new tokens are issued into the market continuously and at high rates, their supply will naturally increase. This carries the risk of sustained price pressure should demand stay the same or fall.
The screenshot below shows a ranking of crypto projects sorted by inflation rates.
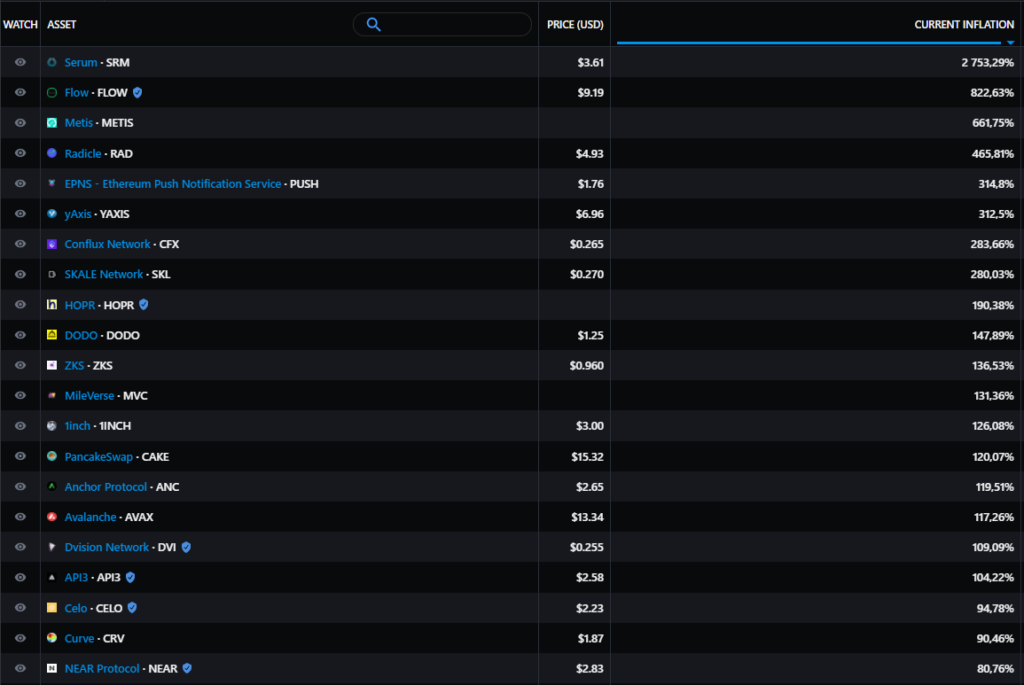
For a more comprehensive picture, it is prudent to study the project’s monetary policy features, including the token vesting schedule (if provided), the planned trajectory of the inflation rate, and other characteristics.
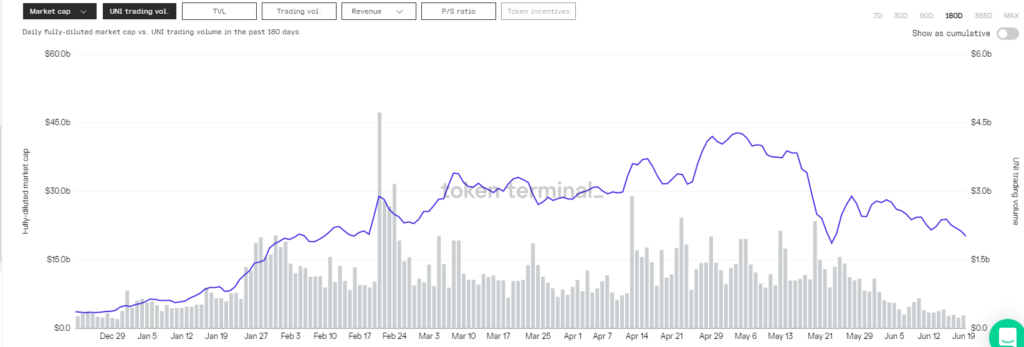
Trading Volume
Attention should also be paid to the trading volume of the project’s native token. Beyond speculative demand, high values of this metric can indicate liquidity and efficient price discovery.
Token Terminal also features the GMV indicator. According to the platform’s analysts, GMV is intended to answer questions:
- how strong is the demand for the project’s services?
- what is the total value, in dollars, that passes through the protocol?
The indicator may represent either the turnover of a decentralized exchange or the volume of deposited and borrowed assets in a lending app.
***
DeFi is an important component of the industry. In this segment, new analytical platforms with strong visualisation and a user-friendly interface continually emerge, easing interaction with a host of metrics.
The indicators presented in this review may be useful in fundamental analysis. Taken in isolation, a metric does not give a complete picture — it should be used alongside other tools, in comparison with competing projects’ metrics and considering overall market conditions.
Subscribe to ForkLog’s YouTube channel at YouTube!
Рассылки ForkLog: держите руку на пульсе биткоин-индустрии!