


The current Bitcoin market structure bears resemblance to the recovery phase after bear-dominated periods in 2016 and 2019, according to Glassnode experts who assessed capital movement between hodlers and speculators.
Capital rotation within digital assets markets occurs both between assets, as well as internally as coins change hands at different acquisition prices.
In this edition, we develop two indicators based off the Realized Cap and NUPL to track this rotation of capital between… pic.twitter.com/b3IyMrumLb
— glassnode (@glassnode) October 17, 2023
The realized-capitalization metric tends to plateau or ease during bear markets, as coins find new owners at lower cost.
During this process crypto assets gradually migrate to wallets of long-term investors, where they begin to mature (remaining idle for longer periods).
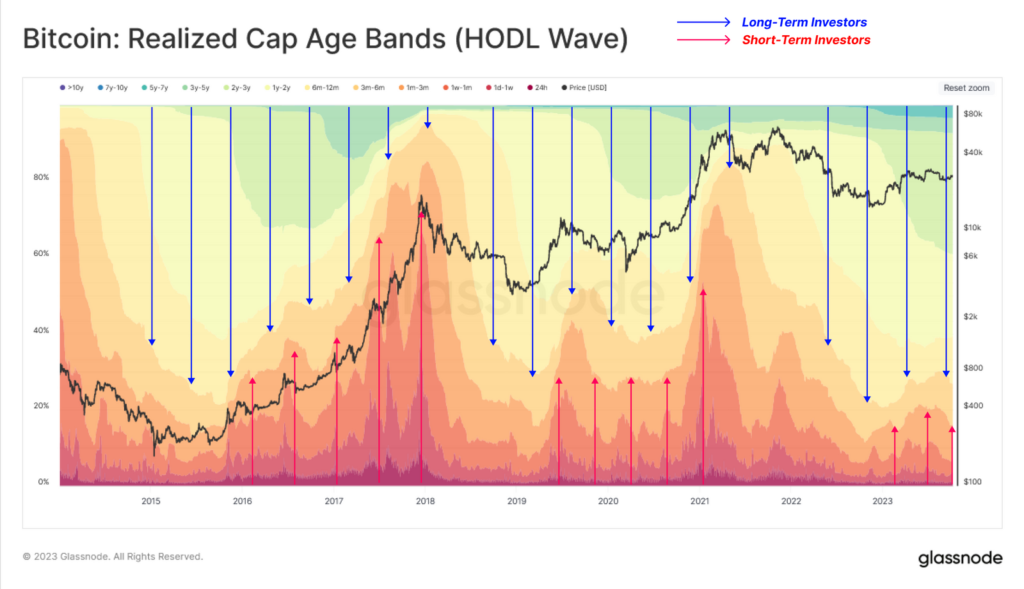
The trend can be illustrated with RCap HODL Waves, showing changes in the distribution of “wealth” by age groups (as a percentage of realized capitalization).
The tool visualizes changes in market demand and supply as capital rotates:
- During an uptrend, “old” coins are spent and passed from hodlers to new investors (hot bands expand, cold bands contract).
- During a downtrend, speculators lose interest and gradually transfer bitcoins to long-term holders (cold bands expand, hot bands contract).
At present the market has reached equilibrium between the two investor groups. There is a small positive inflow of new participants. This situation occurred in 2016 and 2019 when prices attempted to recover after a substantial drawdown.


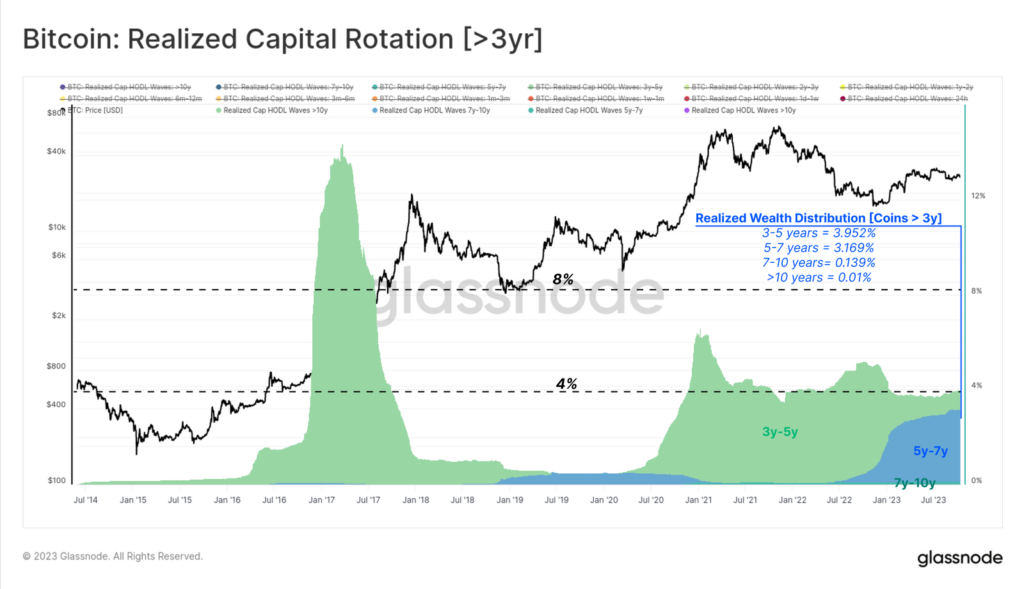
Analysts highlighted distinct age groups. They focused primarily on coins held for at least three years. This category accounts for less than 5% of “wealth” — most Bitcoins were acquired in 2018–2020.
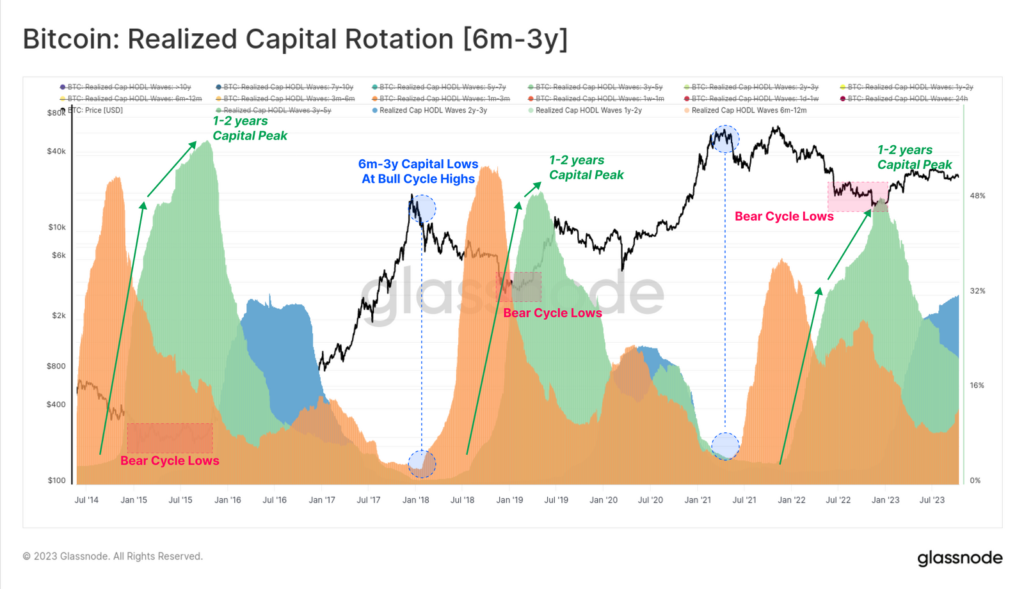
In a subsequent step, experts identified a cycle-sensitive sub-group of long-term investors who were active during 2020–23. These participants bought coins six months to three years ago.
Historically, holdings of this category reach extremes, often coinciding with bear-market lows and bull-market highs.
The peak volume of capital held within the one-to-two-year age band often coincides with the bear market’s deepest points, when accumulation by the most convinced hodlers is at its strongest. This dynamic helps establish a market floor.
And conversely: capital belonging to this category reaches a minimum near bull-market highs as long-term investors exert maximum pressure on distribution and, in turn, dampen rising demand.
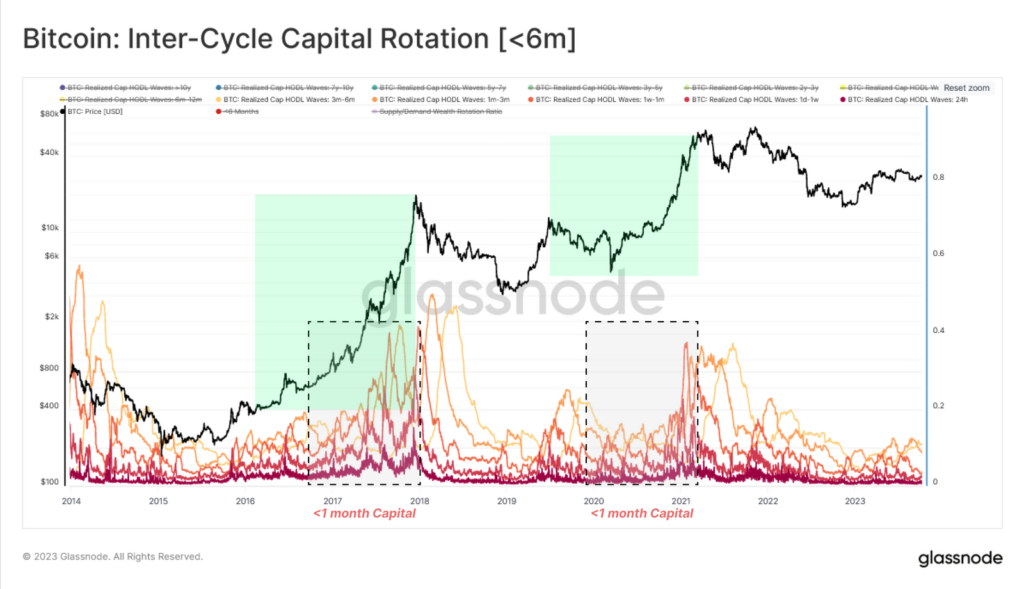
The youngest age groups are more closely linked to demand inflows, as they are actively traded coins that recently changed hands. Their dynamics are the opposite of the previous: the “width” expands during uptrends (new buyers) and contracts during bear markets as interest wanes.
The category under one month is especially sensitive. It is the natural counterpart to the 1–2 year group. Both are characterised by roughly similar behaviour.
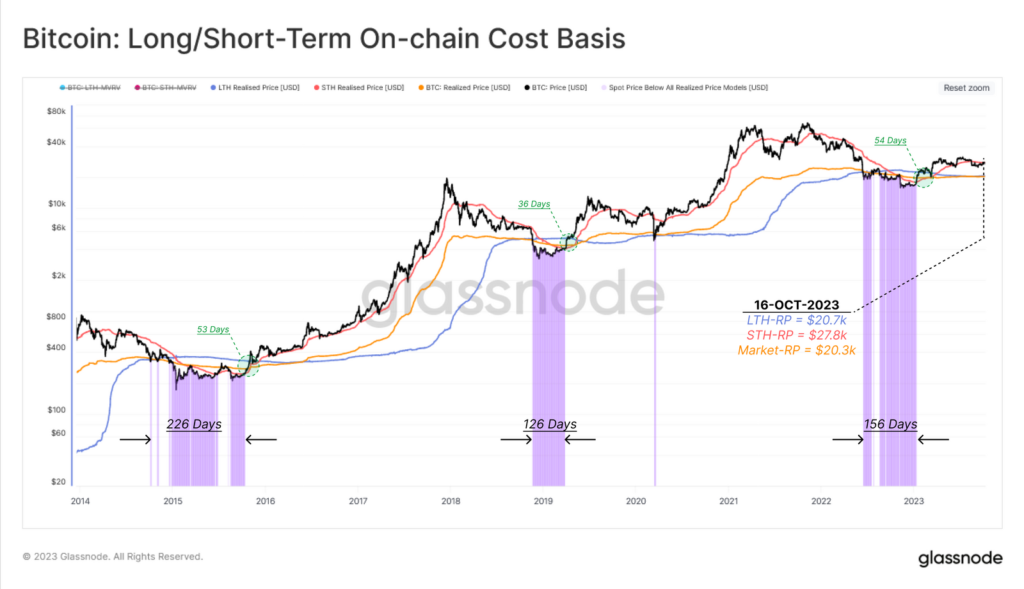
To assess capital rotation, analysts highlighted two dominant groups:
- Short-term holders
- Long-term holders
- Market as a whole
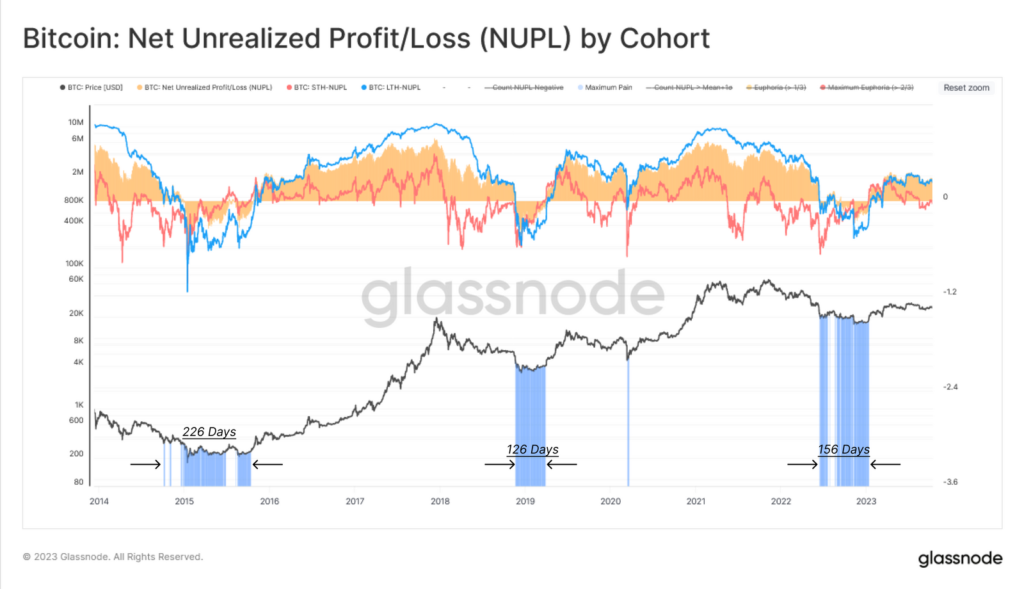
In the diagram below, periods are shown when the spot price falls below the purchase level across all defined groups, reflecting a zone of acute financial instability.
Another instrument for quantifying unrealized losses is the use of the Net Unrealized Profit/Loss (NUPL).
The chart below indicates positive results for hodlers and for the market as a whole. For speculators, the metric is near neutral. Proximity to break-even suggests the level at $28,000.
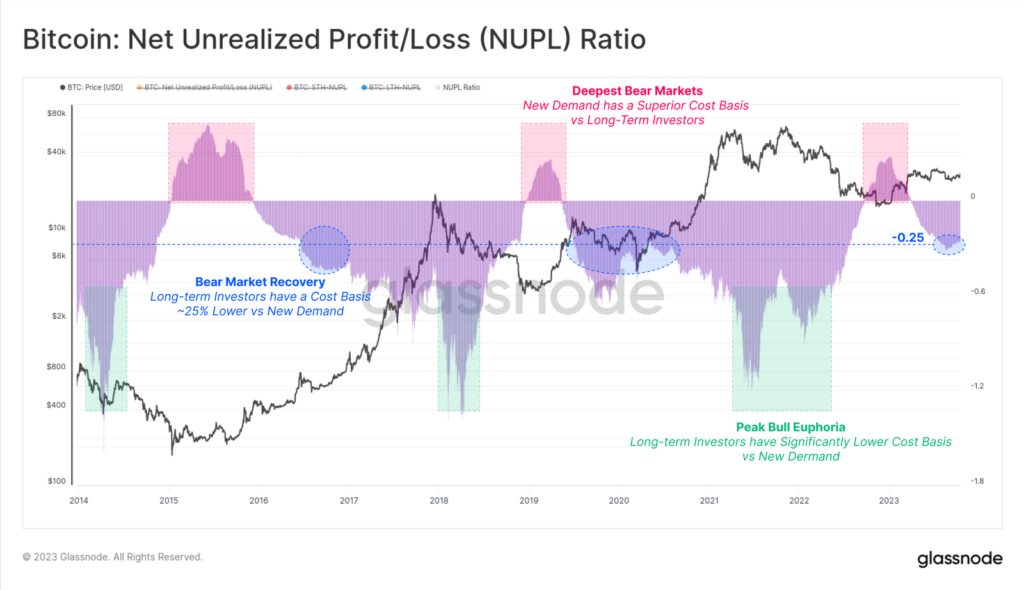
In conclusion, analysts proposed considering NUPL as an indicator for navigating market cycles, based on the shift of coins between existing supply (hodlers) and new demand (speculators).
The corresponding metric? entered the range -0.25 in Q3 2023. As noted earlier, the situation mirrors that observed in 2016 and 2019, and is typical of the recovery phase after bear markets.


Earlier, analysts from QCP Capital warned that Bitcoin is expected to fall despite hopes for approval ETF by year-end.
CryptoQuant analysts also forecast that, if the product is approved, the cryptocurrency market capitalization could surge to $1 trillion. They also projected Bitcoin’s price to rise to $50,000–$73,000.