

August 2022 in figures: Bitcoin correction, miners’ revenues rise and DeFi liquidity outflows
Key Highlights
- Leading cryptocurrencies showed signs of a reversal, but subsequently resumed their decline.
- Against the backdrop of the upcoming The Merge update investors showed interest in Ethereum derivatives, but withdrew assets from exchanges and DeFi applications.
- The Maker community fretted over the threat of DAI collateral being blocked amid sanctions on Tornado Cash
- Many market participants expect further Fed rate hikes and a deepening recession in the United States.
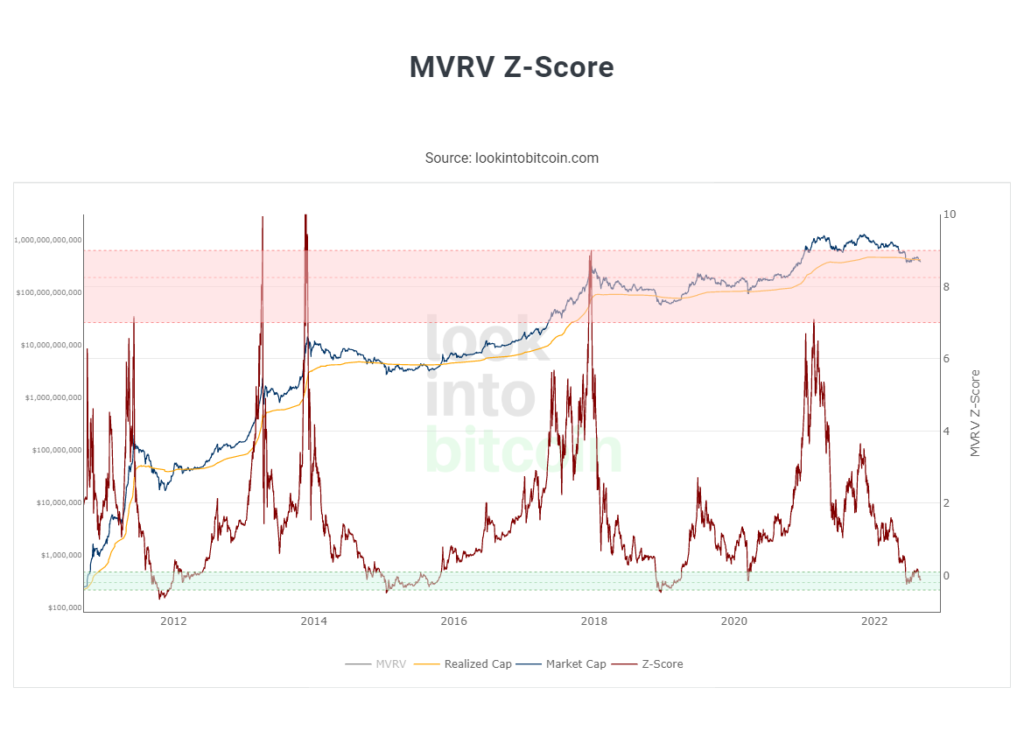
- Some on-chain indicators hint at bearish signals, but many metrics point to Bitcoin being deeply oversold.
- Miner revenues for Bitcoin and Ethereum rose by 12% and 22%, respectively.
- Bitcoin dominance fell below 40% — to levels seen at the start of 2022 and 2018.
Dynamics of Leading Assets
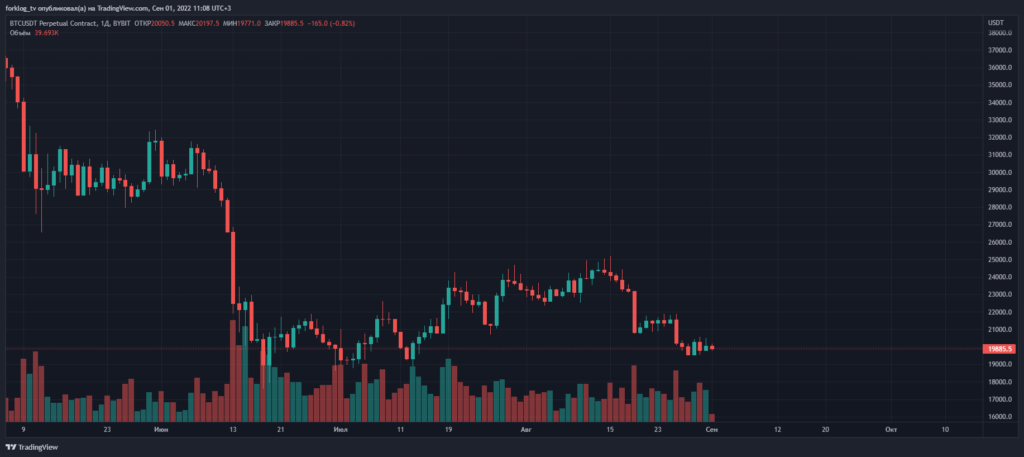
- In August, Bitcoin extended its sideways range to $19,500–$25,000. In the first half of the month, leading cryptocurrencies posted local highs; the second half was marked by a correction.
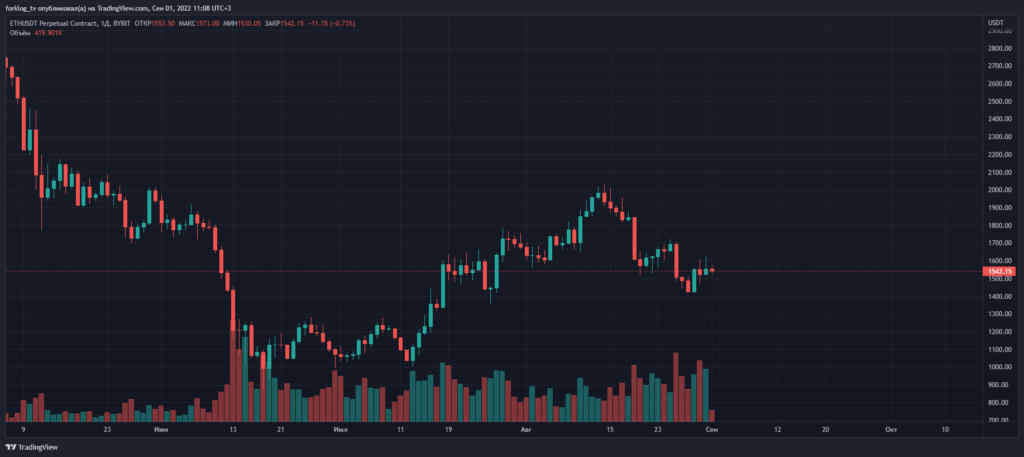
- Ethereum showed somewhat better dynamics. Against the backdrop of The Merge update, the second-largest cryptocurrency surpassed $2,000, but the month ended below $1,500.
- Bitcoin dominance fell below 40% — to levels seen at the start of 2022 and 2018.
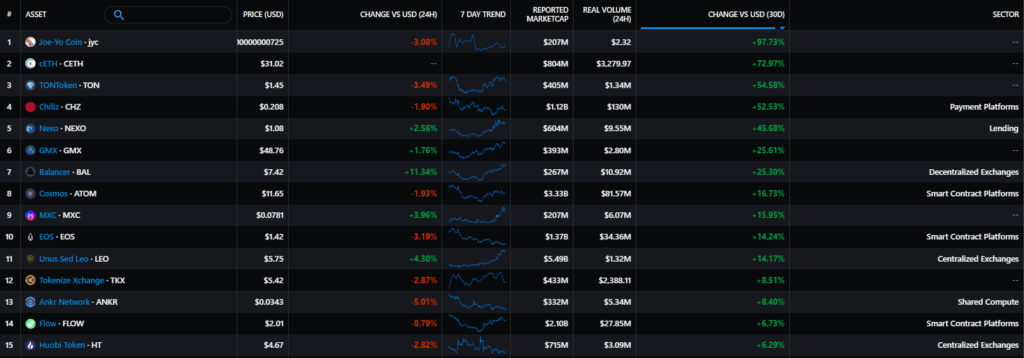
- Among mid-cap assets, Ethereum pool token Compound (cETH) ranked among the best performers. In the backdrop of statements by Telegram founder Pavel Durov about a possible launch of an accounts marketplace in the messenger and various other Web3 initiatives on Toncoin, TON’s native token showed impressive momentum. The token of blockchain platform Chiliz (CHZ) also rose following the announcement of an expanded partnership with Argentina’s football association through 2026.
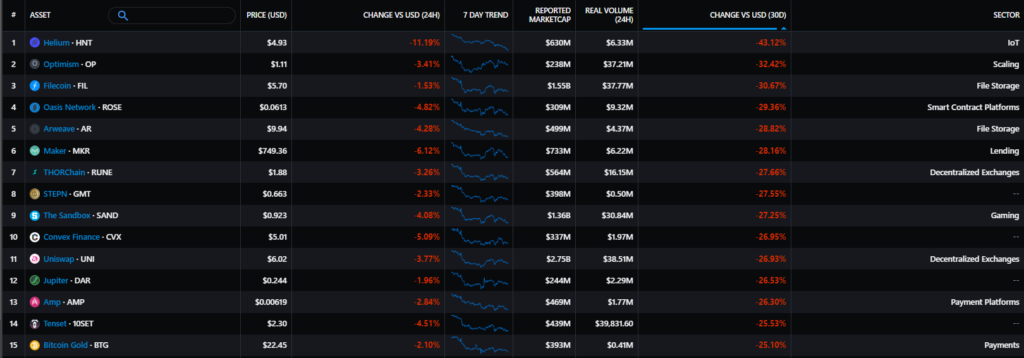
- Among the laggards was the token taken Tornado Cash (TORN), a sanctioned crypto mixer by OFAC. The arrest of a protocol developer triggered a wide discussion in the community. Other laggards included Helium (HNT) and Optimism (OP) tokens, which entered a prolonged correction amid the bear market.
Equities of Crypto- مرتبط Companies
Voyager Digital (VYGVF):
+55.54%
Trading momentum of mining companies
Canaan (CAN):
-10.9%
Ebang International (EBON):
-3.1%
Riot Blockchain (RIOT):
+0.5%
Hut 8 (HUT):
-1.5%
Marathon Digital (MARA):
-5.2%
In August, Coinbase stood out among publicly traded crypto-related firms. Despite releasing weak results, the platform announced a partnership with BlackRock, which will give clients access to digital assets via Coinbase Prime. Voyager, currently in bankruptcy proceedings, saw a notable rally, but its value has plunged more than 99% since the start of the year.
Macro-economic backdrop
- At Jackson Hole, Fed Chair Jerome Powell warned against rushing to reduce rates to keep inflation expectations in check. This contrasted with investors’ expectations for a policy pivot in spring 2023.
- Powell explained that the magnitude of the rate hike in September would depend on upcoming macro data, and that July’s inflation decline is not enough. By that time, investors will have had time to analyse the fresh CPI print (September 13) and the employment report (September 2).
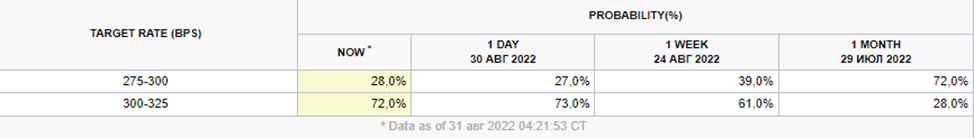
- The market oscillates between a 50 bps and a 75 bps move in September. Against hawkish Fed rhetoric, the latter scenario gained traction (probability rose from 28% to 72%). November and December are expected to feature 25 bps steps.
- After Jackson Hole, the policy pivot faded from the market until mid-2023. This disposition would increase risk-asset sensitivity to negative macro data, given the high correlation between Bitcoin and the S&P 500.
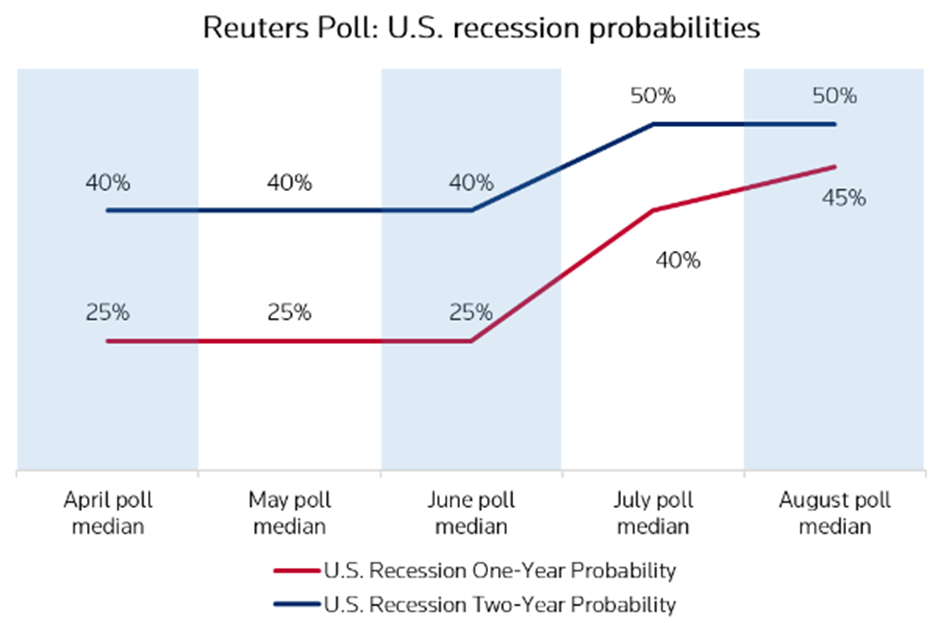
- Amid Europe’s energy crisis and China’s economic slowdown, economists raised the probability of US recession, rising from 40% to 45% (assuming September’s move is only 50 bps).
Market mood, correlations and volatility
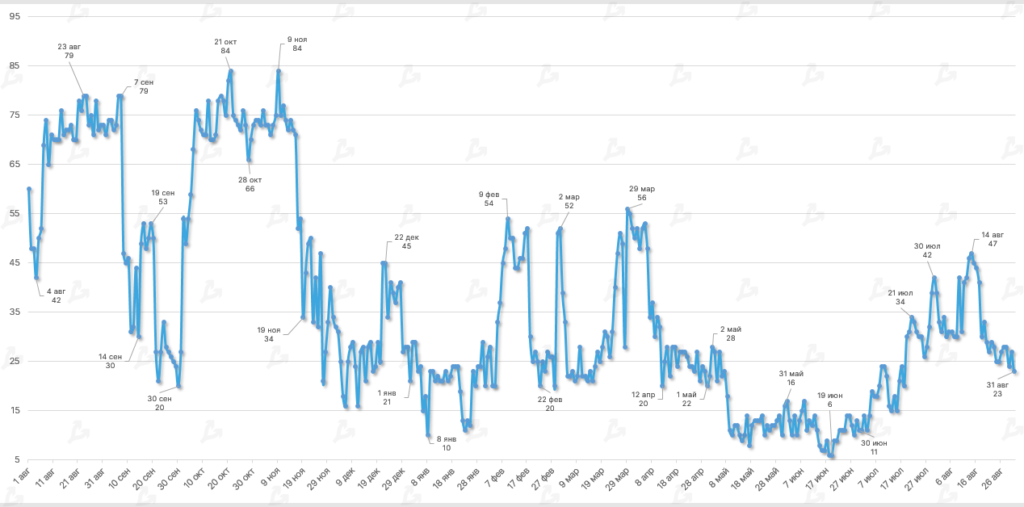
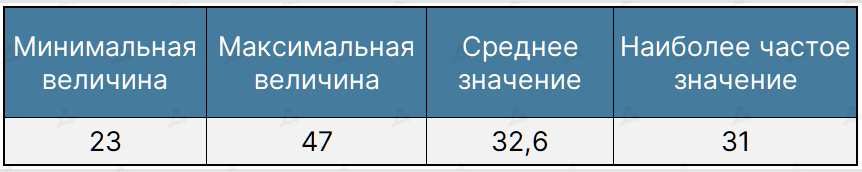
- Compared with July, August’s average Fear and Greed Index rose by almost a third (32.6 versus 24.2). Yet by month-end the indicator returned to the “extreme fear” zone.
- Investors’ sentiment was affected by the Powell speech and other macro factors. Negative backdrop also included rumors of Mt. Gox creditors being reimbursed and information about movements of a crypto asset tied to a bankrupt exchange.
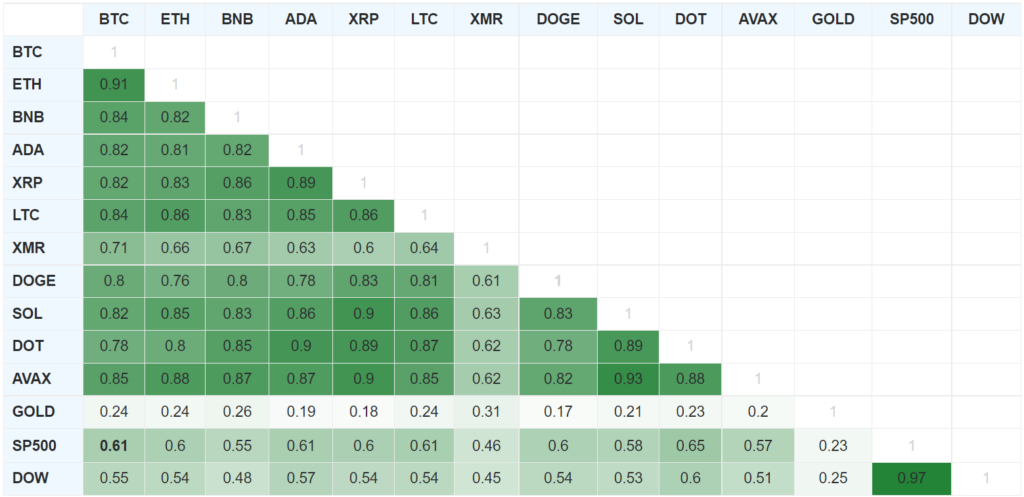
- Bitcoin’s correlation with the US stock market weakened slightly. The 90-day smoothed average correlation stood at 0.61 with the S&P 500 and 0.55 with the Dow (July figures were 0.64 and 0.58, respectively).
- The statistical relationship between Bitcoin and gold, conversely, strengthened (0.24 versus 0.15 last month), but remains too weak to regard Bitcoin as a reserve asset.
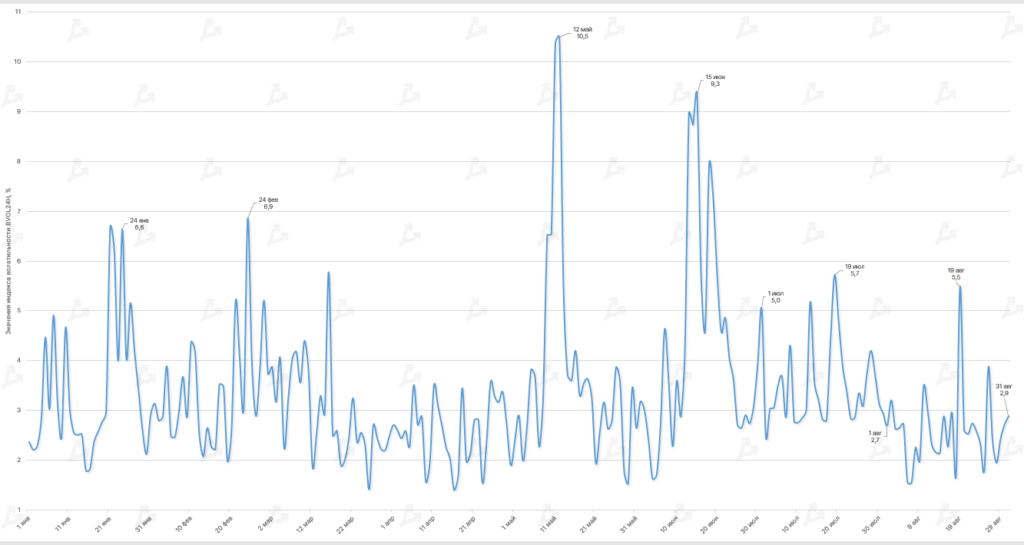
- In August the average BVOL24H was 2.6%, below July’s 3.5%. Spikes occurred during local price corrections on August 19 and 26. At other times, price action traded within a relatively narrow range.
On-Chain data
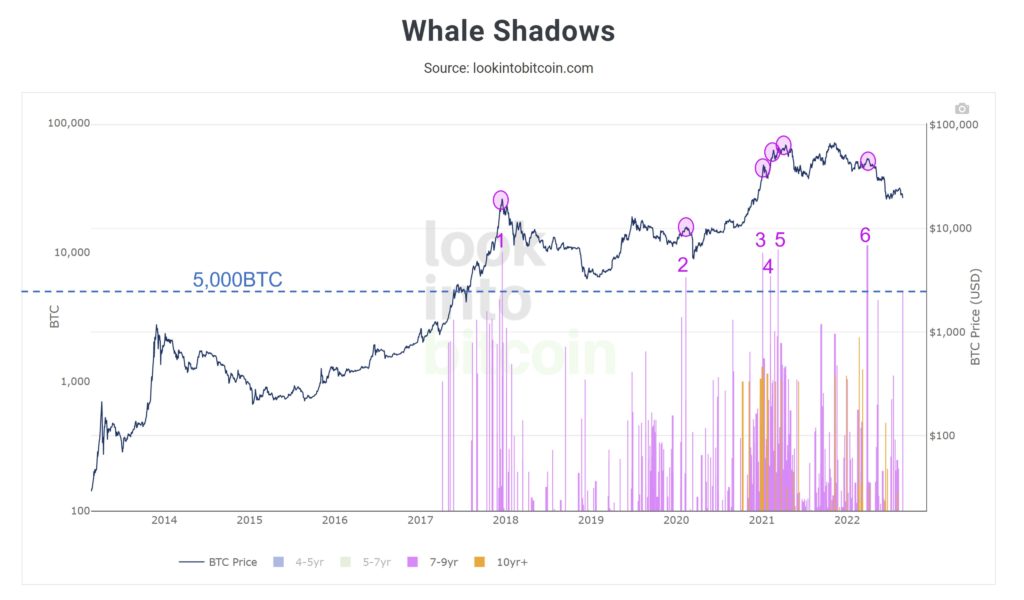
- 29 August, on-chain indicator Whale Shadows indicated the awakening of a large cluster of Bitcoin that had lain dormant for a long time. The chart above shows that such spikes have historically been followed by notable price corrections for Bitcoin.
- Researchers revealed that the 10,000 BTC moved for the first time since 2013 are linked to the bankrupt Mt. Gox exchange.
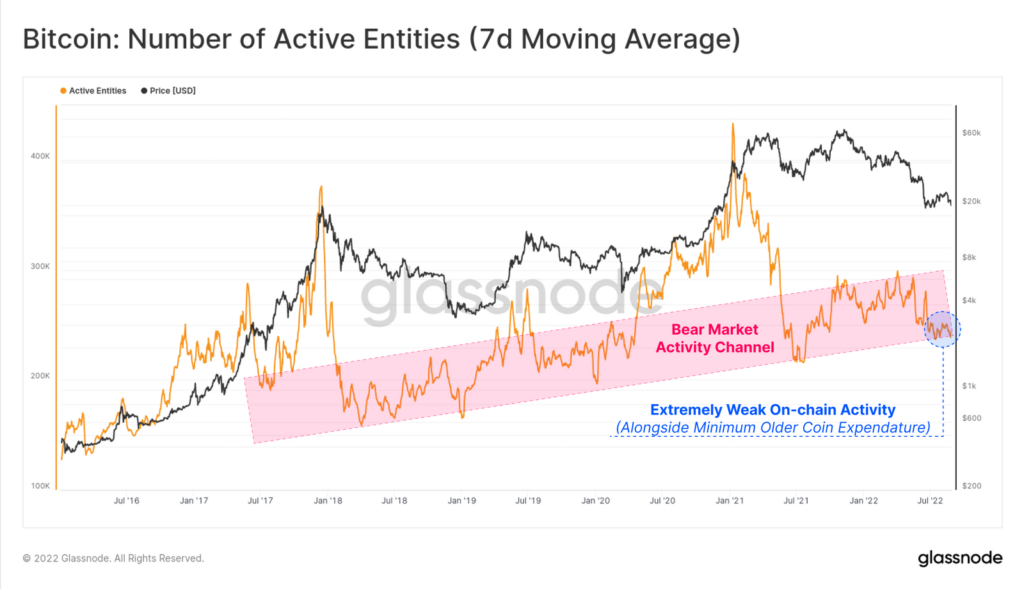
- The seven-day moving average of active addresses (excluding co-related) tests the lower boundary of a bearish channel. Glassnode analysts suggested that further declines would indicate a “regrettable deterioration of the user base, not seen in many years”.
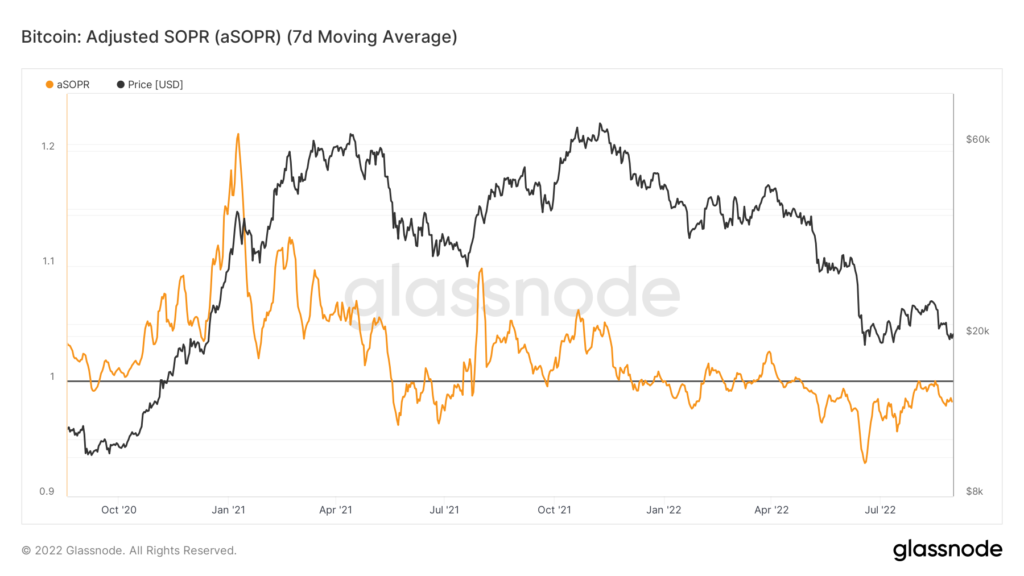
- In August the on-chain metric aSOPR remained below 1 despite Bitcoin testing $24,000; this suggests that many short-term investors closed positions with little or no loss. A return above 1 would signal renewed demand and improved market sentiment.
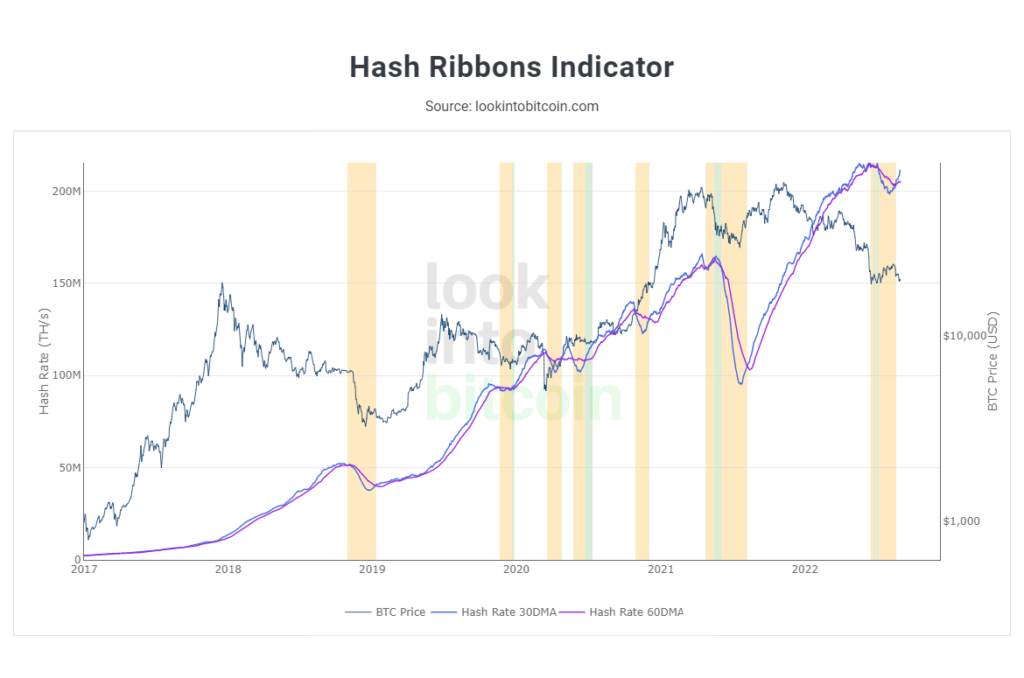
- The Hash Ribbon indicator signaled the end of miner capitulation (blue line crossing the purple line from below). Charles Edwards, head of Capriole Investments, called it a “great buying signal”.
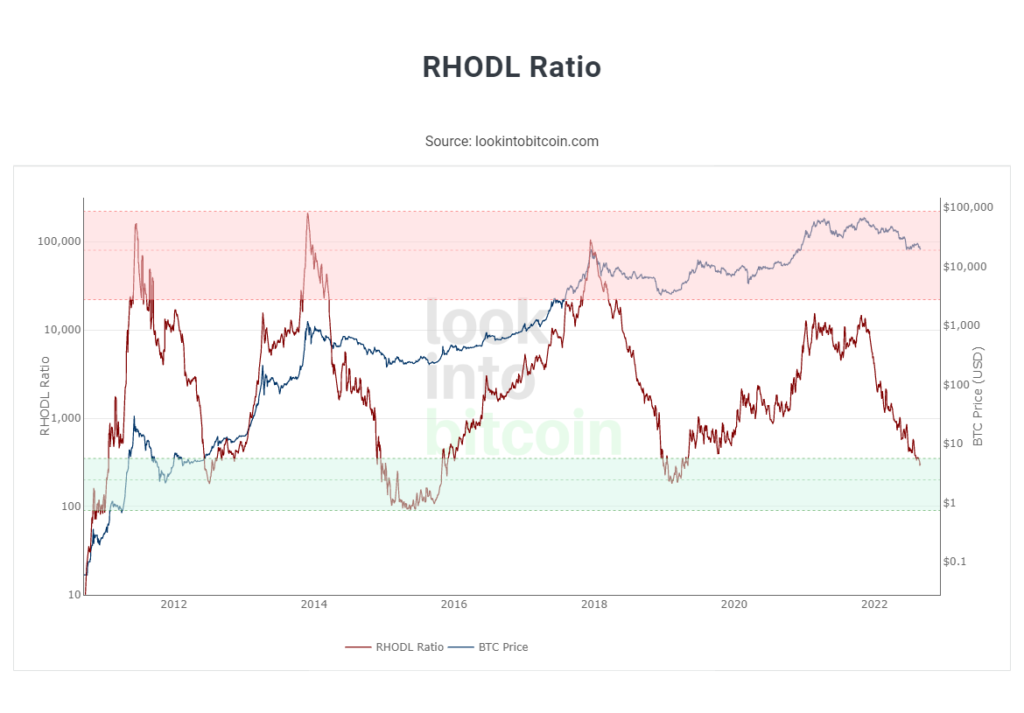
- Another long-term indicator, the RHODL Ratio, points to Bitcoin’s deep oversold condition. Its values remain in the “green zone” for the first time since early 2019.
- A similar signal is given by the metric MVRV Z-Score. Its values in the second half of August again suggest the price of digital gold is below its
Found a mistake? Select it and press CTRL+ENTERРассылки ForkLog: держите руку на пульсе биткоин-индустрии!
Related