


Despite unsuccessful attempts by Bitcoin’s price to regain support at $23,000, on the daily chart the moving averages formed a ‘golden cross’ — a precursor to a bull market.
In the image below, the 50-day MA (marked in red) crossed from below to above the 200-day MA (blue).


The last time a ‘golden cross’ formed was in September 2021 — two months before Bitcoin reached its all-time high.
However, on the weekly chart a ‘death cross’ appeared — a mirrored situation implying a bearish scenario.


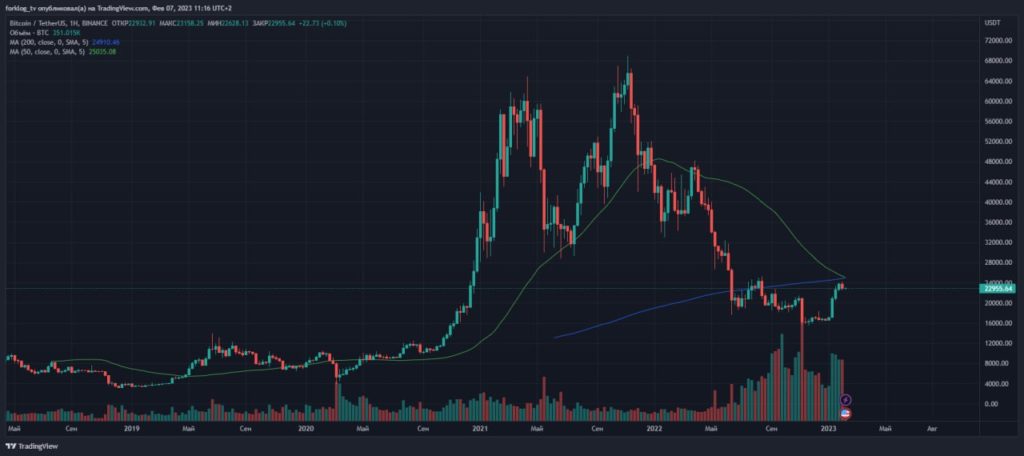
A Venturefounder, an analyst working with CryptoQuant, sees as the next development a pullback to $20,000 (the 200-day MA) followed by a move toward the psychological level of $25,000.
#Bitcoin goldencross just happened!
This potential correction could see #BTC retest $20k (#200DMA and key support), then in the bullish case, test $25k next.
Make $25k support and it’s nail in the coffin for the bears. pic.twitter.com/baPFOTECCG
— venturefoundΞr (@venturefounder) February 6, 2023
The CryptoQuant analysts see in the ‘golden cross’ a complement to signals from a number of other important indicators, which point to the start of a coin-accumulation phase ahead of the next halving.
#Bitcoin Enters Technical Golden Cross and a New Paradigm
«As a summary, bitcoin currently sits at an intersection of multiple crucial indicators, heading into a new paradigm.»
by @oinonen_t— CryptoQuant.com (@cryptoquant_com) February 5, 2023
The crypto trader and host of The Wolf Of All Streets podcast, Scott Melker, set $25,212 as his target. A break above this level would neutralize any bear theses, he added.
$25,212.
That’s the line for $BTC.
A break above would be the first higher high since $69,000 and would technically invalidate the bear thesis.
— The Wolf Of All Streets (@scottmelker) February 2, 2023
Earlier, to the same conclusion arrived Adam Farthing from B2C2.
Earlier, Glassnode observed the transition phase from bear to bull.