


Leading RoboForex analyst Dmitry Gurkovsky explains the potential scenarios for Bitcoin’s price movement and several popular altcoins.
Cryptocurrencies continue to consolidate ahead of another attempt to develop a bullish impulse.
On many charts, a “triangle” pattern is forming, with a breakout above its upper boundary implying the continuation of the current trend. However buyers’ reluctance to move higher could raise the likelihood of a downside correction.
Technically, the market is broadly ready for a continued ascent. Every trend should “breathe.” Therefore, the current pullback can be viewed as a natural phase of the trend.
Bitcoin
On the daily chart, Bitcoin continues to correct near the important resistance level of $12,150. The nearest support zone sits at $10,605.
RSI values have nearly tested the support line, which could trigger another attempt at price growth. A minor correction testing the support area at $10,605 cannot be ruled out. After that, one could expect a continuation of the ascent toward a potential target at $13,865.
The bullish scenario would be invalidated by a break below the lower boundary of the rising channel with the price holding below $10,500. In that case, the downside target could be $8,690.


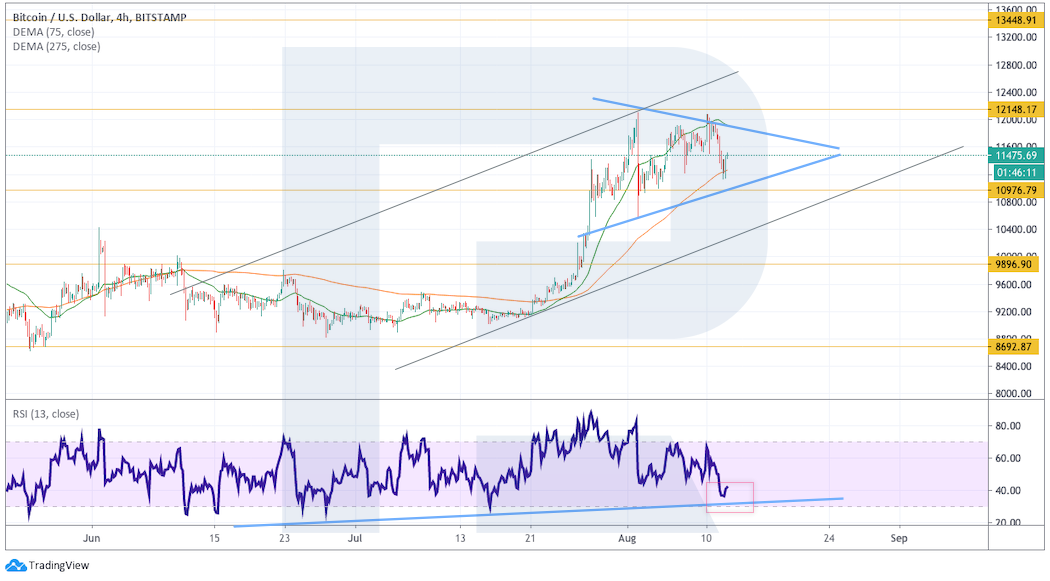
On the 4-hour chart, buyers failed to push the price beyond the local high. The current price action forms a “triangle.” A breakout above its upper boundary with the price holding above $12,150 would signal a continuation of the price rise to the pattern’s height. A good confirmatory signal would be a rebound from the RSI support line. The target for the rally and completion of the pattern is $13,450.
A scenario invalidation would be a break below the triangle’s lower boundary with the price holding under $10,800. In that case a continuation of the drop toward $9,895 is possible.


Ethereum
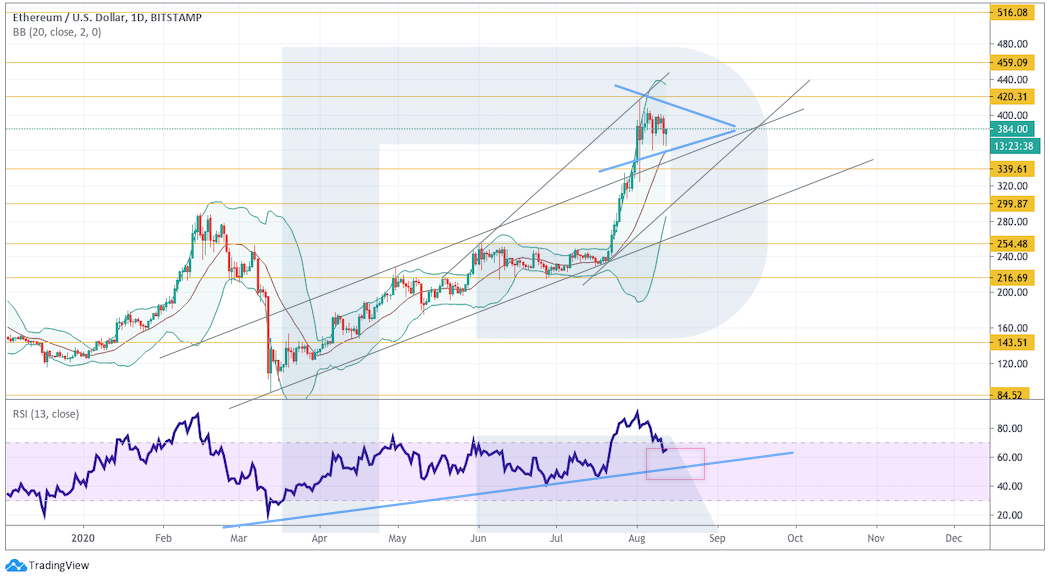
ETH/USD quotes on the daily chart are again trapped within a triangle. Usually this pattern breaks in the direction of the current trend. Here, however, prices stay above the upper boundary of the ascending channel, which is a strong signal for the continuation of the price rise.
Confirmation of the idea would be a breakout above the upper boundary of the triangle pattern with the price holding above $420. A second signal in favor of continuing the bullish impulse would be a rebound off the RSI support line, whose previous test triggered a strong price rise.
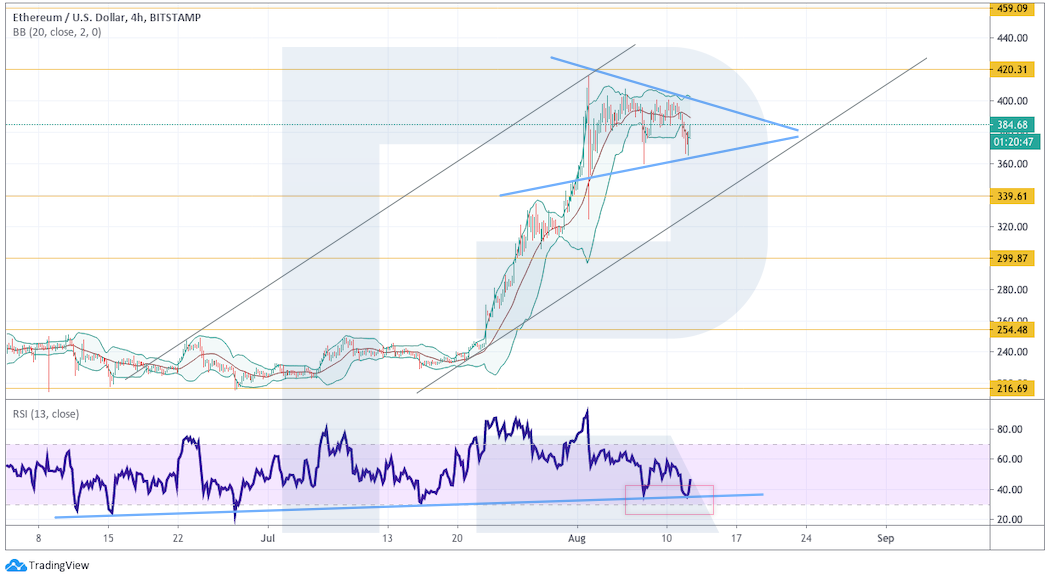
On shorter timeframes, RSI values have twice bounced off the support line, suggesting the formation of a reversal pattern “Double bottom” on the RSI chart. A breakout of resistance with RSI values above 60 would trigger an attempt to develop a bullish impulse.
Invalidation of the bullish scenario would be a break below the lower boundary of the rising channel with the price holding below $340. In that case, consider further declines toward $300.
Litecoin
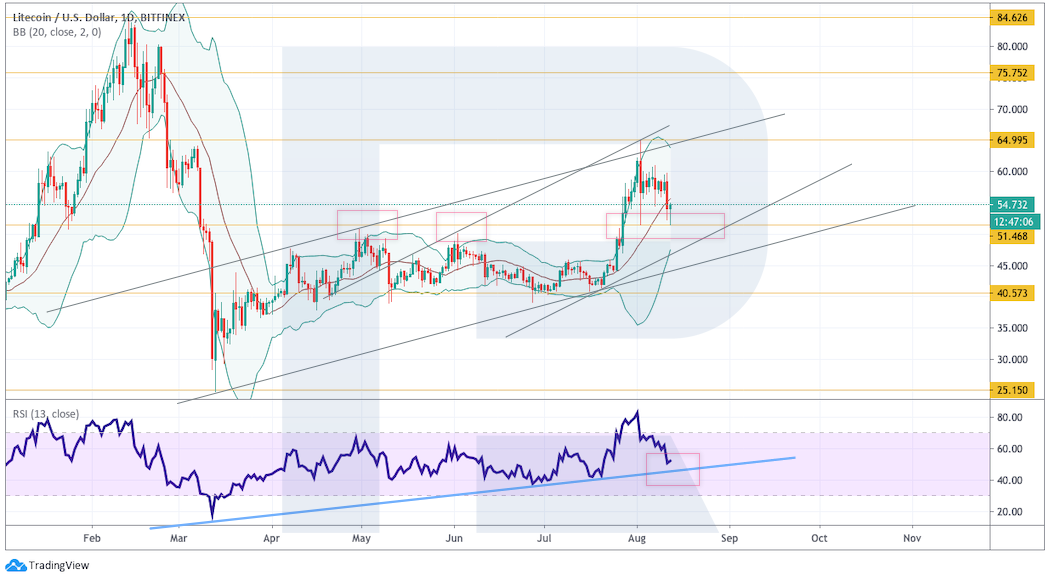
Litecoin prices on the daily chart remain above the support level, indicating buying pressure and an unwillingness for the market to enter a deeper correction.
As long as the support area is not breached, consider attempts to move the price upward and the start of another bullish impulse. An additional signal would be a rebound off the RSI support line. A break of $65 would signal a genuine bullish trend toward the $75 target.
The bullish scenario would be invalidated by a break below the lower boundary of the rising channel with prices below $45, in which case one should consider the continuation of declines toward $40 and below.
EOS
The cryptocurrency EOS on the daily chart continues to trade above the support level. There is potential for a rebound and continuation of price rise toward the first target at $3.50. An additional signal in favor of this scenario is a rebound from the trend line on the RSI indicator, where after the breakout a new test is likely.
An invalidation would be a break below the lower boundary of the ascending channel with the price holding below $2.50, in which case one should expect a continuation of the drop toward $2.15.

XRP
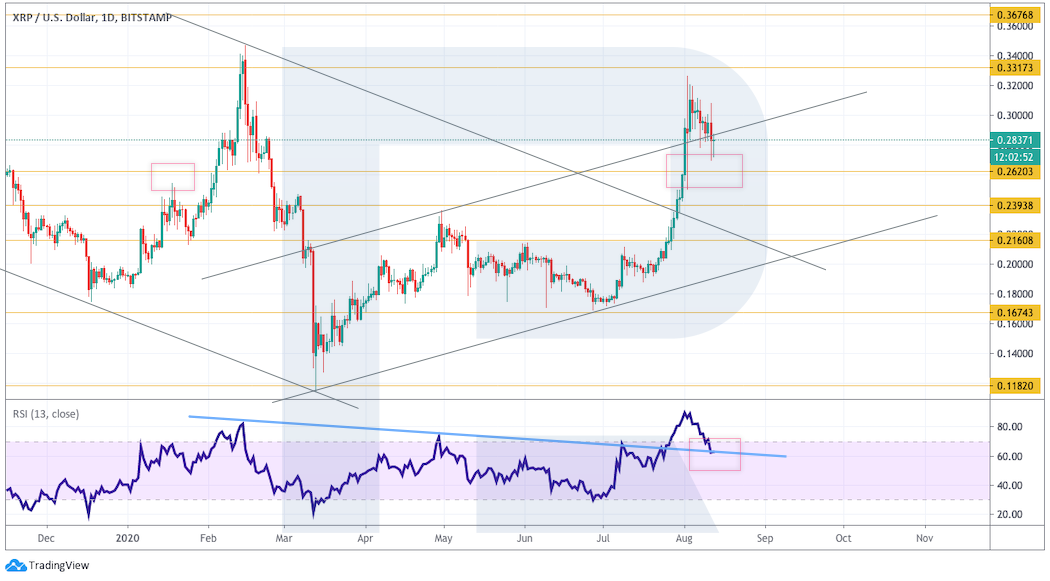
XRP quotes have again returned below the upper boundary of the rising channel. Bearish pressure remains.
To continue the rally, it is essential to move above $0.33 again. A test of the RSI support line would be another bullish signal. An invalidation could be a break below the $0.234 support zone, after which the price could drop toward $0.216.
On the lower timeframes, prices correct within an ascending “Flag” pattern. A breakout above the upper boundary of the ascending channel and a price hold above $0.3 would signal the start of an ascent and price action toward $0.36. A bounce off the RSI support line would also support this scenario.
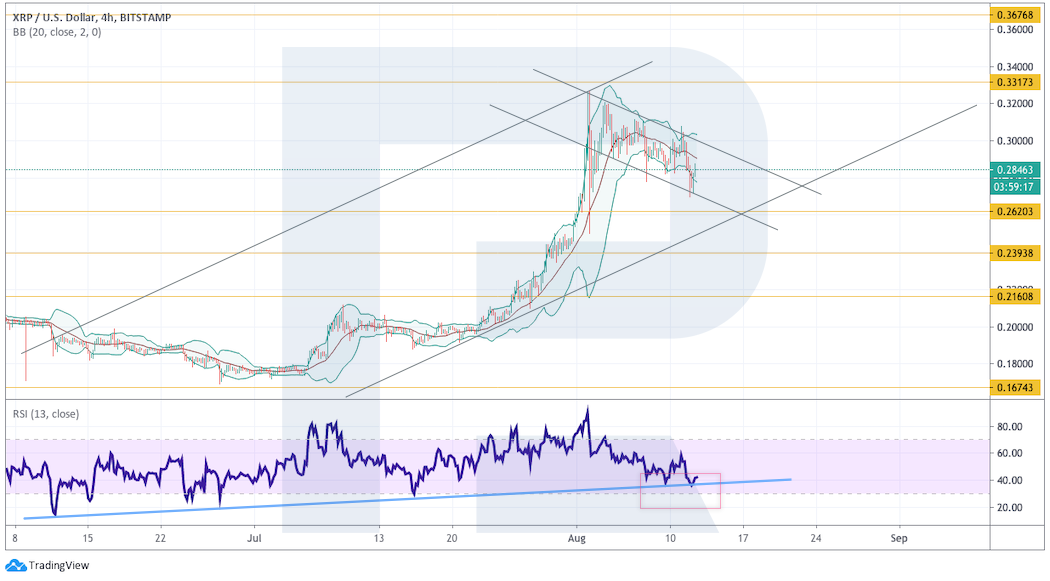
Invalidation of the bullish variant for buyers could be a break below the lower boundary of the rising channel with the price holding below $0.262. The next downside target would be $0.216.
Subscribe to ForkLog’s channel on YouTube!