


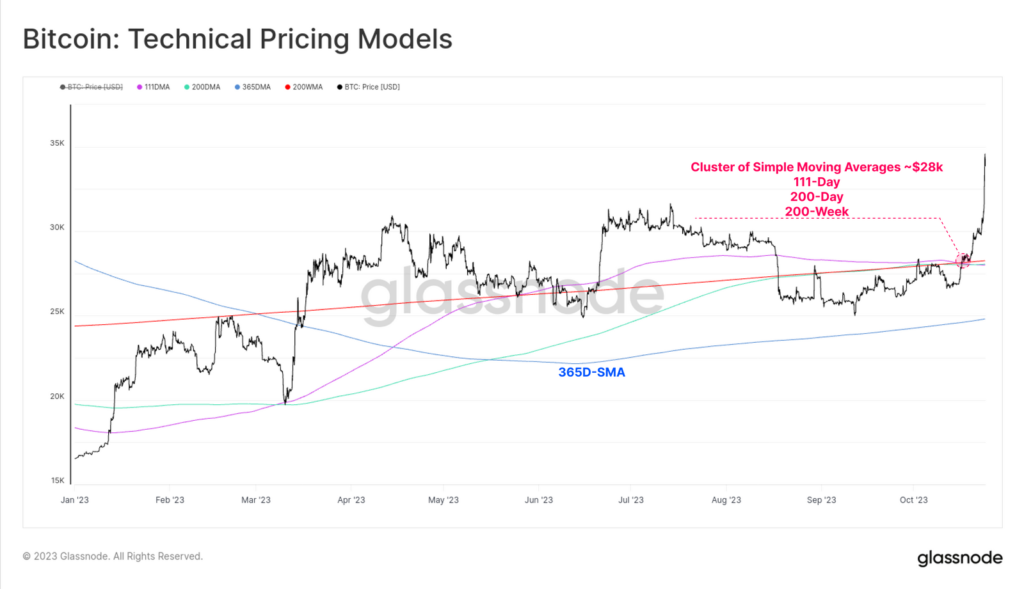
Bitcoin prices hit a new high since the start of the year, breaking through key barriers near $28 000 both technically (200D MA, 200W MA) and on‑chain in nature (the “cost basis” of coins). These conclusions were drawn by Glassnode.
As a result of the break above these levels, a significant share of supply moved into positive territory, laying the groundwork for the resumption of the 2023 uptrend. The metrics above will become key benchmarks in the coming weeks, analysts said.
The technical picture of digital gold is shown below.


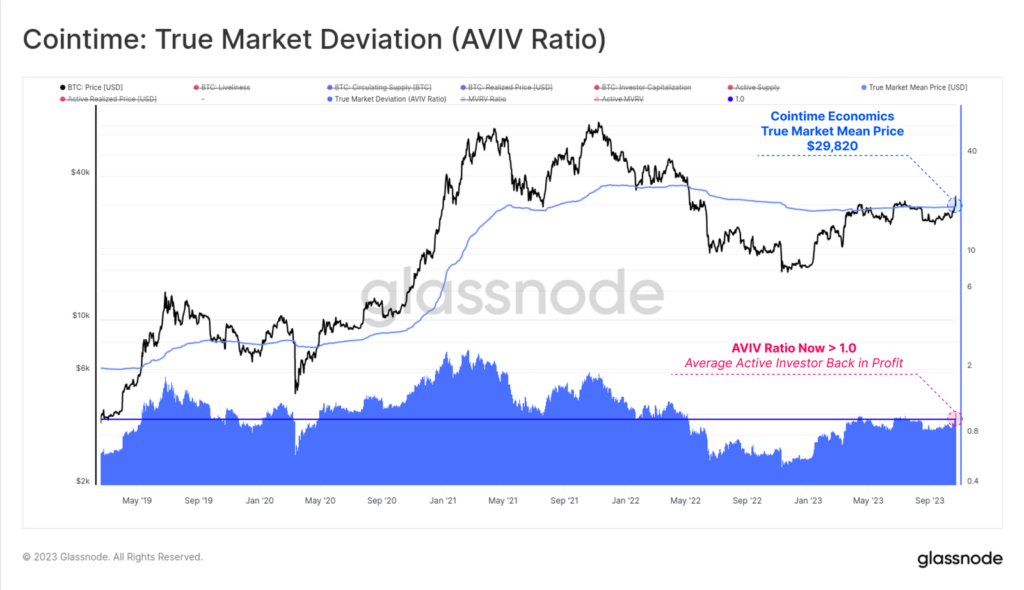
The next chart shows Bitcoin’s price dynamics, as well as the True Market Mean Price indicator developed jointly with ARK Invest — at $29 820.
It reflects the average price at which the last transactions occurred. The calculation includes those that changed hands within a given period. Historically, Bitcoin traded half of its life above this level, and the other half below it.


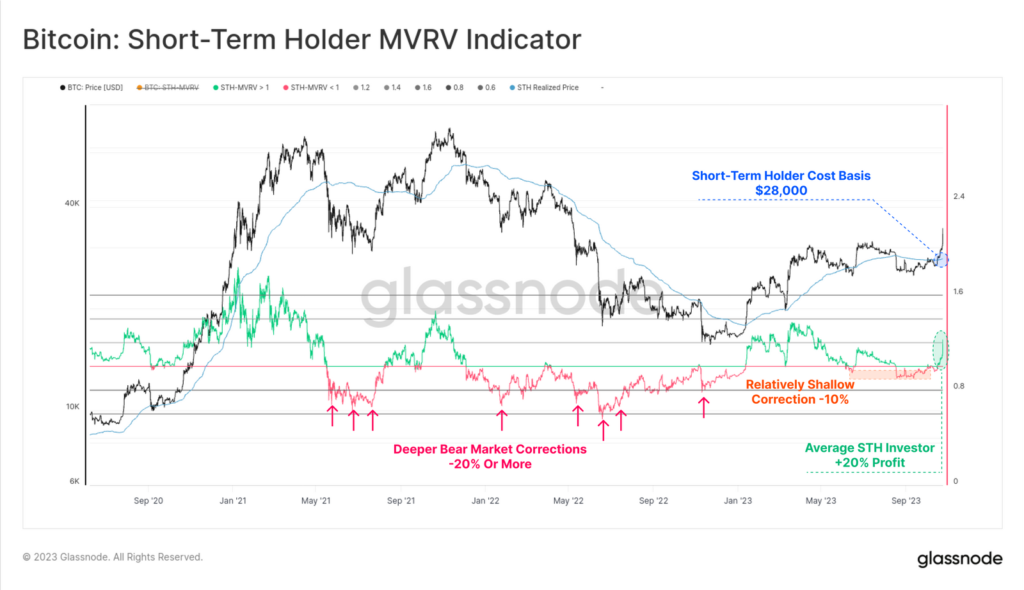
The current price has also surpassed the traditional cost basis of coins bought by speculators. Their ‘paper’ profit reached about 20%. The chart below shows the ratio MVRV for this category of market participants, where red indicates periods when the market traded below the cost basis, and green indicates periods when it traded above it.
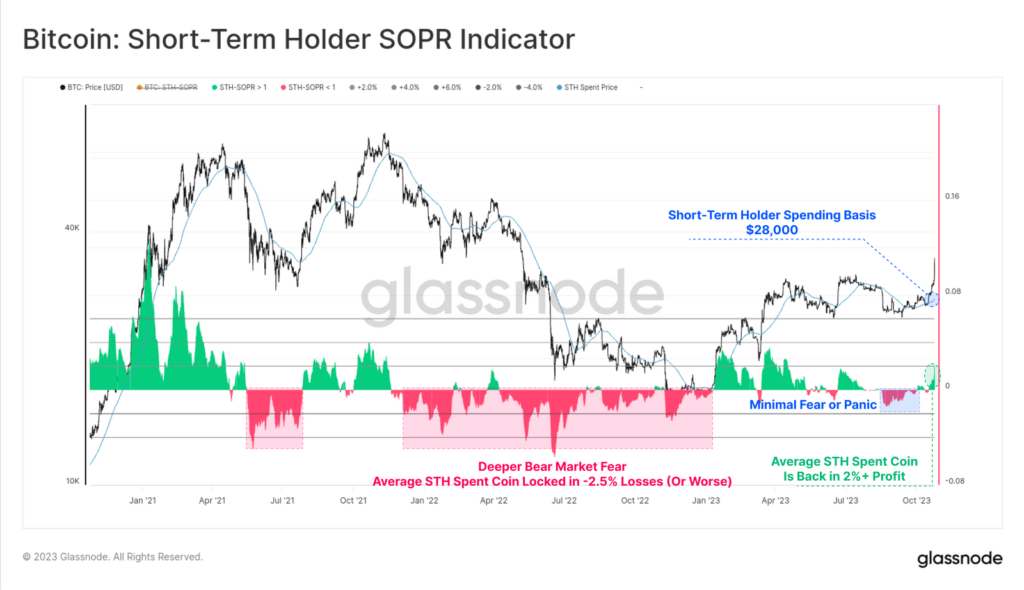
A similar picture is provided by the SOPR indicator, which measures the profitability of coins that were spent. As with MVRV, speculators began closing positions in the “in the green.”
Given the relatively smaller drawdown compared with 2021–2022, short‑term investors did not experience the same panic and fear as during the previous bear market in 2022. Analysts say this is a sign of the resilience of the speculators.
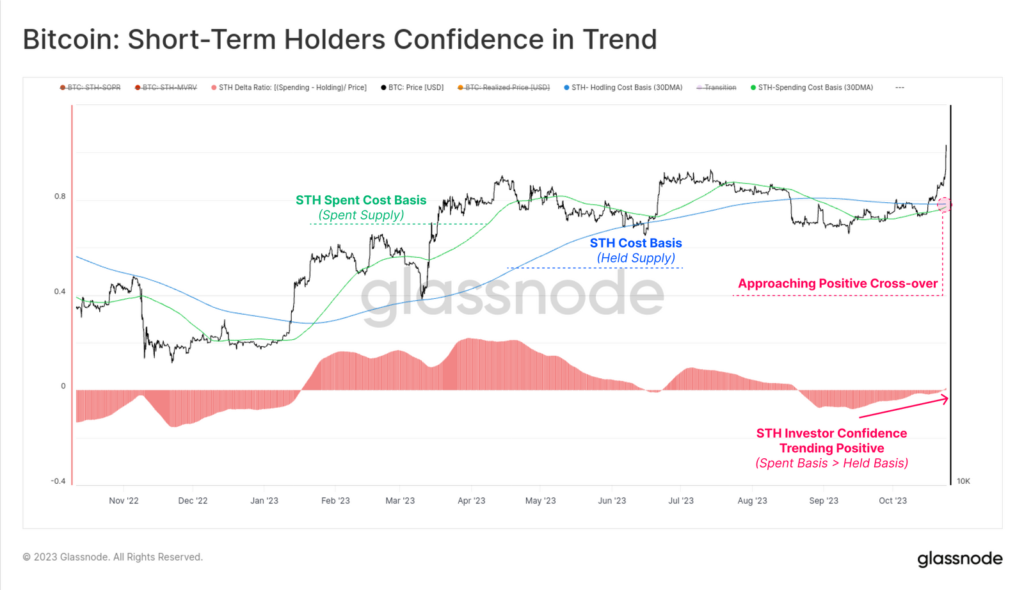
Overlaying the two metrics above has allowed analysts to create an oscillator that demonstrates investor trust. The indicator has now recovered to a neutral level and sits at the cusp of moving into positive territory — the cost basis of spent coins will exceed that of coins held in wallets.
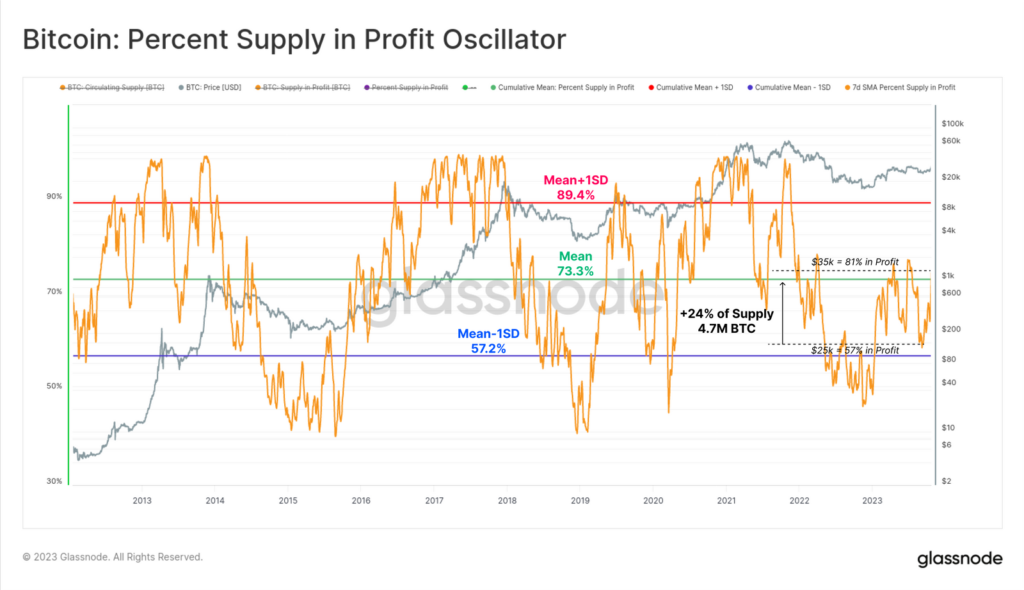
The rally of digital gold pushed hodlers’ coins into positive territory. Their share rose from 57% to 81%. In absolute terms, this figure rose by 4.7 million BTC, equivalent to 24% of the current supply. The figures give a good sense of how many coins were added to wallets in the $27 000–$35 000 range.
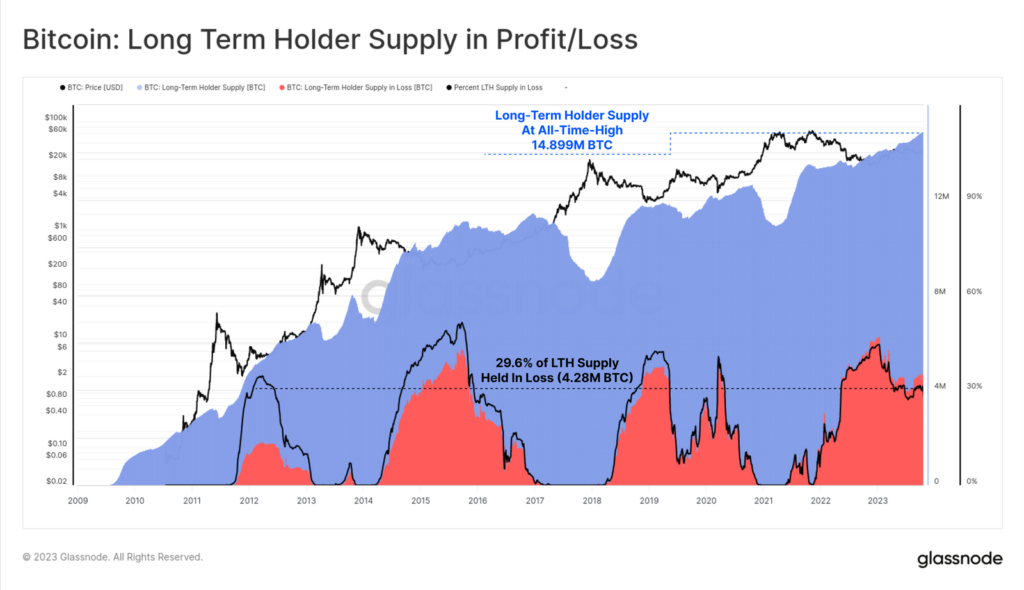
The price surge did not trigger a strong response from long‑term investors. The number of coins held by them reached a new ATH of 14.899 million BTC. The continued rise in the metric suggests that a larger volume of the supply is maturing into hodler-ready conditions rather than being spent.
“This suggests that hodlers may be more ‘seasoned’ and ‘stubborn’ than in previous cycles”, — noted the experts.
The driver of improving conditions was the expectations of approval for the Bitcoin-ETF.
On October 23, the proposed BlackRock instrument — the iShares Bitcoin Trust — appeared on the DTCC’s list of assets for which the company provides post‑trading, clearing and settlement services.
Earlier, Matrixport analysts forecast growth for digital gold if the product is approved to $42 000-56 000. CryptoQuant reported values of $50 000-73 000.
Earlier, Glassnode experts, based on assessing capital movements between hodlers and speculators, concluded that the current structure of the market for the first cryptocurrency resembles the recovery phase after bear dominance in 2016 and 2019.