

Inflation or deflation? How Ethereum’s economy has changed since the Merge hard fork
It is nearly two years since the Merge hard fork replaced Proof-of-Work with Proof-of-Stake on Ethereum. Oleg Cash Coin explains how the economics of the second-largest cryptocurrency have evolved since—and the part institutional investors play.
120,204,432 ETH: where does this figure come from, and what does it mean?
On September 15, 2022, Ethereum’s developers activated the Merge, shifting the blockchain’s consensus mechanism from Proof-of-Work to Proof-of-Stake. The network’s economic model and tokenomics were overhauled as a result.
Across a series of upgrades, developers optimised and altered the issuance of new coins and introduced a mechanism that burns a small portion of ETH in every transaction.
According to Ultra Sound Money, as of July 2024 nearly 305,000 ETH have been burned since Ethereum switched to Proof-of-Stake. That has resulted in a negative net issuance of just 0.138% in total, or less than 0.07% annualised.
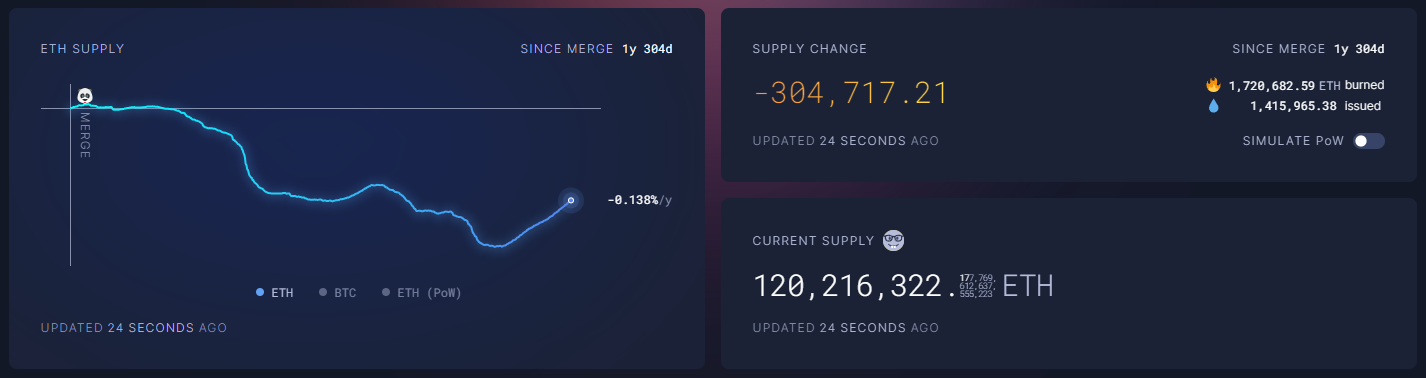
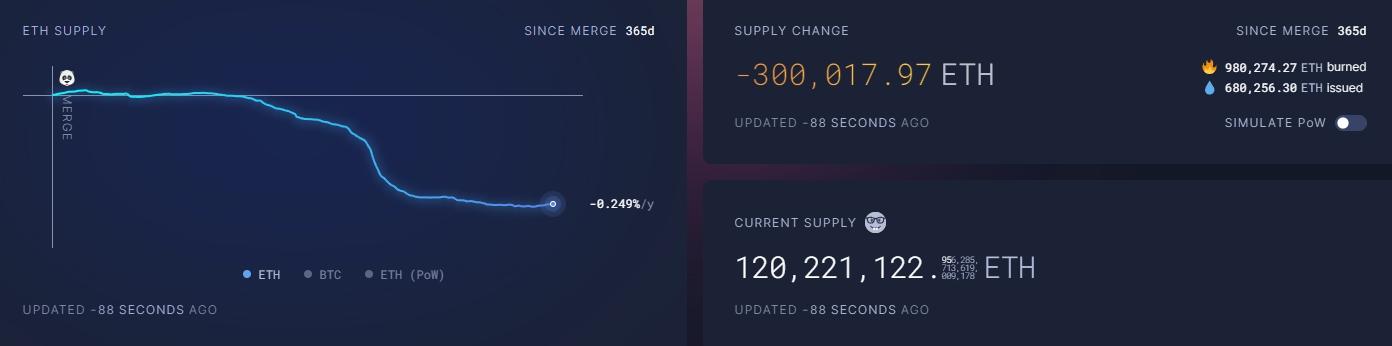
Looking back to September 2023 shows a near-identical picture—both in terms of the net change in coins issued and the total number in circulation.
Back in 2018, Vitalik Buterin proposed capping issuance at 120,204,432 ETH—an almost perfect hit. The envisaged mechanism was different, though: a hard cap akin to bitcoin’s. He arrived at the number by doubling the initial ETH supply sold in the project’s 2014 crowdsale.
It suggests Ethereum’s founder managed to balance burning and new issuance without resorting to a hard cap, unlike bitcoin.
For comparison, digital gold’s inflation rate will be about 0.83% annually until the 2028 halving. If ETH maintains roughly -0.07% annualised, it would in effect be more deflationary. Even so, the two systems’ economic designs differ sharply.
The expansion of decentralised finance (DeFi)—from automated market makers (AMMs) and lending protocols to farming and staking—has created yield-bearing strategies. That has given rise to economic relationships in Ethereum’s blockchain unlike bitcoin’s, making direct comparisons inapt.
What could change?
In March 2024, Ethereum’s developers activated the the Dencun hard fork, introducing several updates, including Proto-Danksharding. It is designed to scale the network by creating a new transaction type for large binary data blobs (BLOBs).
The upgrade duly reduced fees across L2 networks in the ecosystem, especially those based on rollups. Swap transactions in many networks fell to just a few cents—tens, and sometimes hundreds, of times cheaper than before Dencun.
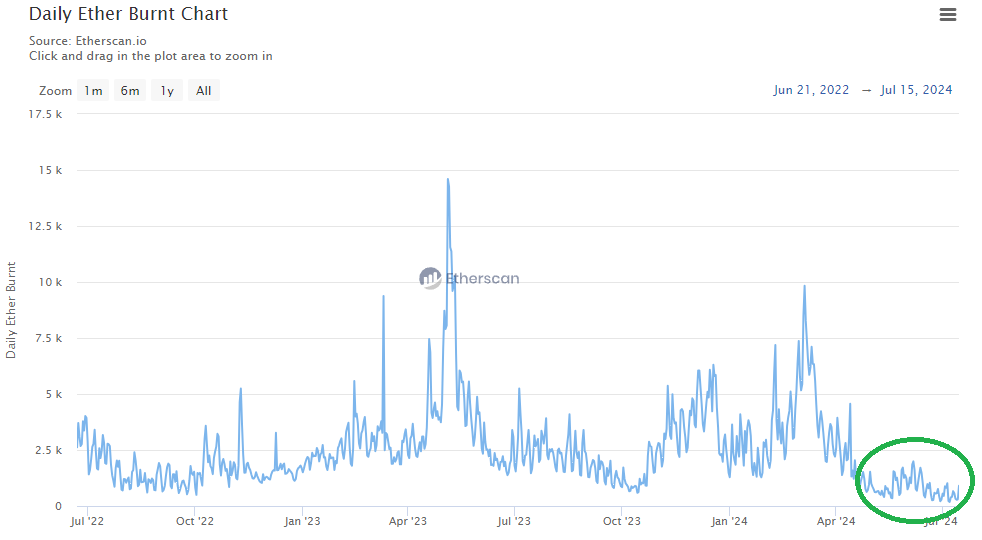
Daily ETH burned also declined, hitting the lowest readings since the 2022 London hard fork that introduced coin burning. On July 7, 2024, Etherscan even recorded a record low of 183 ETH destroyed in a day.
Given that new issuance runs at around 2,500 ETH, even the post‑May 2024 peaks in the 1,000‑ETH‑per‑day burn range do not offset inflation.
The 30‑day burn–issuance delta shows as much, with inflation approaching 0.6% annualised. If the post‑Dencun dynamics persist, ether would fall into the inflationary camp.
Additional pressure
In absolute terms, this implies the creation of about 720,000 ETH ($2.5 billion at the time of writing) per year, instead of a negative issuance of roughly 300,000 ETH in each of the past two years. US spot ETFs could easily absorb such volume.
Note that this is a delta: coins are burned by users making transactions, not by validators. Validators themselves receive more than 900,000 ETH a year (~$3 billion).
ETFs could still absorb that. Analysts at Citi, for instance, expect net inflows into Ethereum-based funds to be 30–35% of bitcoin’s. As CoinDesk reports, that implies $4.7–$5.4 billion in the first six months of trading in ETH ETFs.
However, Ethereum has income streams that can add pressure on price—fees that form an additional reward for validators, for example.
According to The Block, daily L2 revenues slumped after Dencun from $300,000–$600,000 to $100,000–$200,000. Even so, they still amount to significant sums of ETH—around $73 million a year.
Fees on Ethereum’s main chain collected by validators account for about 15% of the coins. That implies another $450 million in passive income. Add to that the yields of popular DeFi protocols, which run at around $1.2 billion a year.
A rough tally suggests passive ETH income of about $4.8 billion a year—broadly in line with the inflows expected from US ETFs.
If the optimistic scenario plays out, institutional inflows could allow Ethereum’s blockchain to offset the selling pressure from coins earned via validation, L2 yields and DeFi protocols.
Text: Oleg Cash Coin.
Рассылки ForkLog: держите руку на пульсе биткоин-индустрии!