


Technical Analyst Warns of Bitcoin’s Waning Bullish Momentum
The price of the leading cryptocurrency is trading sideways around the $120,000 mark. Options data on Deribit indicates a significant positive gamma for dealers at the $120,000 and $120,500 strikes, noted CoinDesk analyst Omkar Godbole.
In this scenario, traders buy on dips and sell on rallies to neutralize risks, which reduces volatility, the expert explained.
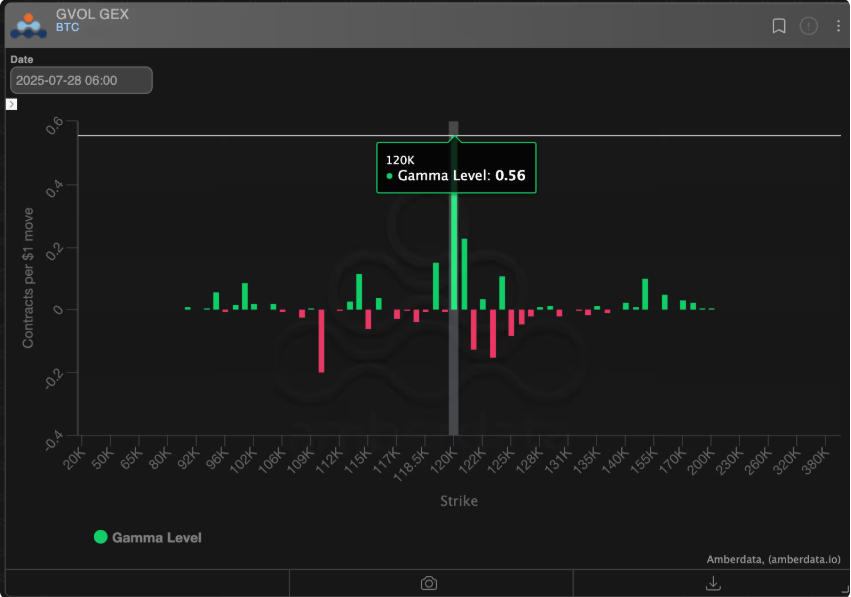
The key support area is in the $116,000–$117,000 range. Breaking this level could pave the way for a retest of the May high below $112,000. According to Godbole, a confident rise above $120,000 could lead to new historical records.
Meanwhile, the daily three-line break chart signals an exhaustion of the upward trend.
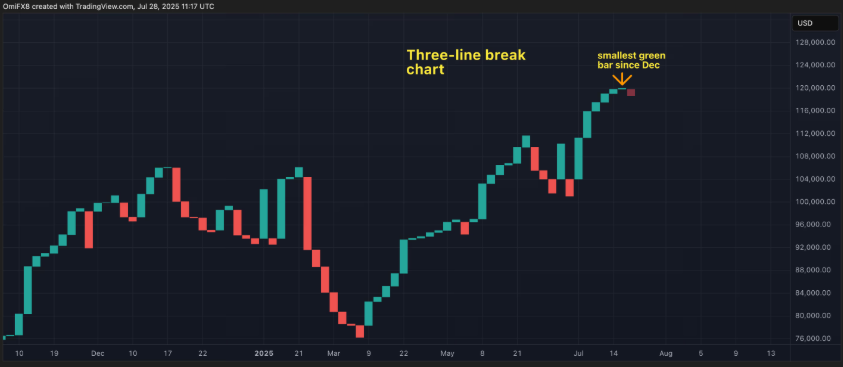
At the time of writing, digital gold is trading at $118,556 (+0.3% over the day), according to CoinGecko.
Ethereum
Over the day, the second-largest cryptocurrency by market capitalization rose nearly 2% to reach a seven-month high of $3,937. However, the momentum was short-lived, and the price quickly corrected to $3,880.
The 14-day Relative Strength Index (RSI) did not confirm the new high, indicating a bearish divergence and potential correction. The MACD histogram on the daily chart also forms a bearish crossover. On-chain metrics, such as fees and network revenues, are not keeping pace with the price increase.

The key support remains at $3,510. The main resistance zone is in the $3,900–$4,100 range.
The price of Ethereum stands at $3,843 (+0.8% over 24 hours).
XRP
Godbole noted that XRP retreated from the $3.35 resistance level, which previously acted as support.
On the hourly chart, the RSI broke the upward trendline, and the MACD crossed the zero mark. This indicates a shift in momentum to bearish. Such a structure suggests a possible retest of the July 24 low at $2.96.
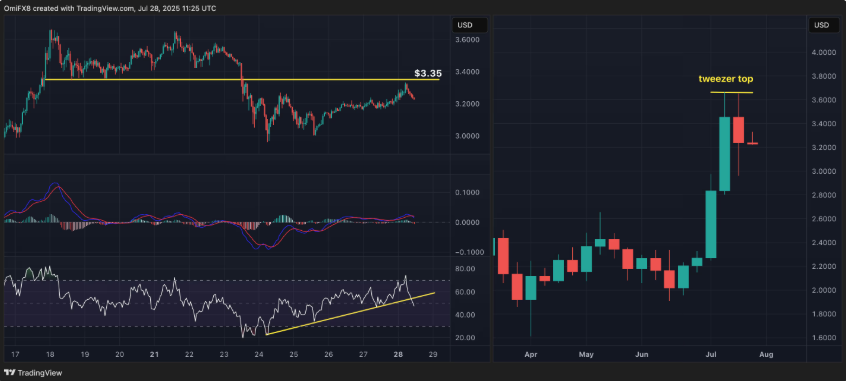
The weekly chart has formed a “tweezer top” pattern, which also signals a trend reversal.
XRP is trading at $3.19, up 0.1% over the day.
Solana
The price of Solana has recovered above the Ichimoku cloud on the hourly chart. This indicates a resumption of upward momentum and a possible retest of the upper boundary of the ascending channel at $200.
However, on the daily chart, the “tweezer” pattern remains active around $205–$206. A move below the $184 support could trigger an accelerated decline to the 200-day moving average at $163.
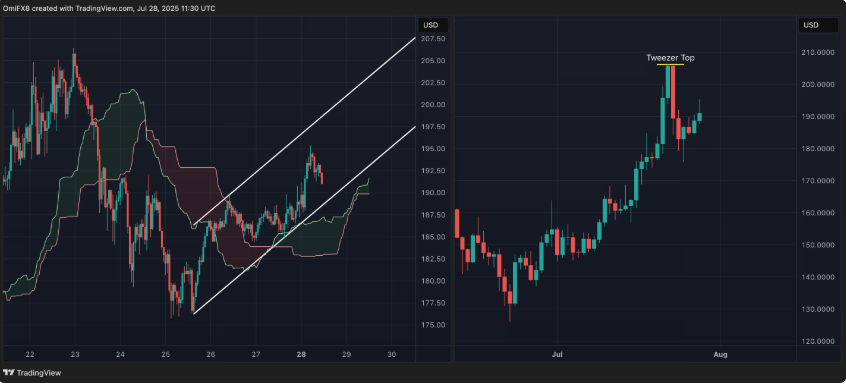
The “people’s cryptocurrency” is priced at $189.18 (+1.7% over 24 hours).
Back in April, analysts at TD Cowen stated that Bitcoin could reach $155,000 by December 2025.
Later, experts at Fairlead Strategies forecasted a rise in the leading cryptocurrency to $135,000, followed by a correction.
Рассылки ForkLog: держите руку на пульсе биткоин-индустрии!