


The daily chart of the leading cryptocurrency has formed two bullish ‘megaphone’ patterns, potentially indicating a move towards new all-time highs, reports Cointelegraph.


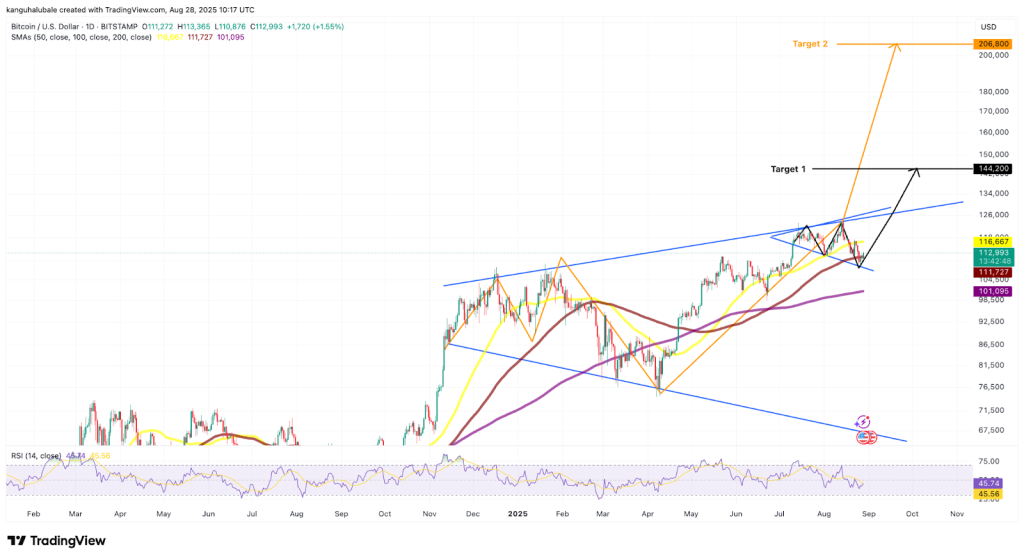
The first pattern emerged on July 11. The lower trend line is at $108,000, while the upper is around $124,900, aligning with Bitcoin’s last all-time high. Breaking this level could pave the way to a target of $144,200.
The second pattern has been forming over the past 280 days, noted analyst Galaxy.
‘Bullish Megaphone’ pattern for the past 280 days. pic.twitter.com/owJy5l4JOt
— Galaxy (@galaxyBTC) August 28, 2025
The nearest resistance is around $125,000. Surpassing this level could trigger a rally to $206,800.
Crypto influencer Faisal Baig highlighted a bullish megaphone pattern on the weekly timeframe with an even more ambitious target of $260,000. According to him, “the next growth phase is inevitable.”
Potential Rebound
The recent correction of digital gold caused panic among short-term holders—investors owning the asset for less than 155 days. Many of them sold at a loss.
Analyst Frank emphasized that during Bitcoin’s pullback to $109,000, the MVRV indicator reached the oversold zone for the first time since April. At that time, the cryptocurrency’s price fell to $74,000, followed by a 51% increase.
On the pullback to $109K, $BTC tapped the ‘Oversold’ zone on the short-term holder MVRV Bollinger Band. The last occurrence was at the $74K bottom in April; since then, BTC is up +51%. pic.twitter.com/cN2FXII4SS
— Frank (@FrankAFetter) August 27, 2025
The current MVRV indicator suggests potential for an upward rebound, the expert noted.
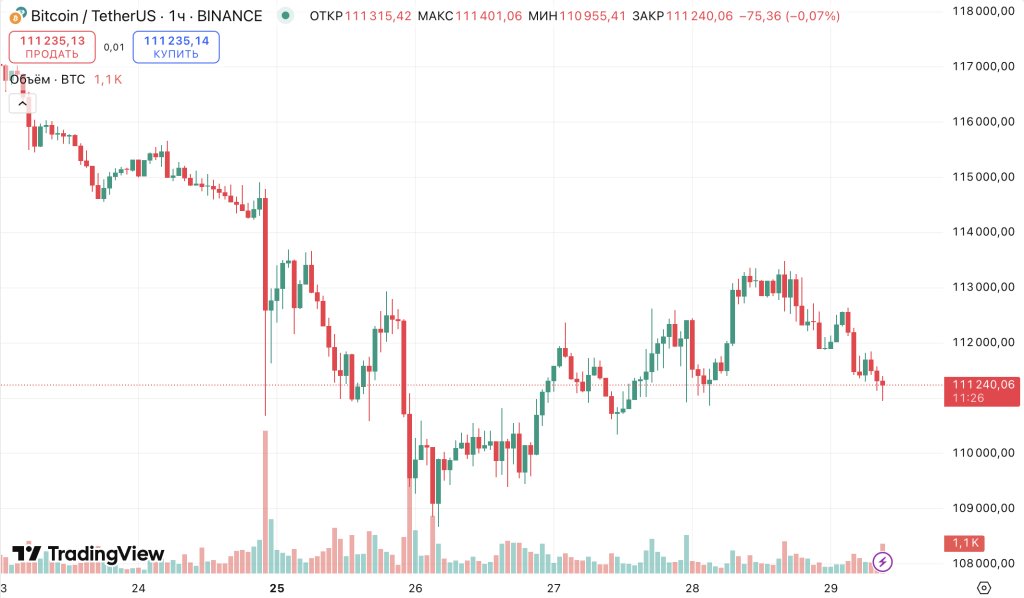
At the time of writing, digital gold is trading at $111,200. Over the past 24 hours, its price has dropped by 1.8%.


Earlier in August, analysts at 10x Research described the possibility of Bitcoin rising to $200,000 as “extremely unlikely.”