


How did the Fear and Greed Index emerge?
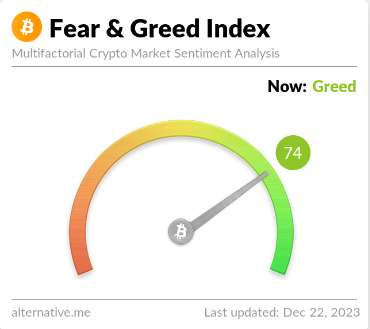
The Crypto Fear & Greed Index is a numerical gauge of sentiment in the crypto market. It runs on a 0–100 scale, where 0 means “Extreme Fear” and 100 “Extreme Greed”.
The index was developed by the Alternative service as a crypto-optimised version of the traditional Fear & Greed Index from CNNMoney.
Both aim to capture the two most powerful emotions in markets. Participants often act irrationally: they buy out of greed, fearing to miss out on gains, and sell into declines out of fear of losing everything.
How is the index calculated?
According to Alternative’s current description, the Fear & Greed Index is calculated solely from bitcoin market data. No other cryptocurrencies influence the reading. The value on the scale is updated daily.


The developers identify five factors used in the calculation.
Volatility. Like the other inputs, it is measured daily, using 30- and 90-day averages. The creators argue that an unusual rise in volatility signals fear.
Market momentum and trading volumes. This combines bitcoin’s price dynamics with buy and sell flows, computed from 30- and 90-day averages. For example, high volumes in a rising market point to heightened greed. These inputs carry the same weight as volatility.
Social networks. The index tracks sentiment on the social network X via unnamed hashtags. The developers believe that high mention counts and rapid user engagement around certain topics indicate greed.
Bitcoin dominance. This is bitcoin’s share of total crypto market capitalisation. Alternative’s analysts reckon that rising dominance points to fear, as users shift liquidity into bitcoin for its perceived reliability. A falling share suggests growing risk appetite and greed as users look for opportunities in altcoins.
Google queries. The team analyses popular bitcoin-related searches via Google Trends. For instance, more searches for “bitcoin price manipulation” point to “fear”, while a rise in “how to buy bitcoin” suggests greed. In the index, this carries the same weight as bitcoin dominance.
Early versions of the index included user surveys, but that source is no longer used in the calculations.
What sentiments does the scale show?
The creators split the scale into five “emotional” zones with the following ranges:
- “Extreme Fear” corresponds to 0–25. At this level, the market is thought to be in a phase where “weak hands” sell in panic. Analysts consider this the most favourable time to buy bitcoin;
- “Fear” covers 26–46, where bearish sentiment is presumed to dominate;
- “Neutral” spans 47–54 and offers no useful signal;
- “Greed” corresponds to 55–75, indicating predominantly bullish sentiment;
- “Extreme Greed” covers 76–100 and may suggest that FOMO dominates the market.
When should you use the index?
The index’s logic boils down to a line by billionaire Warren Buffett: “Buy when everyone is selling, sell when everyone is buying.” The fear-and-greed scale helps reveal the bitcoin market’s emotional state—and, by extension, that of the broader crypto market.
The index is suited to tracking long-term trends rather than active trading. However, the “Extreme Fear” and “Extreme Greed” zones can help optimise strategies such as dollar-cost averaging (Dollar-cost averaging, DCA). The idea is to buy in parts at very low readings and sell at the opposite extreme.