


Cryptocurrencies are distinctive in that on-chain analysis can be applied to them, in ways impossible for traditional financial instruments. Public blockchain data shed light on market activity, sentiment and incentives, enabling patterns to be identified and the most likely price trajectories forecast.
ForkLog has gathered and analysed the most interesting and up-to-date on-chain indicators and assessed what to expect for Bitcoin’s price in the short- and mid-term.
- Many on-chain metrics are delivering positive signals, pointing to a likely resumption of Bitcoin’s rally.
- Large investors are actively accumulating bitcoins on their wallets. Balances on centralized exchanges are falling.
- Some indicators suggest that the market bottom is still far off, so do not rule out a drop below $30,000.
Positive signals
Bitcoin whale wallets. In early July, Bitcoin addresses with balances between 100 BTC and 10,000 BTC increased their positions by 60,000 BTC — to 9.12 million BTC.
According to Santiment analysts, this was the largest Bitcoin accumulation spike by large holders in 2021. The activity of big players helped drive the rally that began in October 2020 and pushed Bitcoin’s price to record highs in April 2021.
Researcher Omkar Godbole at CoinDesk in early July found a sharp rise in supply on addresses holding 1,000 to 10,000 BTC. The aggregate figure reached 4.216 million BTC, the highest since May.


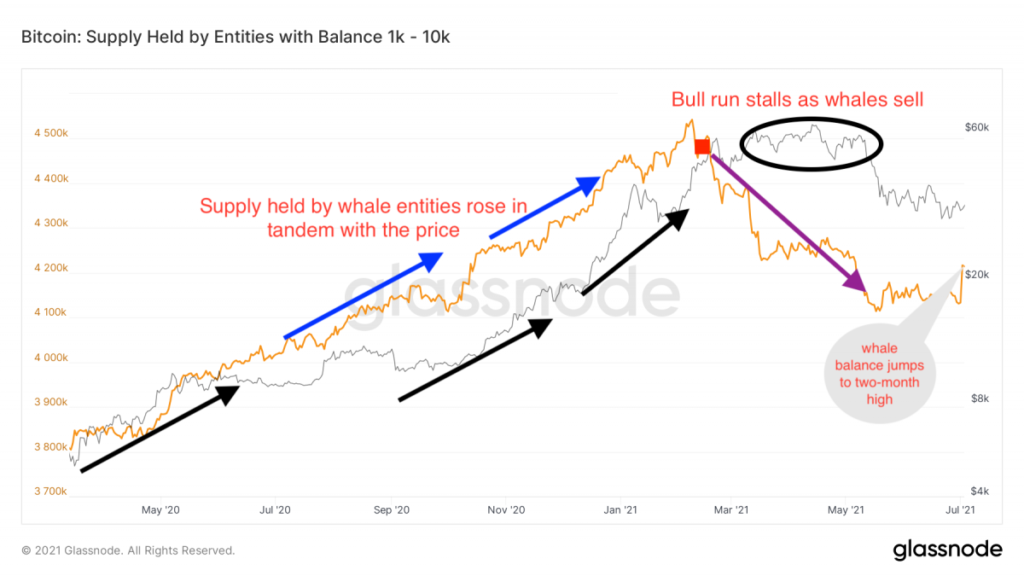
As shown on the chart, before this, whale balances rose in tandem with the price. The trend continued since spring last year. On February 8 the indicator reached a peak of 4.542 million BTC. A sharp decline in balances followed, halting the price rally.
«In the following months, the whales became sellers, dispelling the bullish trend. And by early May their Bitcoin holdings had fallen by 8% — to 4.17 million BTC», — Godbole shared.
According to the expert, the latest spike in big players’ balances may indicate that the market has reached a bottom.
Similar patterns were detected by on-chain analyst William Clemente III. On his Bitcoin Liquid Supply Ratio indicator a bullish divergence is visible.
In Decentrader’s blog the following is stated:
«Keeping the trend could mean market participants are realising Bitcoin is undervalued at current prices».
Alongside whale activity the positive signal can be the decline in centralized exchange balances.


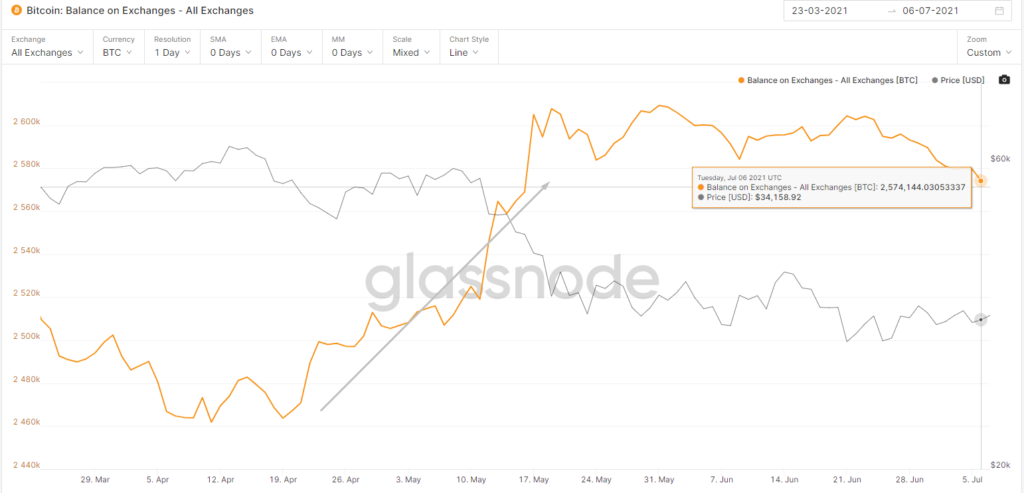
As shown, the chart above clearly shows the rise in the metric from the second half of April to mid-May. After that momentum slowed and by late June it declined. In early July, the metric dropped to mid-May levels.
Significant declines in exchange balances signal reduced potential selling pressure and the market participants’ intent to store funds long-term in non-custodial wallets. A portion of investors may convert digital gold into tokenised equivalents to earn yield in DeFi apps or to issue stablecoins via platforms like Maker.
The speculative activity of short-term investors, typical of an overheated market, is waning. This is evidenced by the dynamics of HODL waves.


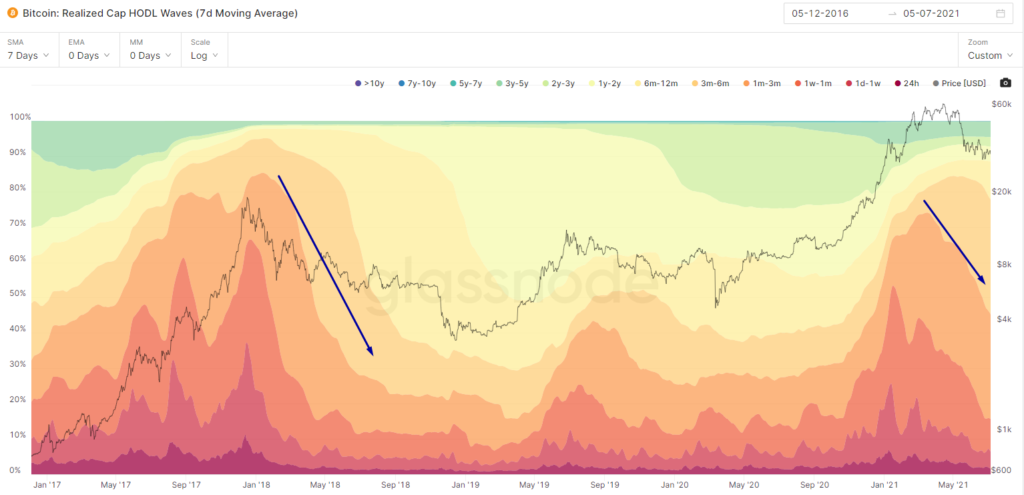
On the chart above the red bars show the share of the supply that has moved recently — from one day to 90–180 days ago.
Historically the share of the ‘young’ supply spiked at market-cycle peaks. For example, in December 2017 more than 32% of the total Bitcoin supply showed activity within 90 days ahead of prices near $20,000. By August 2018 this metric had fallen to 15%.
Since the first quarter of this year a similar drop in short-term investor supply has been observed, albeit not as sharp. Going forward, it would be prudent to watch the dynamics of long-term investors’ supply, represented by the green lines at the top of the chart. These ranges tend to widen as the market nears the bottom of its cycle.
Miners’ Capitulation. On July 3, Bitcoin mining difficulty fell by a record 27.94%.
The difficulty metric correlates with the hash rate. In May the network’s mining power for the leading cryptocurrency fell by 20% due to power outages in China’s Sichuan province. In June the hash rate continued to decline amid crackdowns on the crypto industry in China, prompting miners to flee the country.
Analyst Willy Woo dubbed the development “the political version of miners’ capitulation”.
«Historically miners’ capitulation is a good bottom indicator», — the researcher emphasized.
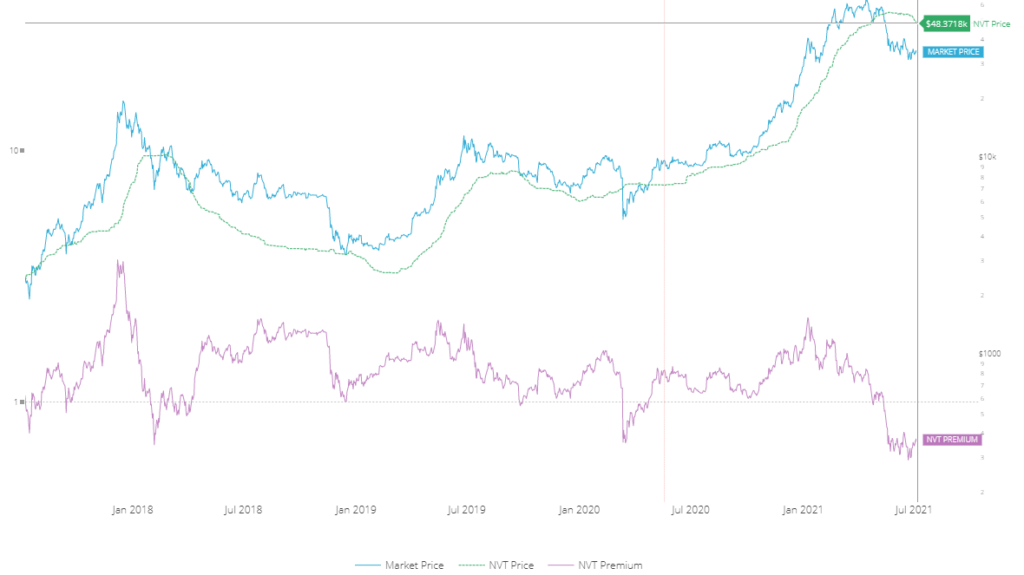
Based on data from the NVT Price indicator, Bitcoin’s fundamental value sits near $48,000. Accordingly, as of writing (7 July 2021), the leading cryptocurrency is undervalued by the market.


The popular Stock-to-Flow (S2F) model also signals the end of the correction. Analyst Michaël van de Poppe noted that Bitcoin’s ‘undervaluation’ in S2F has reached its peak in the last ten years.
He did not rule out that the “crowd” will ignore it and wait for a drop to $20,000.
Puell Multiple. This indicator was proposed in 2019 by cryptopoiesis researcher. The “Bitcoin Market Cycle Barometer” is the ratio of the daily BTC supply issued in dollars to the same measure, but smoothed with a 365-day moving average. As with many such indicators, it helps determine whether Bitcoin is overbought or oversold.”
«Puell Multiple — historically a reliable data-science indicator pointing to meaningful shifts in miners’ psychology», — said in the Rekt Capital blog.
The graph below shows the indicator values have reached the green zone, indicating oversold Bitcoin.


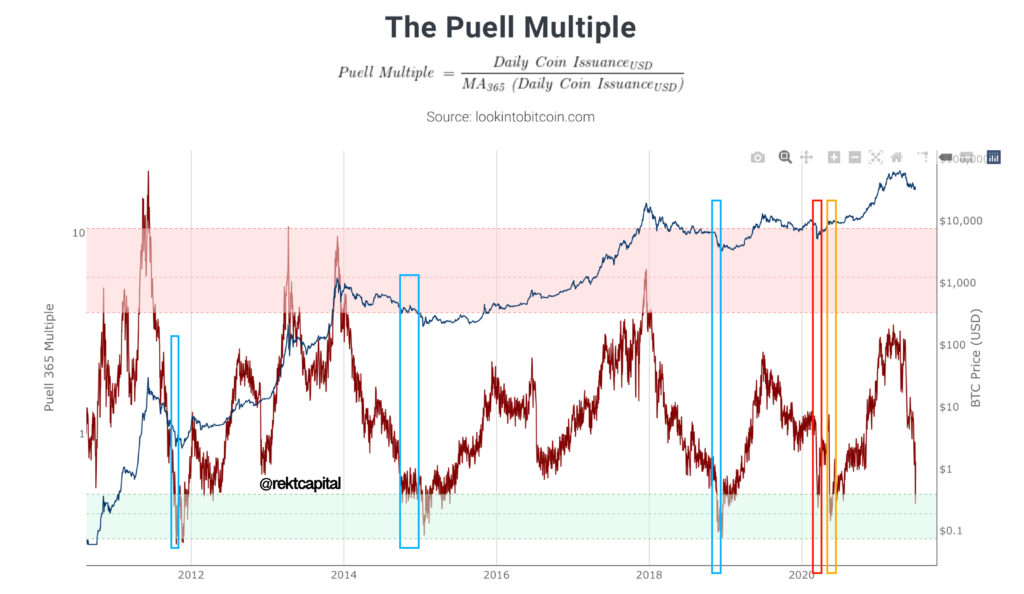
«It should be stressed that simply reaching this zone does not mean Bitcoin has necessarily bottomed. It is merely a sign of BTC undervaluation», — said the author of the article.
Blue boxes highlight moments when the indicator has already moved into the green zone, but the price has not yet bottomed. The red box marks Bitcoin’s price dropping below $4,000 in March 2020.
«This is the only history where BTC bottomed at the first visit to the Puell Multiple green zone», — according to the Rekt Capital blog.
After that the indicator again visited the oversold range (yellow box), signaling price consolidation and subsequent rebound.
It can be concluded that usually the first reach of the green zone does not coincide with Bitcoin’s bottom. A signal confirming the market bottom could be a retest of the zone by the indicator. After that, one should not expect a V-shaped reversal — consolidation usually precedes a rebound.
In the next chart the blue trendline connects the Puell Multiple’s lower values, each slightly higher than the previous one. Since the red line has not yet touched the blue, let alone retested it, Bitcoin’s price bottom has not yet been reached. Notably, corrections were not preceded by the red zone of overbought conditions.
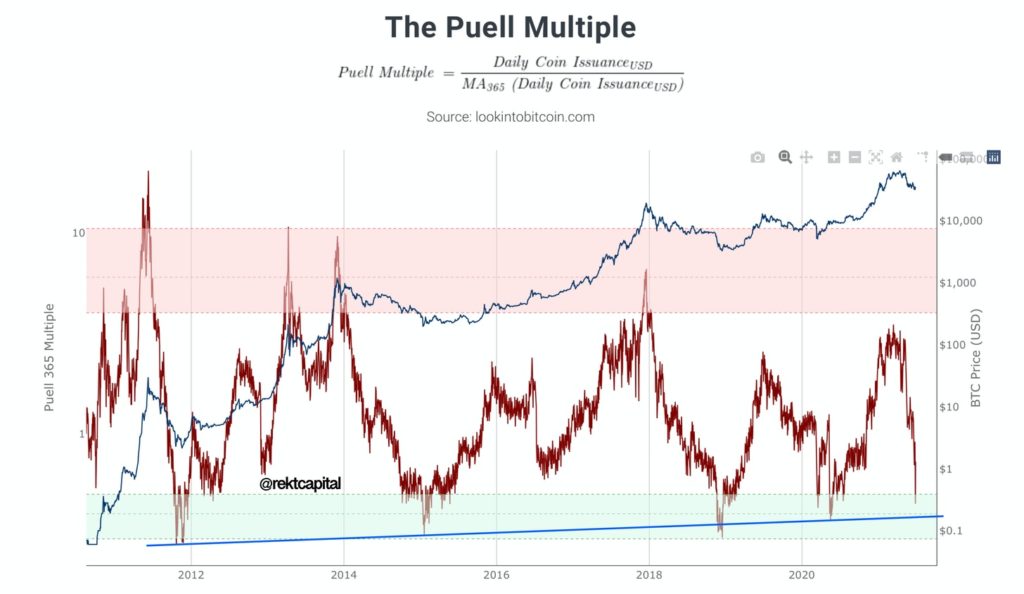
In this context it will be interesting to observe whether the $29,000–$39,000 range holds against the Puell Multiple trendline. If it does, according to the author of the Rekt Capital blog, this would serve as confirmation of “Bitcoin price stability.”
Neutral signals
The values of the MVRV Z-Score are approaching 1, a level at which Bitcoin is neither overvalued nor undervalued by the market.


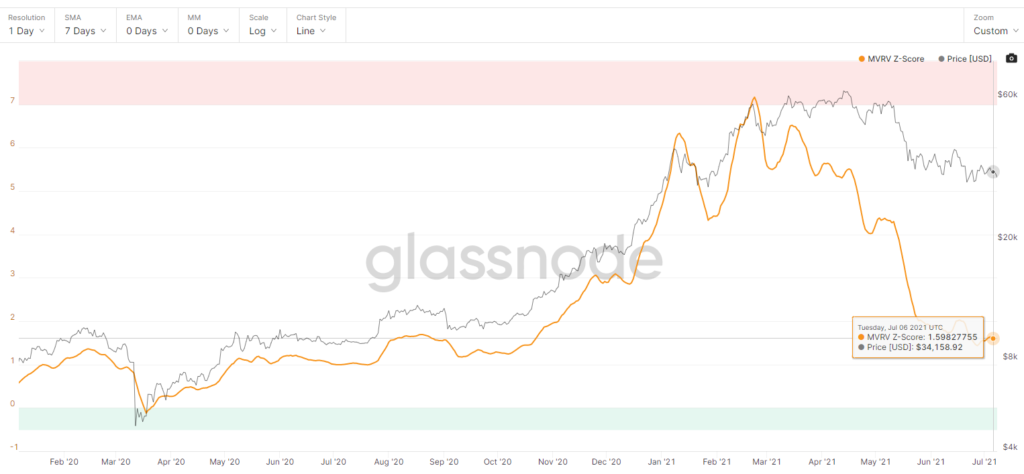
The overbought zone, according to the MVRV Z-Score, was reached as early as the end of February this year. Yet the deep oversold zone favourable to buyers, as seen in March 2020, remains well ahead.
The Market Value to Realized Value (MVRV) indicator was developed by Murad Mahmudov and David Puell. They first tested this tool in 2018 to identify overvaluation and undervaluation of assets.
Crypto analyst Awe & Wonder refined MVRV, adapting the indicator for more reliable trading decisions. The modified version is called MVRV Z-Score.
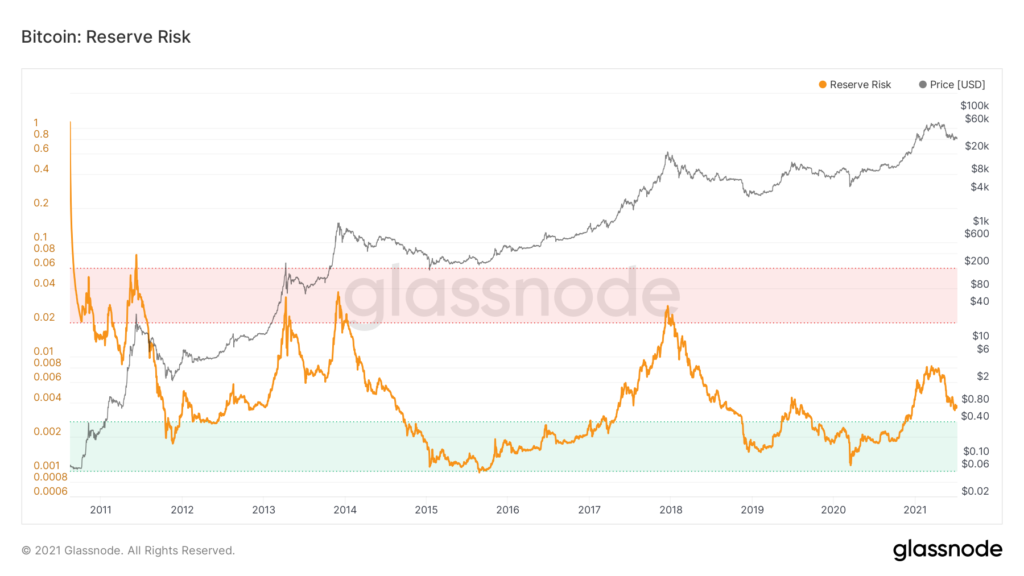
Next notable indicator — Reserve Risk.
«It is used to assess long-term holders’ confidence in the price of the native coin at a given moment. When confidence is high and price is low, the risk-reward ratio (Reserve Risk at low levels) becomes attractive. When confidence is low and price is high, this ratio becomes unattractive (Reserve Risk at high levels)», — described in Glassnode.
The chart below shows that Reserve Risk values have not yet reached the green zone that is most favourable for investors.
SOPR. This indicator can be used to identify periods when many holders realise profits or sell digital gold at a loss. In these periods bullish and bearish sentiments prevail respectively.
The metric is the ratio of Bitcoin’s price at the time of spending a transaction’s UTXO to the market value of the last one at the moment of its creation. Essentially, it is the ratio of sale price to purchase price.
On the chart below is the dynamics of the aSOPR indicator, which ignores outputs with a lifecycle under an hour. Because the metric is quite volatile, its values are smoothed with a 7-day moving average.
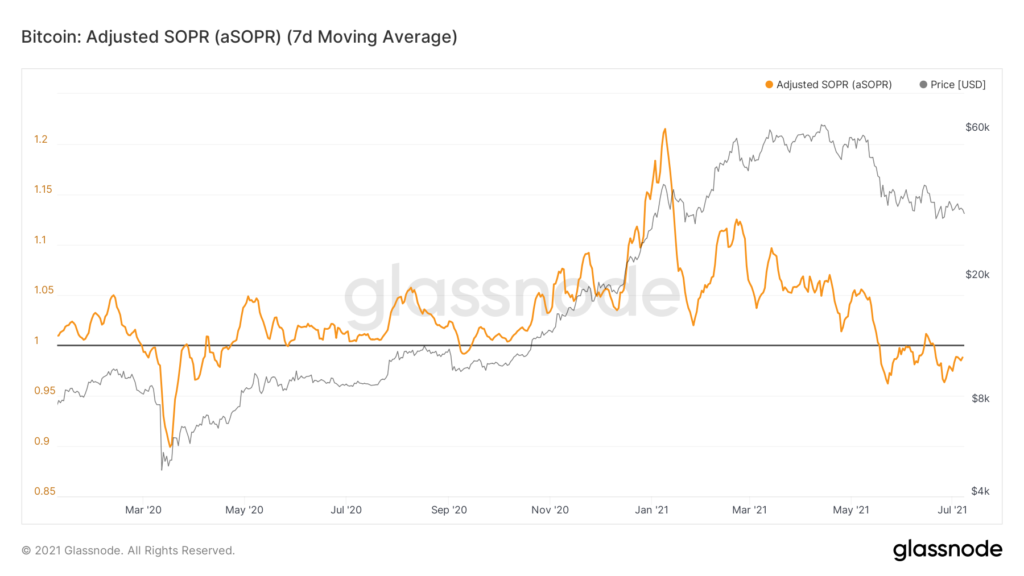
aSOPR values since mid-May have been below 1. This points to prevailing panic among investors, multiple realised losses and Bitcoin being oversold.
Similar dynamics were seen in March 2020, when the price was well below $10,000. Yet current aSOPR values are not as low — for now this merely signals bearish sentiment and possible undervaluation of the cryptocurrency. To confirm a market-cycle bottom, additional signals are needed.
2-Year MA Multiplier is also at neutral levels — its values sit above the green line, which represents the two-year moving average. The indicator was developed by the founder of LookIntoBitcoin and Decentrader analyst Philip Swift.


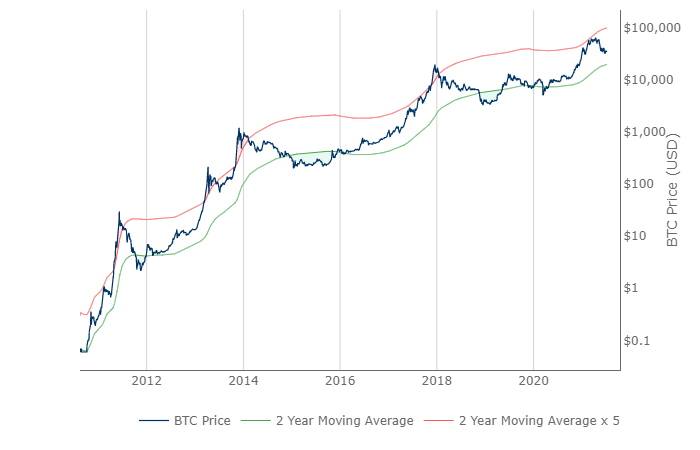
On the chart above, the green zones mark optimal periods for long-term bitcoin purchases. These are:
- October 2011 — January 2012;
- January 2015 — November 2015;
- November 2018 — May 2019;
- March 2020.
This year the indicator has not crossed the red line of extreme overbought as in December 2017. Accordingly, the peak of the 2021 bull market did not precede a deep correction.
Nor does it indicate the bottom and Realized HODL Ratio. This metric is based on HODL waves.
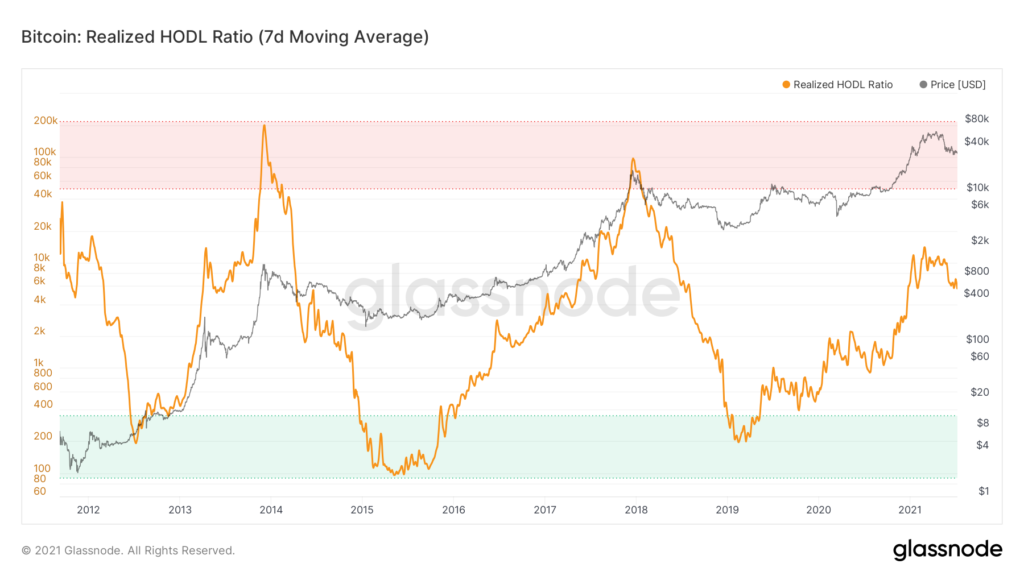
This indicator was also developed by Philip Swift. In May 2019 it last signalled deep oversold conditions.
Similar signals come from the Market Cap to Thermocap indicator. This indicator is calculated by dividing Bitcoin’s market capitalisation by the miners’ lifetime revenue (Thermocap).
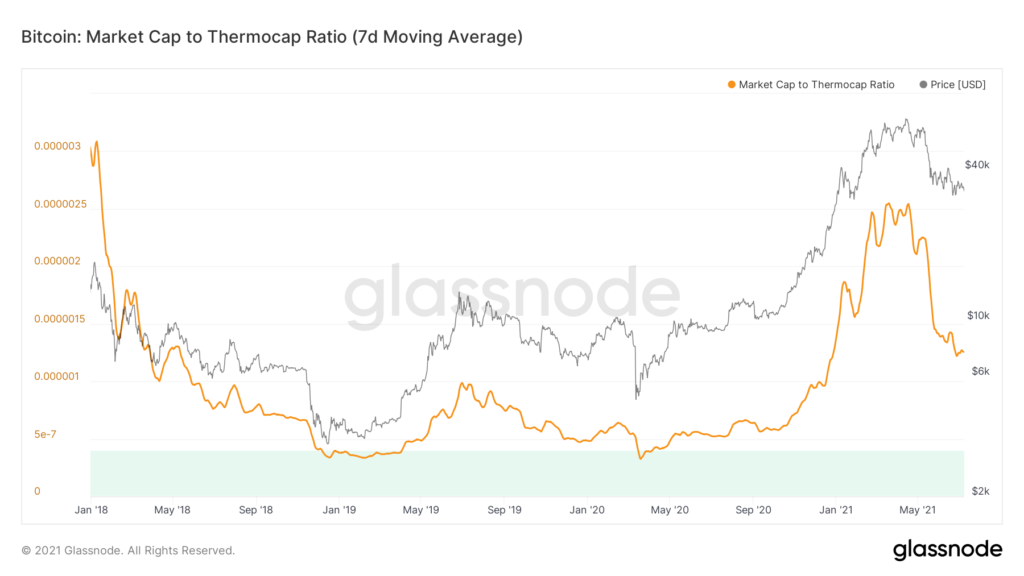
Historically high readings of Market Cap to Thermocap signal that Bitcoin is at the top of the market cycle. Conversely, low values indicate a relatively favourable period for purchases.
Last time Market Cap to Thermocap dipped into the green zone was in March 2020, and before that in early 2019.
Similarly, at neutral levels the indicator Relative Unrealized Profit/Loss, based on the relationship between market and realized capitalization, signals the same themes.
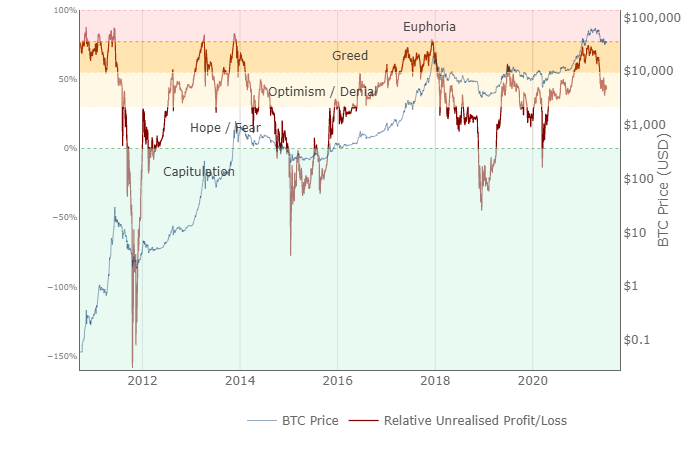
The indicator’s red lines are in the ‘Optimism/Denial’ zone and have not yet reached the ‘Hope/Fear’ range, not to mention ‘Capitulation’. The latter was relevant at the 2018–2019 turning points and in March 2020.
Negative and dual signals
In June, trading volume on cryptocurrency exchanges fell by about half — 52%. The metric reached a five-month low of $1.2 trillion.


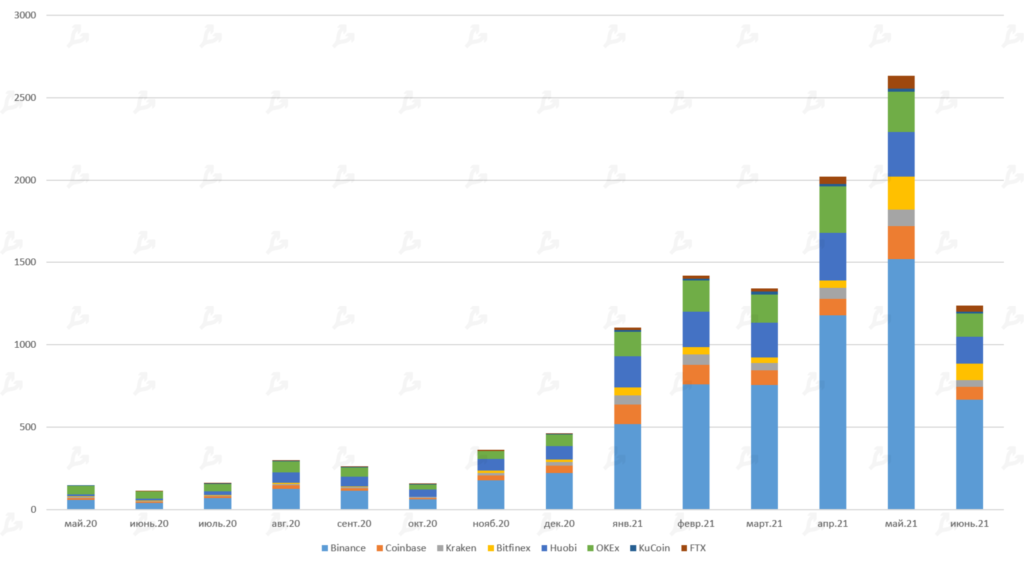
On the one hand, the drop in exchange turnover is a clear sign of cooling speculative hype. On the other, it may indicate that a bottom has been reached. In this period, small traders are demotivated, while big players accumulate, convinced that current prices are fundamentally low.
Another dual signal is the low, or even negative, funding rates for margin lending.
The chart below shows that the period of ultra-low and negative rates has stretched since the second half of May.


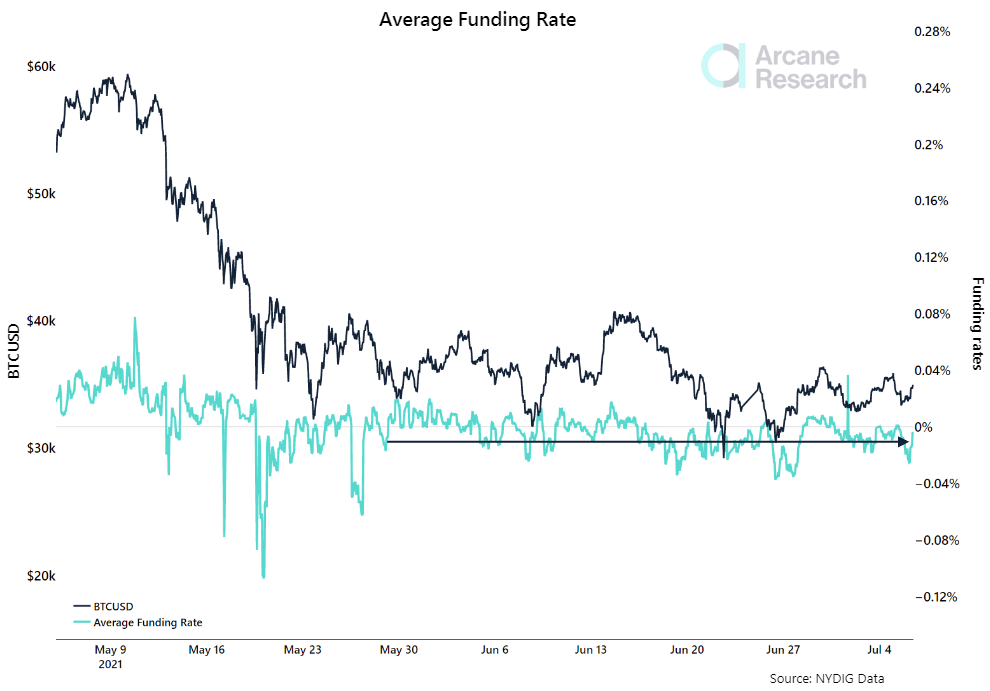
«Short holders continue to trade in perpetual swaps with high confidence, — Arcane Research analysts commented. — Open interest in the futures market remains near $11.5 billion. This presumably points to subdued appetite among participants.»
There is, however, a tilt of positives in this bearish signal. Decentrader suggests that such a protracted rate environment may provoke a short-squeeze. Yet a short-squeeze often ends in further declines as supply outstrips demand when fundamentals are unchanged.
In June, CEO Ki Young Ju tweeted that the bear market “is confirmed, as whales are sending their Bitcoin to exchanges,” a development that could press prices lower.
I hate to say this, but it seems like the $BTC bear market confirmed.
Too many whales are sending $BTC to exchanges. https://t.co/DgmLukP4NU pic.twitter.com/AWJ8oVSUkQ
— Ki Young Ju (@ki_young_ju) June 21, 2021
«Stop trading, be patient and wait for the next bout of volatility», — Ju advised.
In conversation with Decrypt he noted that the market is historically bearish when whale inflows dominate. He did not rule out that price action could be a prolonged sequence of corrections.
Analyst Alex Krüger agreed with Ju. He stressed that the market is “definitely bearish.”
«The only positive thing on the horizon is that everyone is extremely bearish», — he said.
Krüger added that “it could have been worse” and that there is no single definition of a bear market.
What does the technical analysis say?
The chart below shows that since the third decade of May the price has been range-bound between $29,000–$31,000 and around $41,000.


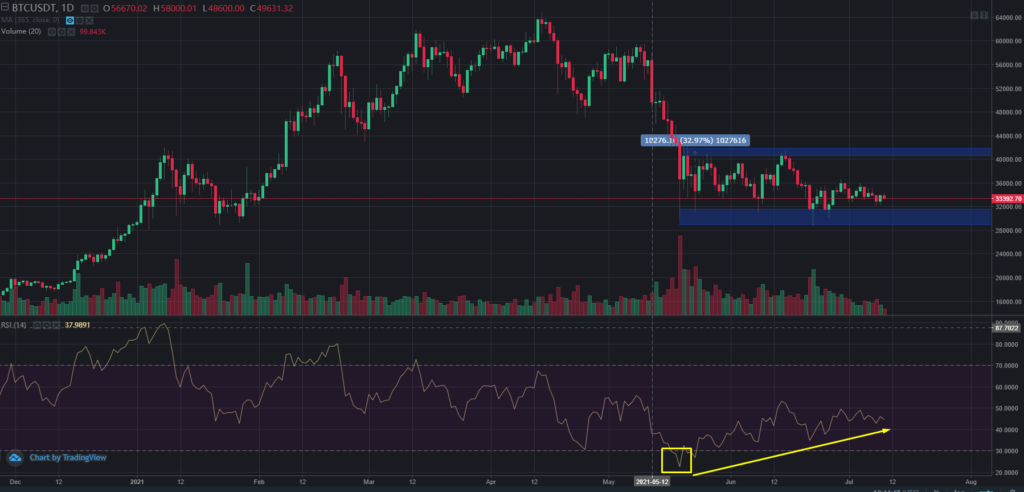
A positive factor is rising RSI values. In May it signalled deep market oversold conditions, dropping below 30 for the first time since March 2020.
On the other hand, the range above forms a continuation pattern — a rectangle. Consequently, the probability of a continuation of the fall after the flat is high.
Trader @filbfilb sees in the current move a Wyckoff accumulation phase preceding an uptrend.
In the tweet’s attached diagram it appears that before breaking the upper bound of the range there should be a retest and a renewed local minimum — a bearish Spring trap.
Conclusions
Many indicators are delivering positive signals, some neutral. The relatively few negative signals may point not to a bear market but to Bitcoin’s oversold condition driven largely by short-term investors.
Opinions among prominent technical analysts vary widely — each interprets the situation in his own way. For some, market conditions are a temporary correction and a good opportunity to buy cheaper; for others, an apparent trend reversal and a new bear market cycle.
The key market drivers remain long-term investors building positions. Whales are accumulating on addresses amid renewed institutional activity, which for the first time in a long while has increased investments in crypto funds. This is a positive signal portending a likely uptrend.
In any case, the degree of uncertainty remains high. That suggests investors should tread carefully, not ruling out the possibility of a break below $30,000 and a move toward the high of the previous bull cycle around $20,000.
Subscribe to ForkLog news on Telegram: ForkLog Feed — all the headlines, ForkLog — the most important news, infographics and opinions.