


The Relative Strength Index (RSI) on Bitcoin’s chart fell below 20 for the first time since March 2020. Back then, the leading cryptocurrency plunged below $4,000 amid the COVID-19 pandemic, writes CoinDesk.
In technical analysis, the RSI indicator signals whether the asset is oversold or overbought. Details can be found in the ForkLog cards.


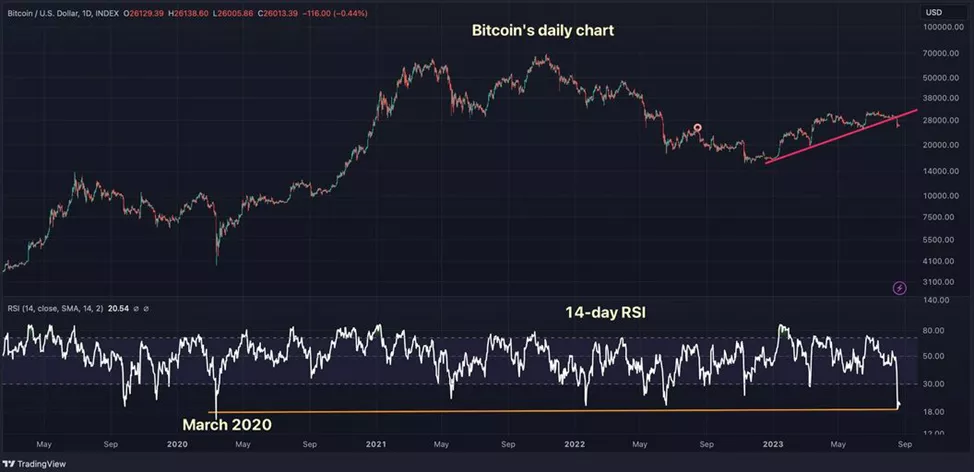
The publication cautioned that reaching extreme-value zones is not a call to action, but merely signals sharp price changes in either direction.
Senior FxPro analyst Alex Kuptsievich noted a shift in Bitcoin’s trend from bullish to bearish.
Earlier, Glassnode experts pointed to a drop to 12% in the share of profitable coins among speculators.
Analysts linked the deterioration in market conditions to a possible sale by SpaceX, Elon Musk’s company, of part or all of Bitcoin holdings worth $373 million. Other cited reasons included the recent rise in government bond yields and concerns about the stability of China’s real estate market.
Experts from CoinShares attributed the sales to the postponement of the SEC decision on the Bitcoin-ETF launch application from ARK Invest and 21Shares.